Prefabricated Steel Bridge Systems: Final Report
6. Optimization Results And Discussions
In this study both cast-in-place (CIP) and precast modular bridge systems are considered. The maximum span length limits for both concepts are established based on the optimization principles presented in Chapter 5. The effect of using high strength and light weight concrete are investigated for both design concepts.
6.1 Studied Parameters and Limits Considerations
Transportation limits are based on the maximum weight that can be transported safely. Since the cast-in-place Modular bridge system does not include the weight of the deck during transportation, longer spans for the same weight limits when compared to the precast modular system will be expected. The studied parameters are presented in Table 6.1. A total of 64 optimization analyses are carried out. The parameters considered in these analyses include:
- Concrete unit weight (normal and light weight),
- Deck slab thickness (6 and 8 inches),
- Concrete strength (5 and 15 ksi),
Each optimization analysis is checked against the AASHTO LRFD Specifications design requirements and satisfies both fatigue and deflection limits.
Following are the limits used in the optimization analyses:
- Weight Limit: The largest precast concrete beam ever used for highway bridges was in Oregon for the Chemult Bridge project on U.S. 97 (Alex Paul, Albany Democrat-Herald 2005). The girder weight approached 180.0 kips and was transported by conventional methods.
Informal discussion with members of the trucking industry and bridge producers concluded that a maximum load limit of 200.0 kips can be transported safely using conventional methods. Therefore, the 200 kips weight limit is used as the limiting value for the optimization analysis.
- Deflection Limit: The deflection due to the live loads (including lane load and truck load considerations) has also been limited as follows, as per LRFD 2.5.2.6.2:
Δmax = max. (Δ1 ; Δ2 ) ≤ Span / 800
Δ1 = 0.25ΔTL + ΔLL and Δ2 = ΔTL
Where ΔTL is the deflection due to truck load and ΔLL is the deflection due to lane load.
- Steel Girder Height: Generally, optimization of the bridge would result in steel girders with deep webs and narrow flanges since, in most cases, it results in the best economical solution. However, practical bridge applications generally require the shallowest possible sections to reduce the amount of fill required to construct the roadway. Therefore, in the optimization analysis the web depth is limited to the maximum depth of an equivalent AASHTO girder corresponding to the span considered. For instance, for a span up to 50 feet, AASHTO Type II girders with a height of 36 inches can be used, whereas for a span up to 120 feet, AASHTO Type V girders with a height of 63 inches is adequate. These arbitrary height limits are important to produce practical designs that are comparable to existing bridges. It should also be pointed out that in bridge replacement, the height limits are set by the site conditions.
| Parameter | Value |
|---|---|
| Span Length (4 lengths) | L1 = 60 ft; L2 = 90 ft; L3 = 120 ft; etc. up to Lmax(*) |
| Slab Thickness (2 thicknesses) | ts1 = 6 in.; ts2 = 8 in. |
| Concrete Strength (2 strengths) | fc = 5 ksi; fc = 15 ksi |
| Concrete Type (2 types) | Type1 = normal weight; Type2 = light weight |
Note: (*) Lmax corresponds to the maximum total weight (i.e., approximately 200 kips)
6.2 Presentation and Discussion of Results
The results for the cast-in-place (CIP) modular bridge concept are presented in Table 6.2for normal weight concrete (NWC),and inTable 6.3 for light weight concrete (LWC).
| (a) fc′ = 5ksi (a1) 6 inches thick normal weight concrete deck | |||||||
|---|---|---|---|---|---|---|---|
| Span Length (ft) | 60 | 90 | 120 | 150 | 220 | 240 | 225 |
| Total weight (kips) | 25.061 | 40.693 | 62.067 | 86.260 | 187.714 | 237.956 | 200 |
| Steel weight (kips) | 14 | 12 | 12 | 12 | 14 | 22 | |
| Concrete weight (kips) | 34 | 49 | 62 | 69 | 101 | 109 | |
| Top flange width (in.) | 12 | 12 | 12 | 16 | 16 | 13 | |
| Web thickness (in.) | 0.75 | 0.75 | 0.75 | 0.75 | 1.375 | 1.25 | |
| Bottom flange thickness (in) | 0.4375 | 0.4375 | 0.5 | 0.5 | 0.625 | 0.6875 | |
| Top flange thickness (in) | 0.75 | 0.75 | 0.75 | 0.875 | 1 | 1.25 | |
| (b) fc' = 15ksi (b1) 6 inches thick normal weight concrete deck | ||||||
|---|---|---|---|---|---|---|
| Span Length (ft) | 60 | 90 | 120 | 220 | 240 | 249 |
| Total weight (kips) | 23.913 | 39.621 | 58.851 | 158.144 | 187.017 | 200 |
| Steel weight (kips) | 12 | 12 | 12 | 12 | 13 | |
| Concrete weight (kips) | 31 | 45 | 55 | 97 | 101 | |
| Top flange width (in.) | 12 | 12 | 16 | 12 | 13 | |
| Web thickness (in.) | 0.75 | 0.75 | 0.75 | 0.75 | 0.75 | |
| Bottom flange thickness (in) | 0.4375 | 0.4375 | 0.4375 | 0.625 | 0.625 | |
| Top flange thickness (in) | 0.75 | 0.75 | 0.75 | 0.75 | 1.125 | |
| (a) fc' = 5 ksi 6in light weight concrete deck | |||||||
|---|---|---|---|---|---|---|---|
| Span Length (ft) | 60 | 90 | 120 | 150 | 220 | 240 | 226 |
| Total weight (kips) | 24.63 | 41.23 | 63.70 | 89.07 | 184.53 | 233.26 | 200.00 |
| Steel weight (kips) | 12 | 12 | 12 | 12 | 14 | 15 | |
| Concrete weight (kips) | 35 | 51 | 63 | 71 | 101 | 109 | |
| Top flange width (in.) | 12 | 12 | 14 | 18 | 12 | 12 | |
| Web thickness (in.) | 0.75 | 0.75 | 0.75 | 0.75 | 1.1875 | 1.625 | |
| Bottom flange thickness (in) | 0.4375 | 0.4375 | 0.5 | 0.5 | 0.625 | 0.6875 | |
| Top flange thickness (in) | 0.75 | 0.75 | 0.75 | 0.875 | 1.375 | 1.375 | |
| (b) fc' = 15 ksi 6in light weight concrete deck | ||||||
|---|---|---|---|---|---|---|
| Span Length (ft) | 60 | 90 | 120 | 220 | 240 | 244 |
| Total weight (kips) | 24.27 | 40.16 | 59.57 | 161.89 | 194.16 | 200.00 |
| Steel weight (kips) | 12 | 12 | 12 | 12 | 14 | |
| Concrete weight (kips) | 33 | 47 | 57 | 101 | 105 | |
| Top flange width (in.) | 12 | 12 | 16 | 12 | 17 | |
| Web thickness (in.) | 0.75 | 0.75 | 0.75 | 0.75 | 0.8125 | |
| Bottom flange thickness (in) | 0.4375 | 0.4375 | 0.4375 | 0.625 | 0.625 | |
| Top flange thickness (in) | 0.75 | 0.75 | 0.75 | 0.75 | 0.875 | |
Similarly, for the precast modular concept, Table 6.4 and Table 6.5 present results for NWC and LWC, respectively. The values given in these tables are those of a 12 ft bridge system made of 2 steel girders and a 12 foot wide concrete deck as described in Chapter 4. These results are discussed below in terms of: (i) the effect of the slab thickness; (ii) the effect of concrete strength; and (iii) the effect of the weight of concrete. It must be realized that these discussions are aimed at showing the potential possibilities that can be derived from optimization analyses. Therefore, the effect of other aspects on any parameter can be evaluated in an objective manner and taking into account constraints imposed by considerations such as the codes, cost, weight and any other controlling parameters.
| (a) fc' = 5 ksi (a1) 8in deck - normal weight concrete | |||||
|---|---|---|---|---|---|
| Span Length (ft) | 60 | 90 | 120 | 130 | 130 |
| Total weight (kips) | 85.32 | 133.53 | 181.36 | 199.35 | 200 |
| Steel weight (kips) | 13.32 | 25.53 | 37.36 | 43.35 | 43 |
| Concrete weight (kips) | 72.00 | 108.00 | 144.00 | 156.00 | 156 |
| Top flange width (in.) | 14 | 14 | 12 | 12 | |
| Web height (in.) | 30 | 49 | 52 | 59 | |
| Bottom flange width (in) | 12 | 13 | 16 | 14 | |
| Top flange thickness (in) | 0.75 | 0.75 | 0.75 | 0.75 | |
| Web thickness (in) | 0.4375 | 0.4375 | 0.4375 | 0.5 | |
| Bottom flange thickness (in) | 0.75 | 0.75 | 0.875 | 0.75 | |
| (a2) 6in slab - normal weight concrete | |||||
|---|---|---|---|---|---|
| Span Length (ft) | 60 | 90 | 120 | 150 | 154 |
| Total weight (kips) | 68.04 | 105.16 | 148.02 | 193.70 | 200 |
| Steel weight (kips) | 14.04 | 24.16 | 40.02 | 58.70 | 61 |
| Concrete weight (kips) | 54.00 | 81.00 | 108.00 | 135.00 | 139 |
| Top flange width (in.) | 14 | 12 | 12 | 12 | |
| Web height (in.) | 34 | 49 | 62 | 69 | |
| Bottom flange width (in.) | 12 | 12 | 12 | 16 | |
| Top flange thickness (in.) | 0.75 | 0.75 | 0.75 | 0.75 | |
| Web thickness (in.) | 0.4375 | 0.4375 | 0.5 | 0.5 | |
| Bottom flange thickness (in.) | 0.75 | 0.75 | 0.75 | 0.875 | |
| (b) fc' = 15 ksi (b1) 8in slab - normal weight concrete | |||||
|---|---|---|---|---|---|
| Span Length (ft) | 60 | 90 | 120 | 130 | 132 |
| Total weight (kips) | 84.97 | 133.05 | 178.50 | 197.14 | 200 |
| Steel weight (kips) | 12.97 | 25.07 | 34.50 | 41.14 | 42 |
| Concrete weight (kips) | 72.00 | 107.97 | 144.00 | 156.00 | 158 |
| Top flange width (in.) | 14 | 14 | 12 | 12 | |
| Web height (in.) | 28 | 49 | 52 | 57 | |
| Bottom flange width (in.) | 12 | 12 | 14 | 12 | |
| Top flange thickness (in.) | 0.75 | 0.75 | 0.75 | 0.75 | |
| Web thickness (in.) | 0.4375 | 0.4375 | 0.4375 | 0.5 | |
| Bottom flange thickness (in.) | 0.75 | 0.75 | 0.75 | 0.75 | |
| (a) fc' = 5 ksi (a1) 8in deck - light weight concrete | ||||||
|---|---|---|---|---|---|---|
| Span length (ft) | 60 | 90 | 120 | 140 | 150 | 146 |
| Total weight (kips) | 73.07 | 113.62 | 158.59 | 189.54 | 206.15 | 200 |
| Steel weight (kips) | 13.07 | 23.62 | 38.59 | 49.54 | 56.15 | 54 |
| Concrete weight (kips) | 60.00 | 90.00 | 120.00 | 140.00 | 150.00 | 146 |
| Top flange width (in.) | 12 | 12 | 12 | 12 | 12 | |
| Web height (in.) | 32 | 47 | 54 | 68 | 68 | |
| Bottom flange width (in.) | 12 | 12 | 13 | 12 | 16 | |
| Top flange thickness (in.) | 0.75 | 0.75 | 0.75 | 0.75 | 0.75 | |
| Web thickness (in.) | 0.4375 | 0.4375 | 0.4375 | 0.5 | 0.5 | |
| Bottom flange thickness (in.) | 0.75 | 0.75 | 1.125 | 0.75 | 0.75 | |
Note: For longer spans, the steel girder weight is heavier than in the normal weight concrete case. This is because for LWC, the elastic modulus is only 76% of that of NWC. These results on the deflection limit controlling design instead of strength limit.
| (a2) 6in deck - light weight concrete | |||||||
|---|---|---|---|---|---|---|---|
| Span (ft) | 60 | 90 | 120 | 150 | 160 | 170 | 167 |
| Total weight (kip) | 58.60 | 92.19 | 131.65 | 174.00 | 189.96 | 205 | 200 |
| Steel weight (kip) | 13.60 | 24.69 | 41.65 | 61.50 | 69.96 | 77.66 | 75 |
| Concrete weight (kip) | 45.00 | 67.50 | 90.00 | 112.50 | 120.00 | 127.50 | 125 |
| Top flange width (in) | 12 | 12 | 12 | 12 | 12 | 12 | |
| Web height (in) | 35 | 51 | 63 | 71 | 78 | 82 | |
| Bottom flange width (in) | 12 | 12 | 14 | 18 | 13 | 16 | |
| Top flange thickness (in) | 0.75 | 0.75 | 0.75 | 0.75 | 0.75 | 0.75 | |
| Web thickness (in) | 0.4375 | 0.4375 | 0.5 | 0.5 | 0.5625 | 0.5625 | |
| Bottom flange thickness (in) | 0.75 | 0.75 | 0.75 | 0.875 | 0.875 | 0.75 | |
| (b) fc' = 15 ksi (b1) 8in slab - light weight concrete | |||||
|---|---|---|---|---|---|
| Span Length (ft) | 60 | 90 | 120 | 140 | 148.46 |
| Total weight (kips) | 72.53 | 112.55 | 155.22 | 186.69 | 200 |
| Steel weight (kips) | 12.53 | 22.55 | 35.22 | 46.69 | 51.54 |
| Concrete weight (kips) | 60.00 | 90.00 | 120.00 | 140.00 | 148.46 |
| Top flange width (in.) | 12 | 12 | 12 | 12 | |
| Web height (in.) | 29 | 43 | 54 | 62 | |
| Bottom flange width (in.) | 12 | 12 | 14 | 12 | |
| Top flange thickness (in.) | 0.75 | 0.75 | 0.75 | 0.75 | |
| Web thickness (in.) | 0.4375 | 0.4375 | 0.4375 | 0.5 | |
| Bottom flange thickness (in.) | 0.75 | 0.75 | 0.75 | 0.75 | |
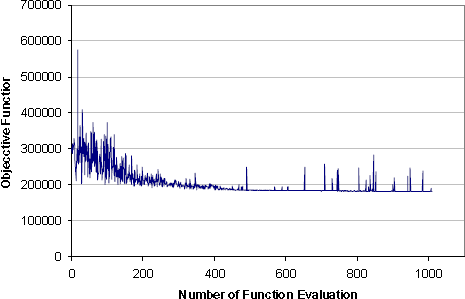
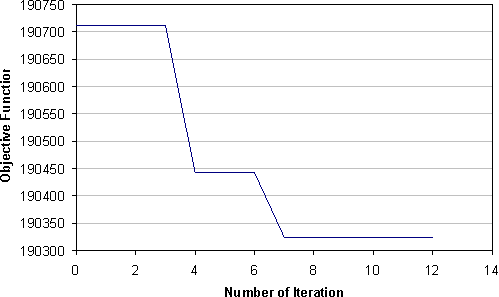
To give an idea of the effort required to derive the results presented in Tables 6.2 to 6.5, it was deemed useful to present, in Figure 6.1, the optimization process used for 120 ft long span bridge for the case of precast NWC and NSC, to derive the values given in column No. 4 of Table 6.4.(a1). Fig 6.1a shows that after 1000 function evaluations, the optimal design search by GA has converged to certain sub-optimal regions. Further search in these regions by SBO (Fig 6.1b) results on only minor improvements. This demonstrates that the best design achieved in GA search is close to the real optimum. Since in the optimization process it is assumed that the design variables are continuous, the optimization result has to be adjusted locally to meet the steel dimensional constraints (e.g. the flange width and the web depth have to be multiples of 1.0 inch, etc.). The adjusted optimal design is listed in Table 6.4(a1) for 120 ft span. Output files for every other function evaluation and related to the GA and the SBO optimizations are presented in Appendix A and B, respectively.
In the following sections cost analysis is performed in order to compare the different options. Generally, the cost of construction varies from region to region and the cost model used in the following analysis is only intended to provide general idea on the optimum solution. For this analysis, the cost of the structural steel and the concrete are based on the 2005 average bridge construction cost in the state of Florida. The cost analyses included in the following discussions are based on the following price list (2005): structural Steel (installed) = $1.37 per pound; NWC and LWC (in place) = $300 per cu. yd; HSC (in place) = $380 per cu. yd. The cost of NWC and LWC used in the analysis is lower than the published average cost of $515 since no forming or shoring will be required. The NWC and LWC cost used is in line with the cost of concrete for approach slabs.
- GA Optimization
- SBO Optimization
Fig. 6.1 Optimization of 120 ft Span Girder with 8in Precast NWC, fc'= 5 ksi
6.2.1 Effect of Slab Thickness
Precast NWC Modular Bridge System
Performance Analysis
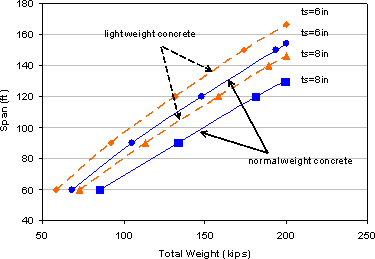
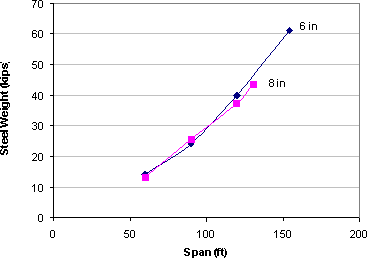
From Table 6.4, it is seen that by reducing the slab thickness from 8 inches to 6 inches, the maximum length achieved for the 200 kips weight limit is increased from 130 ft to approximately 153 ft, i.e., 17.70 % increase. The same trend is observed for other span lengths, as illustrated in Fig. 6.1a. It is observed that the steel weight required increases as the span length increase; however, the rate of that increase is seen to be greater for 6 inch slab than for 8 inch slab (Fig. 6.2b). The reduced stiffness of the system with the 6 in. deck slab results in excessive deflections under applied life loads which requires larger steel section to limit the deflection below AASHTO LRFD design requirements.
Cost Analysis
As for the effect of slab thickness on cost, an example for a span of 120 feet shows that as the slab thickness was reduced from 8 inches to 6 inches, the steel weight increased by 2.66 kips (7.12%), i.e., a cost increase due to steel of $3,644. In parallel, concrete weight decreased by approximately 36 kips (25%), i.e., a cost decrease due to concrete of $2,700. This would then result in a net increase of $944 for one bridge system.
Precast LWC
Performance Analysis
Similarly, from Table 6.5, it is seen that by reducing the slab thickness from 8 inches to 6 inches, the maximum length achieved for 200 kips total weight is increased from approximately 146 ft to approximately 166 ft, i.e., by13.70 %. The same trend is observed for other span lengths, as illustrated in Fig. 6.2a.
Cost Analysis
For a span length of 120 feet, as the slab thickness was reduced from 8 inches to 6 inches, the steel weight increased by 3.06 kips (7.93%), i.e., a cost increase due to steel of $4,193 while the concrete weight decreased by approximately 27 kips (17.02%), i.e., a cost decrease due to concrete of $2,025. This would then result in a net increase of $2,168 for the 12 ft wide bridge unit. According to this analysis the LWC is seen to be less advantageous than the NWC from the point of view of cost, however, if longer spans are required LWC provide an optimum option to meet this demand. In addition, other considerations are to be considered in the design as presented below.
- Span vs. Total Weight
- Steel Weight vs. Span for NWC
Fig. 6.2 Effect of Slab Thickness (6in vs. 8in.) - Precast, fc'=5 ksi
Other Considerations
It must be borne in mind that given the span, the lighter the bridge, the more likely it will show vibration, fatigue and hence durability problems in the long term. Therefore, despite the apparent gain in overall cost of the 6 inch slab deck, it is prone to more vibration problems than the 8 inch slab deck. In addition to affecting the riding comfort, excessive cracking of the concrete deck due to the vibration can also result in durability problems in the long term. Therefore, such a solution, even though optimal from the cost point of view, needs to be further researched to include considerations such as vibrations, fatigue and durability, particularly for LWC.
6.2.2 Effect of Concrete Strength
Performance Analysis
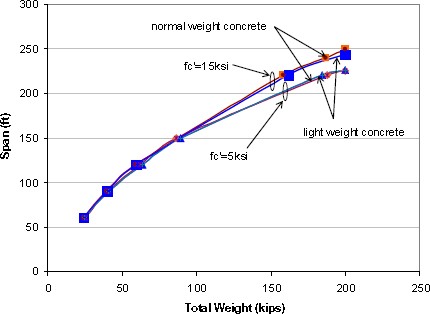
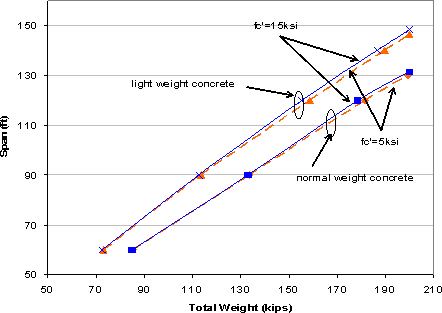
For precast NWC, Table 6.4, comparison of (a1) corresponding to 5 ksi with (b1) corresponding to 15 ksi NWC reveals that the gain in length achieved by the use of high strength concrete (HSC) is negligible. This holds true for all the span ranges considered as clearly illustrated in Fig. 6.3b. Also, given the span length, the weight of concrete and that of steel did not change as concrete strength was enhanced from 5 ksi to 15 ksi (see table 6.4). It can be concluded that for precast NWC concrete, the use of HSC results in no gain in length.
The above observation is not the case for CIP normal weight concrete (Table 6.2), where the gain in length, for a given total weight of 200 kips, is approximately 24 feet, i.e., 10% increase, as the concrete strength was increased from 5 to 15 ksi. Similar gain in length is observed for CIP lightweight concrete (Table 6.3). However, examination of the curves displayed in Fig. 6.2a reveals that the use of HSC provides no gain in performance below a span length of approximately 160 feet. In other words, for CIP concrete modular bridges below 160 feet span, it is clearly advantageous to use NSC. In addition, for span lengths greater than 160 feet the use of HSC is more economical (see Fig. 6.3a).
Cost Analysis
Given the cost of HSC ($380/yard) compared to NSC ($300/yard), the additional cost for one 120 ft long bridge unit, due to the use of HSC instead of NSC, would amount to approximately $11,520 for precast NWC. It can be concluded that given the span length, for precast NWC concrete, the use of HSC translates into a more costly bridge, compared to NSC.
However, for CIP concrete, the use of HSC can be an economically viable option, but only for spans greater than 160 feet (see Fig. 6.3a). This holds true for both NWC (Table 6.2) and LWC (Table 6.3). The additional cost for one 120 ft long bridge unit (one 12 ft. wide unit), due to the use of HSC instead of NSC, would amount to approximately $3,680 for 6 inch CIP NWC and $3,805 for 6 inch LWC. Whether the 10% maximum gain in span length warrants the added cost due to the use of HSC remains to be answered.
- Cast In Place
- Precast
Fig. 6.3 Effect of Concrete Strength
6.2.3 Effect of Type of Concrete
Performance Analysis
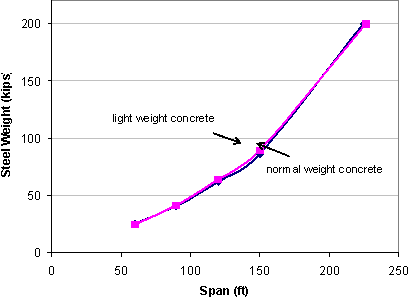
Comparing Table 6.2 with Table 6.3 reveals that the gain in length due to the use of LWC in CIP normal strength concrete bridge is marginal (less than 1%). This holds true for the entire span range considered in the analysis as clearly indicated in Fig. 6.3a. This is attributed to the fact that for longer spans, the steel girder weight is heavier than in the NWC case. This is because for LWC, the elastic modulus is only 76% of that of NWC, resulting thereby in the deflection limit controlling design instead of strength limit, therefore, stiffer steel girders. It should be pointed out that the mass reduction due to the LWC could result in excessive vibration which is known to speed the deterioration of the bridge deck.
For Precast NSC, comparison of Table 6.4 with Table 6.5, for a total weight of 200 kips, the use of LWC results in a gain in bridge length of 16 feet (i.e., 12.30%) for 8 inch slab and 13 feet (i.e., 8.4%) for 6 inch slab. This is holds true for the whole range of the span length as clearly illustrated in Fig. 6.2a, where the curves are seen to be quasi-parallel.
Cost Analysis
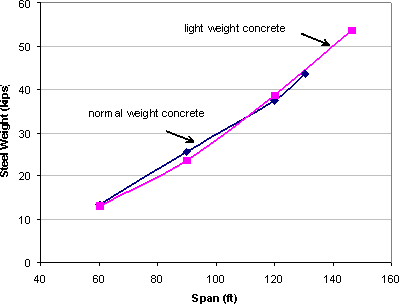
As clearly illustrated in Fig. 6.4, the effect of concrete type (NWC versus LWC) is marginal, and this is true for the whole range of the span length. Therefore, one should expect no major cost difference between the two alternatives, as will be demonstrated below for a 120 ft span bridge.
For the precast option, the use of LWC (instead of NWC) for a 120 ft span bridge and 8 inch slab for instance, results in a steel weight increase of 1.23 kips (3.29%), i.e., a cost increase due to steel of $1,685; but a concrete weight decrease by approximately 24 kips (16.67%), i.e., a cost decrease due to concrete of $1,800. This would then result in a net decrease of $115 for one bridge system (one 12 ft. unit), which is negligible.
For the same numbers but a 6 inch (instead of 8 inch) slab, the steel weight increase is 1.63 kips (4.07%), i.e., a cost increase due to steel of $2,233; but a concrete weight decrease by approximately 18 kips (16.67%), i.e., a cost decrease due to concrete of $1,350. This would then result in a net increase of $883 for one bridge system.
- Precast
- Cast In Place
Fig. 6.4 Effect of Concrete Type on Steel Weight
