

Comprehensive Design Example for Prestressed Concrete (PSC) Girder Superstructure Bridge
Design Step 7 Design of Substructure
Design Step 7.2 - Intermediate Pier Design
Design Step 7.2.1 - Substructure loads and load application
In the following sections, the word "pier" is used to refer to the intermediate pier or intermediate bent.
Dead load
Notice that the LRFD specifications include a maximum and minimum load factor for dead load. The intent is to apply the maximum or the minimum load factors to all dead loads on the structure. It is not required to apply maximum load factors to some dead loads and minimum load factors simultaneously to other dead loads to obtain the absolute maximum load effects.
Live load transmitted from the superstructure to the substructure
Accurately determining live load effects on intermediate piers always represented an interesting problem. The live load case of loading producing the maximum girder reactions on the substructure varies from one girder to another and, therefore, the case of loading that maximizes live load effects at any section of the substructure also varies from one section to another. The equations used to determine the girder live load distribution produce the maximum possible live load distributed to a girder without consideration to the live load distributed concurrently to the surrounding girders. This is adequate for girder design but is not sufficient for substructure design. Determining the concurrent girder reactions requires a three-dimensional modeling of the structure. For typical structures, this will be cumbersome and the return, in terms of more accurate results, is not justifiable. In the past, different jurisdictions opted to incorporate some simplifications in the application of live loads to the substructure and these procedures, which are independent of the design specifications, are still applicable under the AASHTO-LRFD design specifications. The goal of these simplifications is to allow the substructure to be analyzed as a two-dimensional frame. One common procedure is as follows:
- Live load reaction on the intermediate pier from one traffic lane is determined. This reaction from the live load uniform load is distributed over a 10 ft. width and the reaction from the truck is applied as two concentrated loads 6 ft. apart. This means that the live load reaction at the pier location from each traffic lane is a line load 10 ft. wide and two concentrated loads 6 ft. apart. The loads are assumed to fit within a 12 ft. wide traffic lane. The reactions from the uniform load and the truck may be moved within the width of the traffic lane, however, neither of the two truck axle loads may be placed closer than 2 ft. from the edge of the traffic lane.
- The live load reaction is applied to the deck at the pier location. The load is distributed to the girders assuming the deck acts as a series of simple spans supported on the girders. The girder reactions are then applied to the pier. In all cases, the appropriate multiple presence factor is applied.
- First, one lane is loaded. The reaction from that lane is moved across the width of the bridge. To maximize the loads, the location of the 12 ft. wide traffic lane is assumed to move across the full width of the bridge between gutter lines. Moving the traffic lane location in this manner provides for the possibility of widening the bridge in the future and/or eliminating or narrowing the shoulders to add additional traffic lanes. For each load location, the girder reactions transmitted to the pier are calculated and the pier itself is analyzed.
- Second, two traffic lanes are loaded. Each of the two lanes is moved across the width of the bridge to maximize the load effects on the pier. All possible combinations of the traffic lane locations should be included.
- The calculations are repeated for three lanes loaded, four lanes loaded and so forth depending on the width of the bridge.
- The maximum and minimum load effects, i.e. moment, shear, torsion and axial force, at each section from all load cases are determined as well as the other concurrent load effects, e.g. maximum moment and concurrent shear and axial loads. When a design provision involves the combined effect of more than one load effect, e.g. moment and axial load, the maximum and minimum values of each load effect and the concurrent values of the other load effects are considered as separate load cases. This results in a large number of load cases to be checked. Alternatively, a more conservative procedure that results in a smaller number of load cases may be used. In this procedure, the envelopes of the load effects are determined. For all members except for the columns and footings, the maximum values of all load effects are applied simultaneously. For columns and footings, two cases are checked, the case of maximum axial load and minimum moment and the case of maximum moment and minimum axial load.
This procedure is best suited for computer programs. For hand calculations, this procedure would be cumbersome. In lieu of this lengthy process, a simplified procedure used satisfactorily in the past may be utilized.
Load combinations
The live load effects are combined with other loads to determine the maximum factored loads for all applicable limit states. For loads other than live, when maximum and minimum load factors are specified, each of these two factored loads should be considered as separate cases of loading. Each section is subsequently designed for the controlling limit state.
Temperature and shrinkage forces
The effects of the change in superstructure length due to temperature changes and, in some cases, due to concrete shrinkage, are typically considered in the design of the substructure.
In addition to the change in superstructure length, the substructure member lengths also change due to temperature change and concrete shrinkage. The policy of including the effects of the substructure length change on the substructure forces varies from one jurisdiction to another. These effects on the pier cap are typically small and may be ignored without measurable effect on the design of the cap. However, the effect of the change in the pier cap length may produce a significant force in the columns of multiple column bents. This force is dependant on:
- The length and stiffness of the columns: higher forces are developed in short, stiff columns
- The distance from the column to the point of equilibrium of the pier (the point that does not move laterally when the pier is subjected to a uniform temperature change): Higher column forces develop as the point of interest moves farther away from the point of equilibrium. The point of equilibrium for a particular pier varies depending on the relative stiffness of the columns. For a symmetric pier, the point of equilibrium lies on the axis of symmetry. The column forces due to the pier cap length changes are higher for the outer columns of multi-column bents. These forces increase with the increase in the width of the bridge.
Torsion
Another force effect that some computer design programs use in pier design is the torsion in the pier cap. This torsion is applied to the pier cap as a concentrated torque at the girder locations. The magnitude of the torque at each girder location is calculated differently depending on the source of the torque.
- Torque due to horizontal loads acting on the superstructure parallel to the bridge longitudinal axis: The magnitude is often taken equal to the horizontal load on the bearing under the limit state being considered multiplied by the distance from the point of load application to mid-height of the pier cap, e.g. braking forces are assumed to be applied 6 ft. above the deck surface.
- Torque due to noncomposite dead load on simple spans made continuous for live load: Torque at each girder location is taken equal to the difference between the product of the noncomposite dead load reaction and the distance to the mid-width of the cap for the two bearings under the girder line being considered.
According to SC5.8.2.1, if the factored torsional moment is less than one-quarter of the factored pure torsional cracking moment, it will cause only a very small reduction in shear capacity or flexural capacity and, hence, can be neglected. For pier caps, the magnitude of the torsional moments is typically small relative to the torsional cracking moments and, therefore, is typically ignored in hand calculations.
For the purpose of this example, a computer program that calculates the maximum and minimum of each load effect and the other concurrent load effects was used. Load effects due to substructure temperature expansion/contraction and concrete shrinkage were not included in the design. The results are listed in Appendix C. Selected values representing the controlling case of loading are used in the sample calculations.
Superstructure dead load
These loads can be obtained from Section 5.2 of the superstructure portion of this design example.
Summary of the unfactored loading applied vertically at each bearing (12 bearings total, 2 per girder line):
| Girders (E/I) | = 61.6 k |
| Deck slab and haunch (E) | = 55.1 k |
| Deck slab and haunch (I) | = 62.2 k |
| Intermediate diaphragm (E) | = 1.3 k |
| Intermediate diaphragm (I) | = 2.5 k |
| Parapets (E/I) | = 14.8 k |
| Future wearing surface (E) | = 13.4 k |
| Future wearing surface (I) | = 19.9 k |
(E) - exterior girder
(I) - interior girder
Substructure dead load
Figure 7.2-1 - General Pier Dimensions
Pier cap unfactored dead load
wcap = (cap cross-sectional area)(unit weight of concrete)
Varying cross-section at the pier cap ends:
| wcap1 | = varies linearly from 2(2)(0.150) = 0.6 k/ft to 4(4)(0.150) = 2.4 k/ft |
Constant cross-section:
| wcap2 | = 4(4)(0.150) = 2.4 k/ft |
OR
| Pcap | = 2.4(45.75) + [(2 + 4)/2](0.150)(13.167) = 115.7 k |
Single column unfactored dead load
| wcolumn | = (column cross sectional area)(unit weight of concrete) = π(1.75)2(0.150) = 1.44 k/ft |
OR
| Pcolumn | = 1.44(18) = 25.9 k |
Single footing unfactored dead load
| wfooting | = (footing cross sectional area)(unit weight of concrete) = 12(12)(0.150) = 21.6 k/ft |
OR
| Pfooting | = 21.6(3) = 64.8 k |
Live load from the superstructure
Use the output from the girder live load analysis to obtain the maximum unfactored live load reactions for the interior and exterior girder lines.
Summary of HL-93 live load reactions, without distribution factors or impact, applied vertically to each bearing (truck pair + lane load case governs for the reaction at the pier, therefore, the 90% reduction factor from S3.6.1.3.1 is applied):
| Maximum truck | = 59.5 k |
| Minimum truck | = 0.0 k |
| Maximum lane | = 43.98 k |
| Minimum lane | = 0.0 k |
Braking force (BR) (S3.6.4)
According to the specifications, the braking force shall be taken as the greater of:
25 percent of the axle weight of the design truck or design tandem
OR
5 percent of the design truck plus lane load or 5 percent of the design tandem plus lane load
The braking force is placed in all design lanes which are considered to be loaded in accordance with S3.6.1.1.1 and which are carrying traffic headed in the same direction. These forces are assumed to act horizontally at a distance of 6 ft. above the roadway surface in either longitudinal direction to cause extreme force effects. Assume the example bridge can be a one-way traffic bridge in the future. The multiple presence factors in S3.6.1.1.2 apply.
| BR1 | = 0.25(32 + 32 + 8)(4 lanes)(0.65)/1 fixed support = 46.8 k |
OR
| BR2A | = 0.05[72 + (110 + 110)(0.64)] = 10.6 k |
| BR2B | = 0.05[(25 + 25) + 220(0.64)] = 9.54 k |
where the subscripts are defined as:
1 - use the design truck to maximize the braking force
2A - check the design truck + lane
2B - check the design tandem + lane
Therefore, the braking force will be taken as 46.8 k (3.9 k per bearing or 7.8 k per girder) applied 6 ft. above the top of the roadway surface.
| Moment arm | = 6 ft. + deck thickness + haunch + girder depth = 6 + 0.667 + 0.333 + 6 = 13.0 ft. above the top of the bent cap |
Apply the moment 2(3.9)(13.0) = 101.4 k-ft at each girder location.
Wind load on superstructure (S3.8.1.2)
The pressures specified in the specifications are assumed to be caused by a base wind velocity, VB., of 100 mph.
Wind load is assumed to be uniformly distributed on the area exposed to the wind. The exposed area is the sum of all component surface areas, as seen in elevation, taken perpendicular to the assumed wind direction. This direction is varied to determine the extreme force effects in the structure or in its components. Areas that do not contribute to the extreme force effect under consideration may be neglected in the analysis.
Base design wind velocity varies significantly due to local conditions. For small or low structures, such as this example, wind usually does not govern.
Pressures on windward and leeward sides are to be taken simultaneously in the assumed direction of wind.
The direction of the wind is assumed to be horizontal, unless otherwise specified in S3.8.3. The design wind pressure, in KSF, may be determined as:
| PD | = PB(VDZ/VB)2 (S3.8.1.2.1-1) = PB(VDZ2/10,000) |
where: PB = base wind pressure specified in Table S3.8.1.2.1-1 (ksf) |
Since the bridge component heights are less than 30 ft. above the ground line, VB is taken to be 100 mph.
Wind load transverse to the superstructure
| FT Super | = pwT(Hwind)[(Lback + Lahead)/2] | |||||||||||||||
where:
|
||||||||||||||||
| FT Super |
|
Wind load along axes of superstructure (longitudinal direction)
The longitudinal wind pressure loading induces forces acting parallel to the longitudinal axis of the bridge.
| FL Super | = pwL(Hwind)(Lback +Lahead)/nfixed piers | |||||||||||||||
where:
| ||||||||||||||||
| FL Super |
|
The transverse and longitudinal pressures should be applied simultaneously.
Resultant wind load along axes of pier
The transverse and longitudinal superstructure wind forces, which are aligned relative to the superstructure axis, are resolved into components that are aligned relative to the pier axes.
Load perpendicular to the plane of the pier:
FL Pier = FL Super cos(θskew) + FT Super sin(θskew)
At 0 degrees:
| FL Pier | = 0 cos 20 + 57.8 sin 20 = 19.8 k |
At 60 degrees:
| FL Pier | = 43.9 cos 20 + 19.6 sin 20 = 48.0 k |
Load in the plane of the pier (parallel to the line connecting the columns):
FT Pier = FL Super sin(θskew) + FT Super cos(θskew)
At 0 degrees:
| FT Pier | = 0 sin 20 + 57.8 cos 20 = 54.3 k |
At 60 degrees:
| FT Pier | = 43.9 sin 20 + 19.6 cos 20 = 33.4 k |
The superstructure wind load acts at 10.5/2 = 5.25 ft. from the top of the pier cap.
The longitudinal and transverse forces applied to each bearing are found by dividing the forces above by the number of girders. If the support bearing line has expansion bearings, the FL Super component in the above equations is zero.
Wind load on substructure (S3.8.1.2.3)
The transverse and longitudinal forces to be applied directly to the substructure are calculated from an assumed base wind pressure of 0.040 ksf (S3.8.1.2.3). For wind directions taken skewed to the substructure, this force is resolved into components perpendicular to the end and front elevations of the substructures. The component perpendicular to the end elevation acts on the exposed substructure area as seen in end elevation, and the component perpendicular to the front elevation acts on the exposed areas and is applied simultaneously with the wind loads from the superstructure.
Wwind on sub = Wcap + Wcolumn
Transverse wind on the pier cap (wind applied perpendicular to the longitudinal axis of the superstructure):
| Wcap | = 0.04(cap width) = 0.04(4) = 0.16 k/ft of cap height |
Longitudinal wind on the pier cap (wind applied parallel to the longitudinal axis of the superstructure):
| Wcap | = 0.04(cap length along the skew) = 0.04(58.93) = 2.36 k/ft of cap height |
Transverse wind on the end column, this force is resisted equally by all columns:
| WT, column | = 0.04(column diameter)/ncolumns = 0.04(3.5)/4 = 0.035 k/ft of column height above ground |
Longitudinal wind on the columns, this force is resisted by each of the columns individually:
| WL, column | = 0.04(column diameter) = 0.04(3.5) = 0.14 k/ft of column height above ground |
There is no wind on the footings since they are assumed to be below ground level.
Total wind load on substructure:
| WT wind on sub | = 0.16 + 0.035 = 0.20 k/ft |
| WL wind on sub | = 2.36 + 0.14 = 2.50 k/ft |
Wind on live load (S3.8.1.3)
When vehicles are present, the design wind pressure is applied to both the structure and vehicles. Wind pressure on vehicles is represented by an interruptible, moving force of 0.10 klf acting normal to, and 6.0 ft. above, the roadway and is transmitted to the structure.
When wind on vehicles is not taken as normal to the structure, the components of normal and parallel force applied to the live load may be taken as follows with the skew angle taken as referenced normal to the surface.
Use Table S3.8.1.3-1 to obtain FW values,
| FT Super | = FWT(Lback + Lahead)/2 |
|||||||||||||||
| FT Super |
| |||||||||||||||
| FL Super | = FWL(Lback + Lahead)/nfixed piers |
|||||||||||||||
| FL Super |
| |||||||||||||||
| FW LL | = 11 k (transverse direction, i.e., perpendicular to longitudinal axis of the superstructure) |
Temperature force (S3.12.2)
Due to the symmetry of the bridge superstructure, no force is developed at the intermediate bent due to temperature expansion/shrinkage of the superstructure.
Shrinkage (S3.12.4)
Due to the symmetry of the bridge superstructure, no force is developed at the intermediate bent due to shrinkage of the superstructure.
Load combinations
Figures 7.2-2 and 7.2-3 show the unfactored loads applied to the bent from the superstructure and wind.
Figure 7.2-2 - Super- and Substructure Applied Dead Loads
Figure 7.2-3 - Wind and Braking Loads on Super- and Substructure
Design Step 7.2.2 - Pier cap design
Required information:
General (these values are valid for the entire pier cap):
f′c = 3.0 ksi
β1 = 0.85
fy = 60 ksi
Cap width = 4 ft.
Cap depth = 4 ft. (varies at ends)
No. stirrup legs = 6
Stirrup diameter = 0.625 in. (#5 bars)
Stirrup area = 0.31 in2 (per leg)
Stirrup spacing = varies along cap length
Side cover = 2 in. (Table S5.12.3-1)
Cap bottom flexural bars:
No. bars in bottom row, positive region = 9 (#8 bars)
Positive region bar diameter = 1.0 in.
Positive region bar area, As = 0.79 in2
Bottom cover = 2 in. (Table S5.12.3-1)
Cap top flexural bars:
No. bars in top row, negative region = 14 (7 sets of 2 #9 bars bundled horizontally)
Negative region bar diameter = 1.128 in.
Negative region bar area, As = 1.0 in2
Top cover = 2 in. (Table S5.12.3-1)
From the analysis of the different applicable limit states, the maximum load effects on the cap were obtained. These load effects are listed in Table 7.2-1. The maximum factored positive moment occurs at 44.65 ft. from the cap end under Strength I limit state.
| Location* | Unfactored Responses | Str-I | ||||
|---|---|---|---|---|---|---|
| DC | DW | LL + IM | BR | |||
| Max Pos M (k-ft) | 44.65 ft. | 147.5 | 37.1 | 437.9 | 5.2 | 1,015.5 |
| Max Neg M (k-ft) | 6.79 ft. | -878.5 | -84.9 | -589.0 | -1.9 | -2,259.4 |
| Max Shear (k) | 34.96 ft. | 292.9 | 39.5 | 210.4 | 2.8 | 798.3 |
* measured from the end of the cap
Notes:
DC: superstructure dead load (girders, slab and haunch, diaphragms, and parapets) plus the substructure dead load (all components)
DW: dead load due to the future wearing surface
LL + IM: live load + impact transferred from the superstructure
BR: braking load transferred from the superstructure
Str-I: load responses factored using Strength I limit state load factors
Design Step 7.2.2.1 - Pier cap flexural resistance (S5.7.3.2)
The factored flexural resistance, Mr, is taken as:
| Mr | = φMn (S5.7.3.2.1-1) | ||||
where: |
|||||
|
|||||
For calculation of Mn, use the provisions of S5.7.3.2.3 which state, for rectangular sections subjected to flexure about one axis, where approximate stress distribution specified in S5.7.2.2 is used and where the compression flange depth is not less than "c" as determined in accordance with Eq. S5.7.3.1.1-3, the flexural resistance Mn may be determined by using Eq. S5.7.3.1.1-1 through S5.7.3.2.2-1, in which case "bw" is taken as "b".
Rectangular section behavior is used to design the pier cap. The compression reinforcement is neglected in the calculation of the flexural resistance.
Design Step 7.2.2.2 - Maximum positive moment
Applied Strength I moment, Mu = 1,015.5 k-ft
Applied Service I moment, Ms = 653.3 k-ft (from computer software)
Axial load on the pier cap is small, therefore, the effects of axial load is neglected in this example.
Check positive moment resistance (bottom steel)
Calculate the nominal flexural resistance according to S5.7.3.2.3.
Mn = Asfy(δs-a/2) (S5.7.3.2.2-1)
Determine δs, the corresponding effective depth from the extreme fiber to the centroid of the tensile force in the tensile reinforcement.
| δs | = cap depth-CSGb | ||
where: |
|||
| |||
| δs | = 4(12)-3.125 = 44.875 in. |
||
| As | = (nbars Tension)(As bar) = 9(0.79) = 7.1 in2 |
||
Determine "a" using Eq. S5.7.3.1.1-4
| a | = Asfy/0.85f′cb (S5.7.3.1.1-4) = 7.1(60)/[0.85(3)(48)] = 3.48 in. |
Calculate the nominal flexural resistance, Mn
| Mn | = Asfy(δs-a/2) (S5.7.3.2.2-1) = 7.1(60)[44.875-(3.48/2)]/12 = 1,531 k-ft |
Therefore, the factored flexural resistance, Mr, can be calculated as follows:
| Mr | = 0.9(1,531) = 1,378 k-ft > Mu = 1015.5 k-ft OK |
Limits for reinforcement (S5.7.3.3)
Check if the section is over-reinforced.
The maximum amount of nonprestressed reinforcement shall be such that:
| c/de | ≤ 0.42 (S5.7.3.3.1-1) | ||||
where: |
|||||
| |||||
| c/de | = 4.1/44.875 = 0.091 < 0.42 OK |
||||
Check the minimum reinforcement requirements (S5.7.3.3.2)
Unless otherwise specified, at any section of a flexural component, the amount of nonprestressed tensile reinforcement must be adequate to develop a factored flexural resistance, Mr, at least equal to the lesser of:
| 1.2Mcr | = 1.2frS | ||||
where: |
|||||
|
|||||
| 1.2Mcr | = 1.2(0.42)(18,432)/12 = 774.1 k-ft |
||||
OR
| 1.33Mu | = 1.33(1,015.5) = 1,351 k-ft |
Minimum required section resistance = 774.1 k-ft
Provided section resistance = 1,378 k-ft > 774.1 k-ft OK
Check the flexural reinforcement distribution (S5.7.3.4)
Check allowable stress, fs
| fs, allow | = Z/[(dcA)1/3] ≤ 0.6fy (S5.7.3.4-1) | ||||||||||
where: |
|||||||||||
|
|||||||||||
| fs, allow | = Z/[(dcA)1/3] = 170/[(2.5)(26.7)]1/3 = 41.9 ksi > 0.6(60) = 36 ksi therefore, fs, allow fs, allow = 36 ksi |
||||||||||
Check service load applied steel stress, fs, actual
For 3.0 ksi concrete, the modular ratio, n = 9 (see S6.10.3.1.1b or calculate by dividing the steel modulus of elasticity by the concrete and rounding up as required by S5.7.1)
Assume the stresses and strains vary linearly.
From the load analysis of the bent:
Dead load + live load positive service load moment = 653.3 k-ft
The transformed moment of inertia is calculated assuming elastic behavior, i.e., linear stress and strain distribution. In this case, the first moment of area of the transformed steel on the tension side about the neutral axis is assumed equal to that of the concrete in compression.
Assume the neutral axis at a distance "y" from the compression face of the section.
The section width equals 48 in.
Transformed steel area = (total steel bar area)(modular ratio) = 7.1(9) = 63.9 in2
By equating the first moment of area of the transformed steel about that of the concrete, both about the neutral axis:
63.9(44.875-y) = 48y(y/2)
Solving the equation results in y = 9.68 in.
| Itransformed | = Ats(δs-y)2 + by3/3 = 63.9(44.875-9.68)2 + 48(9.68)3/3 = 93,665 in4 |
Stress in the steel, fs, actual = (Msc/I)n, where M is the moment action on the section.
| fs,actual | = [653.3(12)(35.195)/93,665]9 = 26.5 ksi < fs, allow = 36 ksi OK |
Figure 7.2-4-Crack Control for Positive Reinforcement Under Service Load
Design Step 7.2.2.3 - Maximum negative moment
From the bent analysis, the maximum factored negative moment occurs at 6.79 ft. from the cap edge under Strength I limit state:
Applied Strength I moment, Mu = -2,259.4 k-ft
Applied Service I moment, Ms = -1,572.4 k-ft (from computer analysis)
Check negative moment resistance (top steel)
Calculate Mn using Eq. S5.7.3.2.2-1.
Determine δs, the corresponding effective depth from the extreme fiber to the centroid of the tensile force in the tensile reinforcement. The compressive reinforcement is neglected in the calculation of the nominal flexural resistance.
| δs | = cap depth-CGSt | ||
where: |
|||
|
|||
| δs | = 4(12)-3.189 = 44.81 in. |
||
| As | = (nbars Tension)(As bar) = 14(1.0) = 14.0 in2 |
||
Determine "a" using Eq. S5.7.3.1.1-4
| a | = Asfy/0.85f′cb (S5.7.3.1.1-4) = 14.0(60)/[(0.85(3)(4)(12)] = 6.86 in. |
Calculate the nominal flexural resistance, Mn
| Mn | = 14.0(60)[44.81-(6.86/2)]/12 = 2,897 k-ft |
Therefore, the factored flexural resistance, Mr:
| Mr | = 0.9(2,897) = 2,607 k-ft > Mu = |-2,259.4| k-ft OK |
Limits for reinforcement (S5.7.3.3)
Check if the section is over-reinforced.
The maximum amount of nonprestressed reinforcement shall be such that:
| c/de | ≤ 0.42 (S5.7.3.3.1-1) | ||||
where: |
|||||
|
|||||
| c/de | = 8.07/44.81 = 0.18 < 0.42 OK |
||||
Check minimum reinforcement (S5.7.3.3.2)
Unless otherwise specified, at any section of a flexural component, the amount of nonprestressed tensile reinforcement shall be adequate to develop a factored flexural resistance, Mr, at least equal to the lesser of:
| 1.2Mcr | = 1.2frS | ||||
where: |
|||||
|
|||||
| 1.2Mcr | = 1.2(0.42)(18,432)/12 = 774.1 k-ft |
||||
OR
| 1.33Mu | = 1.33(-2,259.4) = |-3,005| k-ft |
Minimum required section resistance = 774.1 k-ft
Provided section resistance = 2,607 k-ft > 774.1 k-ft OK
Check the flexural reinforcement distribution (S5.7.3.4)
Check the allowable stress, fs
| fs, allow | = Z/[(dcA)1/3] ≤ 0.6fy (S5.7.3.4-1) | ||||||
where: |
|||||||
|
|||||||
| fs, allow | = Z/[(dcA)1/3] = 170/[2.56(17.6)]1/3 = 47.8 ksi > 0.6(60) = 36 ksi OK, therefore, use fs,allow = 36 ksi |
||||||
Check the service load applied steel stress, fs, actual
For 3.0 ksi concrete, the modular ratio, n = 9
Assume the stresses and strains vary linearly.
From the load analysis of the bent:
Dead load + live load negative service load moment = -1,572.4 k-ft
The transformed moment of inertia is calculated assuming elastic behavior, i.e., linear stress and strain distribution. In this case, the first moment of area of the transformed steel on the tension side about the neutral axis is assumed equal to that of the concrete in compression.
Assume the neutral axis at a distance "y" from the compression face of the section.
Section width = 48 in.
Transformed steel area = (total steel bar area)(modular ratio) = 14.0(9) = 126 in2
By equating the first moment of area of the transformed steel about that of the concrete, both about the neutral axis:
126(44.81-y) = 48y(y/2)
Solving the equation results in y = 12.9 in.
| Itransformed | = Ats(δs-y)2 + by3/3 = 126(44.81-12.9)2 + 48(12.9)3/3 = 162,646 in4 |
Stress in the steel, fs, actual = (Msc/I)n, where M is the moment action on the section.
| fs,actual | = [|-1,572.4|(12)(31.91)/162,646]9 = 33.3 ksi < fs, allow = 36 ksi OK |
Figure 7.2-5- Crack Control for Negative Reinforcement Under Service Load
Design Step 7.2.2.4 - Check minimum temperature and shrinkage steel (S5.10.8)
Reinforcement for shrinkage and temperature stresses is provided near the surfaces of the concrete exposed to daily temperature changes and in structural mass concrete. Temperature and shrinkage reinforcement is added to ensure that the total reinforcement on exposed surfaces is not less than that specified below.
Using the provisions of S5.10.8.2,
| As, min1 | = 0.11Ag/fy (S5.10.8.2-1) | ||
where: |
|||
|
|||
| As, min1 | = 0.11(2,304)/60 = 4.2 in2 |
||
This area is to be divided between the two faces, i.e., 2.1 in2 per face. Shrinkage and temperature reinforcement must not be spaced farther apart than 3.0 times the component thickness or 18.0 in.
Use 4 #7 bars per face.
| As provided | = 4(0.6) = 2.4 in2 > 2.1 in2 OK |
Design Step 7.2.2.5 - Skin reinforcement (S5.7.3.4)
If the effective depth, de, of the reinforced concrete member exceeds 3 ft., longitudinal skin reinforcement is uniformly distributed along both side faces of the component for a distance of d/2 nearest the flexural tension reinforcement. The area of skin reinforcement (in2/ft of height) on each side of the face is required to satisfy:
| Ask | ≥ 0.012(de-30) ≤ (As + Aps)/4 (S5.7.3.4-4) | ||||
where: |
|||||
|
|||||
| Ask | = 0.012(44.875-30) = 0.179 in2/ft ≤ 14.0/4 = 3.5 in2/ft |
||||
Required Ask per face = 0.179(4) = 0.72 in2 < 2.4 in2 provided OK
Figure 7.2-6 - Cap Cross-Section
Design Step 7.2.2.6 - Maximum shear
From analysis of the bent, the maximum factored shear occurs at 34.96 ft. from the cap end under Strength I limit state:
Shear, Vu = 798.3 k
Calculate the nominal shear resistance using S5.8.3.3.
The factored shear resistance, Vr
| Vr | = φVn (S5.8.2.1-2) | ||||
where: |
|||||
|
|||||
The nominal shear resistance, Vn, shall be determined as the lesser of:
| Vn | = Vc + Vs + Vp (S5.8.3.3-1) |
OR
| Vn | = 0.25f′cbvdv + Vp (S5.8.3.3-2) | ||||||||||||||
where: |
|||||||||||||||
| |||||||||||||||
Therefore, use dv = 41.4 in. for Vc calculation.
|
|||||||||||||||||||||||||
Therefore, Vn is the lesser of:
Vn = 217.5 + 660.0 + 0 = 877.5 k
OR
Vn = 0.25(3)(48)(41.4) + 0 = 1,490.4 k
Use Vn = 877.5 k
Therefore,
| Vr | = φVn = 0.9(877.5) = 789.8 k > Vu = 798.3 k OK |
Check the minimum transverse reinforcement (S5.8.2.5)
A minimum amount of transverse reinforcement is required to restrain the growth of diagonal cracking and to increase the ductility of the section. A larger amount of transverse reinforcement is required to control cracking as the concrete strength is increased.
Where transverse reinforcement is required, as specified in S5.8.2.4, the area of steel must satisfy:
| Av | = |
||
where: |
|||
|
|||
| Av | = = 0.307 in2 < 1.86 in2 provided OK |
||
Check the maximum spacing of the transverse reinforcement (S5.8.2.7)
The spacing of the transverse reinforcement must not exceed the maximum permitted spacing, smax, determined as:
If vu < 0.125f′c, then
smax = 0.8dv ≤ 24.0 in. (S5.8.2.7-1)If vu ≥ 0.125f′c, then:
smax = 0.4dv ≤ 12.0 in. (S5.8.2.7-2)
The shear stress on the concrete, vu, is taken to be:
| vu | = Vu/(φbvdv) = 798.3/[0.9(48)(41.4)] = 0.446 ksi > 0.125(3) = 0.375 ksi |
Therefore, use Eq. S5.8.2.7-2
| smax | = 0.4(41.4) = 16.6 in. smax cannot exceed 12 in., therefore, use 12 in. as maximum |
| sactual | = 7 in. < 12 in. OK |
Figure 7.2-7-Stirrup Distribution in the Bent Cap
Design Step 7.2.3 - Column design
Required information:
General:
| f′c | = 3.0 ksi |
| Ec | = 3,321 ksi (S5.4.2.4) |
| n | = 9 |
| fy | = 60 ksi |
Circular Columns:
Column diameter = 3.5 ft.
Column area, Ag = 9.62 ft2
Side cover = 2 in. (Table S5.12.3-1)
Vertical reinforcing bar diameter (#8) = 1.0 in.
Steel area = 0.79 in2
Number of bars = 16
Total area of longitudinal reinforcement = 12.64 in2
Type of transverse reinforcement = ties
Tie spacing = 12 in.
Transverse reinforcement bar diameter (#3) = 0.375 in. (S5.10.6.3)
Transverse reinforcement area = 0.11 in2/bar
The example bridge is in Seismic Zone 1, therefore, a seismic investigation is not necessary for the column design. Article S5.10.11 provides provisions for seismic design where applicable.
Applied moments and shears
The maximum biaxial responses occur on column 1 at 0.0 ft. from the bottom (top face of footing).
From the load analysis of the bent, the maximum load effects at the critical location were obtained and are listed in Table 7.2-2.
| Load effect maximized | Limit State | Mt (k-ft) |
Ml (k-ft) |
Pu (k) |
Mu (k-ft) |
|---|---|---|---|---|---|
| Positive Mt | Strength V | 342 | 352 | 1,062 | 491 |
| Negative Mt | Strength V | -129 | -216 | 682 | 252 |
| Positive Ml | Strength V | 174 | 822 | 1,070 | 840 |
| Negative Ml | Strength V | 116 | -824 | 1,076 | 832 |
| Axial Load P | Strength I | 90 | -316 | 1,293 | 329 |
where:
Mt: Factored moment about the transverse axis
Ml: Factored moment about the longitudinal axis
Pu: Factored axial load
Sample hand calculations are presented for the case of maximum positive Ml from Table 7.2-2.
Maximum shear occurs on column 1 at 0.0 ft. from the bottom (top face of footing)
Factored shears-strength limit state:
Vt = 44.8 k (Str-V)
Vl = 26.0 k (Str-V)
Check limits for reinforcement in compression members (S5.7.4.2)
The maximum area of nonprestressed longitudinal reinforcement for non-composite compression components shall be such that:
| As/Ag | ≤ 0.08 (S5.7.4.2-1) | ||||
where: |
|||||
|
|||||
| 12.64/[9.62(144)] | = 0.009 < 0.08 OK | ||||
The minimum area of nonprestressed longitudinal reinforcement for noncomposite compression components shall be such that:
| Asfy/Agf′c | ≥ 0.135 (S5.7.4.2-3) = 12.64(60)/[9.62(144)(3)] = 0.182 > 0.135 OK |
Therefore, the column satisfies the minimum steel area criteria, do not use a reduced effective section. For oversized columns, the required minimum longitudinal reinforcement may be reduced by assuming the column area is in accordance with S5.7.4.2.
Strength reduction factor, φ, to be applied to the nominal axial resistance (S5.5.4.2)
For compression members with flexure, the value of φ may be increased linearly from axial (0.75) to the value for flexure (0.9) as the factored axial load resistance, φPn, decreases from 0.10f′cAg to zero. The resistance factor is incorporated in the interaction diagram of the column shown graphically in Figure 7.2-8 and in tabulated form in Table 7.2-3.
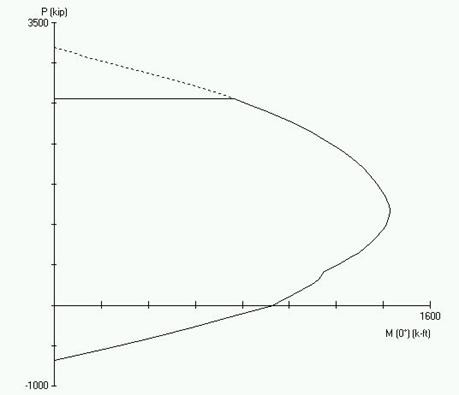
Figure 7.2-8-Column Interaction Diagram
| P (k) | M (k-ft) |
|---|---|
| Pmax = 2,555 | 764 |
| 2,396 | 907 |
| 2,236 | 1,031 |
| 2,076 | 1,135 |
| 1,917 | 1,222 |
| 1,757 | 1,291 |
| 1,597 | 1,348 |
| 1,437 | 1,389 |
| 1,278 | 1,419 |
| 1,118 | 1,424 |
| 958 | 1,404 |
| 799 | 1,354 |
| 639 | 1,289 |
| 479 | 1,192 |
| 319 | 1,124 |
| 160 | 1,037 |
| 0 | 928 |
| -137 | 766 |
| -273 | 594 |
| -410 | 410 |
| -546 | 212 |
| -683 | 0 |
Design Step 7.2.3.1 - Slenderness effects
The effective length factor, K, is taken from S4.6.2.5. The slenderness moment magnification factors are typically determined in accordance with S4.5.3.2.2. Provisions specific to the slenderness of concrete columns are listed in S5.7.4.3.
Typically, the columns are assumed unbraced in the plane of the bent with the effective length factor, K, taken as 1.2 to account for the high rigidity of the footing and the pier cap. In the direction perpendicular to the bent K may be determined as follows:
- If the movement of the cap is not restrained in the direction perpendicular to the bent, the column is considered not braced and the column is assumed to behave as a free cantilever. K is taken equal to 2.1 (see Table SC4.6.2.5-1)
- If the movement of the cap is restrained in the direction perpendicular to the bent, the column is considered braced in this direction and K is taken equal to 0.8 (see Table SC4.6.2.5-1)
For the example, the integral abutments provide restraint to the movements of the bent in the longitudinal direction of the bridge (approximately perpendicular to the bent). However, this restraint is usually ignored and the columns are considered unbraced in this direction, i.e. K = 2.1.
The slenderness ratio is calculated as Klu/r
where:
| K | = effective length factor taken as 1.2 in the plane of the bent and 2.1 in the direction perpendicular to the bent |
| lu | = unbraced length calculated in accordance with S5.7.4.3 (ft.) = distance from the top of the footing to the bottom of the cap = 18 ft. |
| r | = radius of gyration (ft.) = ¼ the diameter of circular columns = 0.875 ft. |
For a column to be considered slender, Klu/r should exceed 22 for unbraced columns and, for braced columns, should exceed 34-12(M1/M2) where M1 and M2 are the smaller and larger end moments, respectively. The term (M1/M2) is positive for single curvature flexure (S5.7.4.3)
Slenderness ratio in the plane of the bent
| Klu/r | = 1.2(18)/(0.875) = 24.7 > 22 therefore, the column is slightly slender |
Slenderness ratio out of the plane of the bent
| Klu/r | = 2.1(18)/(0.875) = 43.2 > 22 therefore, the column is slender |
With the column slender in both directions, effect of slenderness needs to be considered.
Moment magnification in the bent
Longitudinal direction:
| Mcl | = δbM2b + δsM2s (S4.5.3.2.2b-1)
where: |
||||||||||||||||
|
Calculate Pe,
| Pe | = π2EI/(Klu)2 (S4.5.3.2.2b-5)
where:
AND
As a simplification, steel reinforcement in the column is ignored in calculating EI, therefore, neglect Eq. S5.7.4.3-1.
|
Therefore, the moment magnification factors δb and δs can be calculated.
| δb | = 1.0/[1 - (1,070/[0.75(8,490)])] = 1.20 |
| δs | = 1/[1 - ΣPu/jΣPe]
ΣPu and ΣPe are the sum of the applied factored loads and the sum of the buckling loads of all columns in the bent, respectively. For hand calculations, it is not feasible to do calculations involving several columns simultaneously. Therefore, in this example, Pu and Pe of the column being designed are used instead of ΣPu and ΣPe. = 1.20 |
Therefore, the magnified moment in the longitudinal direction is taken as:
| Mcl | = δbM2b + δsM2s = 1.20(M2b + M2s) = 1.20(total factored moment, Ml) = 1.20(822) = 986.4 k-ft (S4.5.3.2.2b-1) |
Transverse direction:
| Mct | = δbM2b + δsM2s (S4.5.3.2.2b-1) |
Calculate Pe,
| Pe | = π2EI/(Klu)2 (S4.5.3.2.2b-5)
where:
AND
For simplification, steel reinforcement in the column is ignored in calculating EI, therefore, neglect Eq. S5.7.4.3-1.
|
||||||||||||||||||
| Pe | = π2(1.56 x 10⁸)/[1.2(216)]2 = 22,917 k |
Therefore, the moment magnification factors δb and δs can be calculated.
| δb | = 1.0/[1 - (1,070/[0.75(23,064)])] = 1.07 |
| δs | = 1/[1 -ΣPu/φΣPe] Similar to longitudinal, use Pu and Pe instead of ΣPu and ΣPe. = 1.07 |
Therefore, the magnified moment in the transverse direction is taken as:
| Mct | = 1.07(total factored moment, Mt) = 1.07(174) = 186 k-ft |
The combined moment Mu is taken as:
| Mu | = 1004 k-ft |
Factored axial load on the column for the load case being checked = 1,070 k
By inspection, from the column interaction diagram Figure 7.2-8 or Table 7.2-3, the applied factored loads (M = 1,004 k-ft and P = 1,070 k) are within the column resistance.
Design Step 7.2.3.2 - Transverse reinforcement for compression members (S5.10.6)
Transverse reinforcement for compression members may consist of either spirals or ties. Ties are used in this example. In tied compression members, all longitudinal bars are enclosed by lateral ties. Since the longitudinal bars are #8, use #3 bars for the ties (S5.10.6.3).
The spacing of ties is limited to the least dimension of the compression member or 12.0 in., therefore, the ties are spaced at 12.0 in. center-to-center.
Ties are located vertically no more than half a tie spacing above the footing and not more than half a tie spacing below the lowest horizontal reinforcement in the cap.
Figure 7.2-9 shows the column cross-section.
Figure 7.2-9 - Column Cross-Section
Design Step 7.2.4 - Footing design
Based on the intermediate bent load analysis, the critical footing is Footing 1 supporting Column 1
Required information:
General:
f′c = 3.0 ksi
fy = 60 ksi
Side concrete cover = 3 in. (Table S5.12.3-1)
Top concrete cover = 3 in.
Bottom concrete cover = 3 in.
Top bars (T)ransverse or (L)ongitudinal in bottom mat = L
Direction of bottom bars in bottom mat = T
A preliminary analysis of the footing yielded the following information:
Footing depth = 3.0 ft.
Footing width, W = 12.0 ft.
Footing length, L = 12.0 ft.
Top mat reinforcing bar diameter, #5 bars = 0.625 in.
Top mat reinforcing bar area, #5 bars = 0.31 in2
Bottom mat reinforcing bar diameter, #9 bars = 1.128 in.
Bottom mat reinforcing bar area, #9 bars = 1.0 in2
Number of bars = 13 bars in each direction in both the top and bottom mats
Location of critical sections
According to S5.13.3.6.1, the critical section for one-way shear is at a distance dv, the shear depth calculated in accordance with S5.8.2.9, from the face of the column. For two-way shear, the critical section is at a distance of dv/2 from the face of the column.
For moment, the critical section is taken at the face of the column in accordance with S5.13.3.4.
For the circular column in this example, the face of the column is assumed to be located at the face of an equivalent square area concentric with the circular column in accordance with S5.13.3.4.
Determine the critical faces along the y-axis for moment
Since the column has a circular cross-section, the column may be transformed into an effective square cross-section for the footing analysis.
Critical face in y-direction = ½ footing width, W - ½ equivalent column width
Equivalent column width = square root of the shaft area = square root of 9.62 = 3.10 ft.
Critical face in y-direction = ½ footing width, W - ½ equivalent column width = ½ (12) - ½ (3.10) = 4.45 ft.
Critical faces in the y-direction = 4.45 ft. and 7.55 ft.
Determine the critical faces along the x-axis for moment
For a square footing with an equivalent square column:
Critical face in the x-direction = Critical face in the y-direction = 4.45 ft.
Critical faces in the x-direction = 4.45 ft. and 7.55 ft.
See Figure 7.2-10 for a schematic showing the critical sections for moments.
Figure 7.2-10 - Critical Sections for Moment
Design factored loads at the critical section
From the analysis of the intermediate bent computer program, the cases of loading that produced maximum load effects and the other concurrent load effects on the footing are shown in Table 7.2-4.
Table 7.2-4 - Loads on Critical Footing (Footing Supporting Column 1)
| Load effect maximized | Limit State | Mt (k-ft) |
Ml (k-ft) |
Pu (k) |
|---|---|---|---|---|
| Positive Mt | Strength V | 423 | 377 | 1,143 |
| Negative Mt | Strength III | -154 | -197 | 628 |
| Positive Ml | Strength V | 232 | 895 | 1,151 |
| Negative Ml | Strength V | 158 | -897 | 1,157 |
| Axial Load P | Strength I | 121 | -363 | 1,374 |
Each row in Table 7.2-4 represents the maximum value of one load effect (max. +Mt,-Ml, etc.). The corresponding concurrent load effects are also given. Many engineers design the footing for the above listed cases. However, computer design programs are able to check many more cases of loading to determine the most critical case. For example, a load case that does not produce maximum axial load or maximum moment may still produce the maximum combined effects on the footing. From the output of a footing design program, the critical case for the footing design was found to produce the following factored footing loads under Strength I limit state:
| Pu | = 1,374 k |
| Mt | = -121 k-ft |
| Ml | = 626 k-ft |
The critical Service I loads:
| Pu | = 891 k |
| Mt,s | = 176 k-ft |
| Ml,s | = 620 k-ft |
For the sample calculations below, the factored loads listed above for the critical case of loading were used.
Sample calculations for the critical footing under the critical case of loading
If M/P < L/6 then the soil under the entire area of the footing is completely in compression and the soil stress may be determined using the conventional stress formula (i.e. s = P/A ± Mc/I).
Mt/Pu = 121/1,374
= 0.088 < 12/6 = 2 OKMl/Pu = 626/1,374
= 0.456 < 2 OK
Therefore, the soil area under the footing is under compression.
Moment
For Mux (k-ft/ft), where Mux is the maximum factored moment per unit width of the footing due to the combined forces at a longitudinal face, see Figure 7.2-10:
| σ1, σ2 | = P/LW ± Ml(L/2)/(L3W/12)
where:
| ||||||||||||
| σ1 | = 1,374/[12(12)] + 626(12/2)/[123(12)/12] = 9.54 + 2.17 = 11.71 ksf |
||||||||||||
| σ2 | = 9.54 - 2.17 = 7.37 ksf |
Interpolate to calculate σ3, the stress at critical location for moment (at face of column, 4.45 ft. from the end of the footing along the width.
| σ3 | = 10.10 ksf |
Therefore,
| Mux | = σ3L1(L1/2) + 0.5(σ1 - σ3)(L1)(2L1/3)
where:
|
||
| Mux | = 10.10(4.45)(4.45/2) + 0.5(11.71 - 10.10)(4.45)[2(4.45)/3] = 100.0 + 10.63 = 110.6 k-ft/ft |
For Muy (k-ft/ft), where Muy is the maximum factored moment per unit length from the combined forces at a transverse face acting at 4.45 ft. from the face of the column (see Figure 7.2-10):
| σ5, σ6 | = P/LW ± Mt(W/2)/(W3L/12)
where:
|
||
| σ5 | = 1,374/[12(12)] - (-121)(12/2)/[123(12)/12] = 9.54 - (-0.420) = 9.96 ksf |
||
| σ6 | = 9.54 + (-0.420) = 9.12 ksf |
Interpolate to calculate σ7, the stress at critical location for moment (at face of column, 4.45 ft. from the end of the footing along the length).
| σ7 | = 9.65 ksf |
Therefore,
| Muy | = σ7L3(L3/2) + 0.5(σ5 - σ7)(L3)(2L3/3) = 9.65(4.45)(4.45/2) + 0.5(9.96 - 9.65)(4.45)[2(4.45)/3] = 95.54 + 2.05 = 97.6 k-ft/ft |
Factored applied design moment, Service I limit state, calculated using the same method as above:
| Mux,s | = 75.9 k-ft/ft |
| Muy,s | = 72.0 k-ft/ft |
Where Mux,s is the maximum service moment from combined forces at a longitudinal face at 4.45 ft. along the width and Muy,s is the maximum service moment from combined forces at a transverse face at 7.55 ft. along the length.
Shear
Factored applied design shear.
For Vux (k/ft), where Vux is the shear per unit length at a longitudinal face:
| Vux | = σ4L2 + 0.5(σ1 - σ4)L2
where:
|
Based on the preliminary analysis of the footing, dv is estimated as 30.3 in. Generally, for load calculations, dv may be assumed equal to the effective depth of the reinforcement minus 1 inch. Small differences between dv assumed here for load calculations and the final dv will not result in significant difference in the final results.
The critical face along the y-axis = 4.45 - 30.3/12 = 1.925 ft. from the edge of the footing
By interpolation between σ1 and σ2, σ4 = 11.01 ksf
| Vux | = 11.01(1.925) + 0.5(11.71 - 11.01)(1.925) = 21.19 + 0.67 = 21.9 k/ft |
For Vuy (k/ft), where Vuy is the shear per unit length at a transverse face:
| Vux | = σ8L4 + 0.5(σ5 - σ8)L4
where:
|
The critical face along the x-axis = 4.45 - 31.4/12 = 1.833 ft. from the edge of the footing
By interpolation between σ5 and σ6, σ8 = 9.83 ksf
| Vux | = 9.83(1.83) + 0.5(9.96 - 9.83)(1.83) = 17.99 + 0.12 = 18.1 k/ft |
Figure 7.2-11 - Stress at Critical Locations for Moment and Shear
Design Step 7.2.4.1 Flexural resistance (S5.7.3.2)
Check the design moment strength (S5.7.3.2)
Article S5.13.3.5 allows the reinforcement in square footings to be uniformly distributed across the entire width of the footing.
Check the moment resistance for moment at the critical longitudinal face (S5.13.3.4)
The critical section is at the face of the effective square column (4.45 ft. from the edge of the footing along the width). In the case of columns that are not rectangular, the critical section is taken at the side of the concentric rectangle of equivalent area as in this example.
| Mrx | = φMnx (S5.7.3.2.1-1)
where:
|
Determine dsx, the distance from the top bars of the bottom reinforcing mat to the compression surface.
| dsx | = footing depth - bottom cvr - bottom bar dia. - ½ top bar dia. in bottom mat = 3(12) - 3 - 1.128 - ½ (1.128) = 31.3 in. |
Figure 7.2-12 - Footing Reinforcement Locations
Determine As per foot of length. The maximum bar spacing across the width of the footing is assumed to be 12.0 in. in each direction on all faces (S5.10.8.2). Use 13 #9 bars and determine the actual spacing.
| Actual bar spacing | = [L - 2(side cover) - bar diameter]/(nbars - 1) = [12 - 2(3)/12 - 1.128/12]/(13 - 1) = 11.41 in. |
| As | = 1.0(12/11.41) = 1.05 in2 |
Determine "a", the depth of the equivalent stress block.
| a | = Asfy/0.85f¢cb (S5.7.3.1.1-4) |
| for a strip 12 in. wide, b = 12 in. and As = 1.05 in2 |
|
| a | = 1.05(60)/[0.85(3)(12)]= 2.06 in. |
Calculate φMnx, the factored flexural resistance.
| Mrx | = φMnx = 0.9[1.05(60)(31.3 - 2.06/2)]/12 (S5.7.3.2.2-1) = 143.0 k-ft/ft > applied factored moment, Mux = 110.6 k-ft/ft OK |
Check minimum temperature and shrinkage steel (S5.10.8)
According to S5.10.8.1, reinforcement for shrinkage and temperature stresses shall be provided near surfaces of concrete exposed to daily temperature changes and in structural mass concrete. Footings are not exposed to daily temperature changes and, therefore, are not checked for temperature and shrinkage reinforcement. Nominal reinforcement is provided at the top of the footing to arrest possible cracking during the concrete early age before the footing is covered with fill.
Design Step 7.2.4.2 - Limits for reinforcement (S5.7.3.3)
Check maximum reinforcement (S5.7.3.3.1)
| c/de | ≤ 0.42 (S5.7.3.3.1-1)
where:
|
||
| c/de | = 2.42/31.3 = 0.077 < 0.42 OK |
Minimum reinforcement check (S5.7.3.3.2)
Unless otherwise specified, at any section of a flexural component, the amount of nonprestressed tensile reinforcement shall be adequate to develop a factored flexural resistance, Mr, at least equal to the lesser of:
| 1.2Mcr | = 1.2frS
where:
|
||
For a 1 ft. wide strip, 3 ft. thick,
|
|||
| 1.2Mcr | = 1.2(0.42)(2,592)/12 = 108.9 k-ft/ft |
||
| OR |
|||
| 1.33Mux | = 1.33(110.6) = 147.1 k-ft/ft |
||
Therefore, the minimum required section moment resistance = 108.9 k-ft/ft
Provided moment resistance = 143.0 k-ft/ft > 108.9 k-ft/ft OK
Check the moment resistance for moment at the critical transverse face
The critical face is at the equivalent length of the shaft (7.55 ft. from the edge of the footing along the length). In the case of columns that are not rectangular, the critical section is taken at the side of the concentric rectangle of equivalent area.
| Mry | = φMny = φ[Asfy(dsy-a/2)] (S5.7.3.2.2-1) |
Determine dsy, the distance from the bottom bars of the bottom reinforcing mat to the compression surface.
| dsy | = footing depth-cover-½ (bottom bar diameter)
= 3(12)-3-½ (1.128) = 32.4 in. |
Determine As per foot of length
| Actual bar spacing | = [W-2(side cover)-bar diameter]/(nbars-1) = [12-2(3)/12-1.128/12]/(13-1) = 11.41 in. |
| As | = 1.0(12/11.41) = 1.05 in2 |
Determine "a", depth of the equivalent stress block.
| a | = Asfy/(0.85f′cb) |
| For a strip 12 in. wide, b = 12 in. and As = 1.05 in2 | |
| a | = 1.05(60)/[0.85(3)(12)] = 2.06 in. |
Calculate φMny, the factored flexural resistance
| Mry | = φMny = 0.9[1.05(60)(32.4-2.06/2)]/12 = 148.2 k-ft/ft > Muy = 97.6 k-ft/ft OK |
Check maximum reinforcement (S5.7.3.3.1)
| c/de | ≤ 0.42 (S5.7.3.3.1-1)
where:
|
||
| c/de | = 2.42/32.4 = 0.075 < 0.42 OK |
Check minimum reinforcement (S5.7.3.3.2)
Unless otherwise specified, at any section of a flexural component, the amount of nonprestressed tensile reinforcement shall be adequate to develop a factored flexural resistance, Mr, at least equal to the lesser of:
| 1.2Mcr | = 1.2frS
where:
|
||
For a 1 ft. wide strip, 3 ft. thick,
|
|||
| 1.2Mcr | = 1.2(0.42)(2,592)/12 = 108.9 k-ft/ft |
||
| OR |
|||
| 1.33Muy | = 1.33(97.6) = 129.8 k-ft/ft |
||
Therefore, the minimum required section moment resistance = 108.9 k-ft/ft
Provided moment resistance = 148.2 k-ft/ft > 108.9 k-ft/ft OK
Design Step 7.2.4.3 - Control of cracking by distribution of reinforcement (S5.7.3.4)
Check distribution about footing length, L
| fs, allow | = Z/(dcA)1/3 ≤ 0.60fy (S5.7.3.4-1)
where:
|
||||||
| fs, allow | = Z/[(dcA)1/3] = 170/[2.56(58.4)]1/3 = 32.0 ksi < 0.6(60) = 36 ksi therefore, use fs, allow = 32.0 ksi |
Check actual steel stress, fs, actual
For 3.0 ksi concrete, the modular ratio, n = 9
Maximum service load moment as shown earlier = 77.3 k-ft
The transformed moment of inertia is calculated assuming elastic behavior, i.e., linear stress and strain distribution. In this case, the first moment of area of the transformed steel on the tension side about the neutral axis is assumed equal to that of the concrete in compression.
Assume the neutral axis at a distance "y" from the compression face of the section.
Section width = bar spacing = 11.41 in.
Transformed steel area = (bar area)(modular ratio) = 1.0(9) = 9.0 in2
By equating the first moment of area of the transformed steel about that of the concrete, both about the neutral axis:
| 9.0(31.3-y) | = 11.41y(y/2) |
Solving the equation results in y = 6.28 in.
| Itransformed | = Ats(dsx-y)2 + by3/3 = 9.0(31.3-6.28)2 + 11.41(6.28)3/3 = 6,576 in4 |
Stress in the steel, fs, actual = (Msc/I)n, where Ms is the moment acting on the 11.41 in. wide section.
| fs,actual | = [77.3(11.41)(31.3-6.28)/6,576]9 = 30.2 ksi < fs, allow = 32.0 ksi OK |
Figure 7.2-13-Crack Control for Top Bar Reinforcement Under Service Load
Check distribution about footing width, W
This check is conducted similarly to the check shown above for the distribution about the footing length and the reinforcement is found to be adequate.
Design Step 7.2.4.4 - Shear analysis
Check design shear strength (S5.8.3.3)
According to S5.13.3.6.1, the most critical of the following conditions shall govern the design for shear:
One-way action, with a critical section extending in a plane across the entire width and located at a distance taken as specified in S5.8.3.2.
Two-way action, with a critical section perpendicular to the plane of the slab and located so that its perimeter, bo, is a minimum but not closer than 0.5dv to the perimeter of the concentrated load or reaction area.
The subscripts "x" and "y" in the next section refer to the shear at a longitudinal face and shear at a transverse face, respectively.
Determine the location of the critical face along the y-axis
Since the column has a circular cross-section, the column may be transformed into an effective square cross-section for the footing analysis.
As stated previously, the critical section for one-way shear is at a distance dv, the shear depth calculated in accordance with S5.8.2.9, from the face of the column and for two-way shear at a distance of dv/2 from the face of the column.
Determine the effective shear depth, dvx, for alongitudinal face.
| dvx | = effective shear depth for a longitudinal face per S5.8.2.9 (in.) = dsx-a/2 = 31.3-2.06/2 = 30.3 in. (S5.8.2.9) |
| but not less than: | |
| 0.9dsx | = 0.9(31.3) = 28.2 in. |
| 0.72h | = 0.72(36) = 25.9 in. |
Therefore, use dvx = 30.3 in.
The critical face along the y-axis = 4.45-30.3/12 = 1.925 ft. from the edge of the footing
Determine the location of the critical face along the x-axis
Determine the effective shear depth, dvy, for a transverse face.
| dvy | = effective shear depth for a transverse face per S5.8.2.9 (in.) = dsy-a/2 = 32.4-2.06/2 = 31.4 in. (S5.8.2.9) |
| but not less than: | |
| 0.9dsy | = 0.9(32.4) = 29.2 in. |
| 0.72h | = 0.72(36) = 25.9 in. |
Therefore, use dvy = 31.4 in.
The critical face along the x-axis = 4.45-31.4/12 = 1.833 ft. from the edge of the footing
See Figure 7.2-14 for locations of the critical sections.
Figure 7.2-14-Critical Sections for Shear
Determine one-way shear capacity for longitudinal face (S5.8.3.3)
For one-way action, the shear resistance of the footing of slab will satisfy the requirements specified in S5.8.3.
| Vrx | = φVnx (S5.8.2.1-2) |
The nominal shear resistance, Vnx, is taken as the lesser of:
| Vnx | = Vc + Vs + Vp (S5.8.3.3-1) | ||||||||
| OR | |||||||||
| Vnx | = 0.25f′cbvdvx + Vp (S5.8.3.3-2) | ||||||||
| Vc | where:
|
||||||||
The nominal shear resistance is then taken as the lesser of:
| Vnx | = 39.8 k/ft |
AND
| Vnx | = 0.25f′cbvdv = 0.25(3)(12)(30.3) = 272.7 k/ft |
Therefore, use Vnx = 39.8 k/ft
| Vrx | = φVnx = 0.9(39.8) = 35.8 k/ft > applied shear, = 21.9 k/ft (calculated earlier) OK |
Determine one-way shear capacity for transverse face
| Vry | = φVny (S5.8.2.1-2) |
The nominal shear resistance, Vnx, is taken as the lesser of:
| Vny | = Vc + Vs + Vp (S5.8.3.3-1) | ||||||||
| OR | |||||||||
| Vny | = 0.25f′cbvdvy + Vp (S5.8.3.3-2) | ||||||||
| Vc | where:
|
||||||||
The nominal shear resistance is then taken as the lesser of:
| Vcy | = 41.2 k/ft |
AND
| Vny | = 0.25f′cbvdv = 0.25(3)(12)(31.4) = 282.6 k/ft |
Therefore, use Vny = 41.2 k/ft
| Vry | = φVny = 0.9(41.2) = 37.1 k/ft > applied shear, Vuy = 18.1 k/ft (calculated earlier) OK |
Determine two-way (punching) shear capacity at the column (S5.13.3.6.3)
For two-way action for sections without transverse reinforcement, the nominal shear resistance, Vn in kips, of the concrete shall be taken as:
| Vn | where:
|
||||||
| Vn | = 2,316 k |
The nominal shear resistance, Vn, cannot exceed the following:
| Vn | = 1,544 k |
Therefore,
| Vr | = 0.9(1,544) = 1,390 k |
The maximum factored vertical force for punching shear calculations equals the maximum factored axial load on the footing minus the factored weight of the footing.
| P2 way | = 1,374-1.25[12(12)(3)](0.150) = 1,293 k |
The maximum shear force for punching shear calculations for a footing with the entire footing area under compression and the column at the center of the footing:
| V2 way | = P2 way(1-area within punching shear perimeter/footing area) = 1,293[1-π((42/2 + 30.9/2)/12)2 / 12(12)] = 1,293(1-0.201) = 1,033 k < Vr = 1,390 k OK |
For footings with eccentric columns or with tension under some of the footing area, the design force for punching shear is calculated as the applied load, P2way, minus the soil load in the area within the perimeter of the punching shear failure.
Design Step 7.2.4.5 Foundation soil bearing resistance at the Strength Limit State (S10.6.3)
Foundation assumptions:
Footings rest on dry cohesionless soil
Angle of internal friction of the soil (φf) = 32 degrees
Depth of the bottom of the footing from the ground surface = 6 ft.
Soil density = 120 lb/ft3
Footing plan dimensions are 12 ft. by 12 ft.
Footing effective dimensions
According to S10.6.3.1.1, where loads are eccentric, the effective footing dimensions L' and B', as specified in S10.6.3.1.5, shall be used instead of the overall dimensions L and B in all equations, tables, and figures pertaining to bearing capacity.
Therefore, for each load case shown in Table 7.2-4, a unique combination of the footing effective dimensions is used. In the following section, the case of maximum axial load on the footing will be used to illustrate the bearing capacity calculations.
The footing effective dimensions are calculated using S10.6.3.1.5 and Figure SC10.6.3.1.5-1 (shown below).
| B′ | = B-2eB (S10.6.3.1.5-1)
where:
|
||
| B′ | = 12-2(121/1,374) = 11.82 ft. |
||
| L′ | = L-2eL (S10.6.3.1.5-2)
where:
|
||
| L′ | = 12-2(626/1,374) = 11.09 ft. |
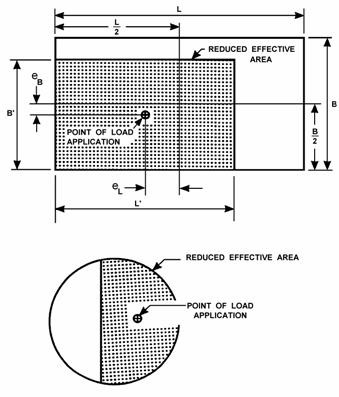
Figure SC10.6.3.1.5-1-Reduced Footing Dimensions (Reproduced from the Specifications)
According to S10.6.3.1.2c, for cohesionless soil, the nominal bearing resistance of a layer of the soil in TSF may be determined as:
| qult | = 0.5γBCw1Nγm + γCw2DfNqm (S10.6.3.1.2c-1)
where:
|
||||||
| Cw1, Cw2 | = coefficients as specified in Table S10.6.3.1.2c-1 as a function of Dw (dimensionless) = for dry soil with a large depth, Cw1 = Cw2 = 1.0
|
||||||
| Nγm, Nqm | = modified bearing capacity factor (dimensionless) |
Substituting in Eq. S10.6.3.1.2c-1:
| qult | = 0.5(0.06)(11.09)(1.0)Nγm + 0.06(1.0)(6)Nqm = 0.334Nγm + 0.36Nqm |
From Eqs. S10.6.3.1.2c-2 and -3
| Nγm | = NγSγcγiγ (S10.6.3.1.2c-2) | ||||||||||||
| Nqm | = NqSqcqiqdq (S10.6.3.1.2c-3)
where:
|
From Table S10.6.3.1.2c-2: Nγ = 30 for φf = 32 degrees
From Table S10.6.3.1.2c-2: Nq = 23 for φf = 32 degrees
| L′/B′ | = 11.82/11.09 = 1.07 |
Interpolate between L′/B′ = 1 and 2. However, using values corresponding to L′/B′ = 1.0 will not lead to significant change because L′/B′ ≈ 1.0.
From Table S10.6.3.1.2c-3: Sq = 1.62 for L′/B′ = 1.0 and φf = 30 degrees
From Table S10.6.3.1.2c-4: Sγ = 0.6 for L′/B′ = 1.0 and φf = 30 degrees
Soil stress at the footing depth before excavation, q = 0.06(6) = 0.36 TSF
For Tables S10.6.3.1.2c-5 and -6, either interpolate between q = 0.25 and q = 0.5 or, as a conservative approach, use the value corresponding to q = 0.5. For this example, the value corresponding to q = 0.5 TSF is used.
From Table S10.6.3.1.2c-5: cq, cγ = 1.0 for q = 0.5 and φf = 32 degrees
The maximum factored horizontal load on the bottom of the column from the bent analysis equals 46.0 and 26.0 kips in the transverse and longitudinal directions, respectively. In Table S10.6.3.1.2c-7, it is intended to use the unfactored horizontal and vertical loads. However, due to the small ratio of horizontal to vertical loads, using the factored loads does not affect the results.
Horizontal-to-vertical load ratio:
| H/V | = 44.8/1,374 = 0.033 in the transverse direction |
| H/V | = 26.0/1,374 = 0.019 in the longitudinal direction |
Table S10.6.3.1.2-7 lists values for iq, iγ that correspond to horizontal-to-vertical load ratios of 0.0 and 0.1. Interpolation between the two values is acceptable. A more conservative approach is to use the value corresponding to H/V = 0.1.
From Table S10.6.3.1.2c-7: iq = 0.85 for square footing with H/V = 0.1
From Table S10.6.3.1.2c-7: iγ = 0.77 for square footing with H/V = 0.1
Table S10.6.3.1.2c-9 lists values for dq that correspond to a friction angle, φf ≥ 32 degrees and for Df/B ≥ 1.0. For this example, φf = 30 degrees and Df/B = 6/11.13 = 0.54
By extrapolation from Table S10.6.3.1.2c-9, use dq = 1.05
Substituting in Eqs. S10.6.3.1.2c-2 and -3:
| Nγm | = NγSγcγiγ = 30(0.6)(1.0)(0.77) = 13.86 (S10.6.3.1.2c2) |
| Nqm | = NqSqcqiqdq = 23(1.62)(1.0)(0.85)(1.05) = 33.3 (S10.6.3.1.2c-3) |
Therefore,
| qult | = 0.333Nγm + 0.36Nqm = 0.333(13.86) + 0.36(33.3) = 16.6 TSF |
Resistance factor
From Table S10.5.5-1, several resistance factors are listed for cohesionless soil (sand). The selection of a particular resistance factor depends on the method of soil exploration used to determine the soil properties. Assuming that φ was estimated from SPT data, the resistance factor = 0.35
According to S10.6.3.1.1,
| qR | = φqn = φqult = 0.35(16.6) = 5.81 TSF |
| Footing load resistance | = (qR)(footing effective area) = 5.81(11.82)(11.09) = 762.0 Tons = 1,524 k > 1,374 k applied OK |
The soil load resistance check may be repeated using the same procedures for other load cases.