

Archived: Interstate Technical Group on Abandoned Underground Mines
An Interactive Forum
Recent National Institute for Occupational Safety and Health Research Using Ground Penetrating Radar for Detection of Mine Voids
By William D. Monaghan, Michael A. Trevits, Thomas P. Mucho
National Institute for Occupational Safety and Health
Pittsburgh Research Laboratory
Post Office Box 18070
Pittsburgh, PA 15236
and
John Wood
Target Drilling
5134 Oak Road Jefferson Hills, PA 15025
Abstract
We have tested the ability of ground penetrating radar (GPR) to resolve adjacent mine workings. The work was conducted at two National Institute for Occupational Safety and Health locations - an underground coal mine and an underground limestone mine. The objective of our work was to determine if GPR signals could be received from distant mine workings. The GPR system was calibrated on underground mine pillars of known dimensions using a variety of antennas. The system was then tested at several underground locations in an effort to detect an adjacent drift entry; and an adjacent abandoned coal mine. As a means of verification, an in-seam horizontal hole was drilled from the active coal mine to the abandoned mine to confirm the presence and location of the abandoned mine workings. Our results show that in the case of the limestone mine the maximum depth of penetration where the mine workings could be resolved was 85 ft; and in the case of the coal mine the abandoned mine workings could be resolved at a depth of 205 ft. We conclude that it may be possible to utilize GPR for initial underground mine studies followed by directional drilling to accurately delineate the extent and position of adjacent abandoned mine workings.
Introduction
On Wednesday, July 24, 2002, miners working in the Quecreek Mine, Somerset County, Pennsylvania accidentally cut into the abandoned Saxman No. 2 Mine releasing millions of gallons of water into the active workings. The eighteen miners working in the Quecreek Mine immediately began an evacuation; however nine miners eventually were unable to escape due to high water levels in the mine workings. Over the next 77 hours, the dramatic rescue of the trapped miners gripped the nation as technology and ingenuity eventually led to a successful outcome (Pittsburgh Post Gazette, 2002). It appears that the Quecreek Mine event was seemingly unique, about ten mine inundations of this type occur per year based upon a preliminary analysis of this data (MSHA, 2003). Although many more mine inundation incidents are reported, some are caused by cutting into uncharted gas and oil wells or heavy rains at surface and underground mines.
As a result of the Quecreek Mine incident, Pennsylvania Governor Mark S. Schweiker established the Governor's Commission on Abandoned Mine Voids and Mine Safety to investigate and document the hazards posed by abandoned mine voids, in particular the flooding of adjacent operating mines, and to make recommendations regarding the accurate location of voids and avoidance of other hazards associated with mining (Commonwealth of Pennsylvania, 2002).
The Commission was charged to make recommendations on:
- The best engineering practices to be used in the design and layout of modern mines adjacent to abandoned mine workings.
- The regulatory policies and permit review procedures for permitting mines adjacent to abandoned underground mine workings.
- The practices and procedures of mine operations in advance of mining to detect mine voids.
- The training of mine workers who operate mines adjacent to underground mine workings.
- The inspection and compliance of the mine operations with the approved mine plans and operating requirements.
- The rescue and response procedures which shall include policies for sharing information with families of miners affected by the accident.
One of the Commission's recommendations was to continue research, development and refinement of the various geophysical methods and techniques to enable these techniques to be applied separately or in conjunction with drilling techniques to provide more positive results pertaining to the location of and definition of mine voids (PA DEP, 2002).
The National Institute for Occupational Safety and Health (NIOSH) was created by the 1970 Occupational Safety and Health Act to ensure safe and healthful conditions for the nation's workers through research, training, and prevention of work-related illnesses and injuries. In 1996, the mining health and safety research mission of the former U.S. Bureau of Mines (USBM) was transferred to NIOSH. NIOSH has conducted various investigations into technologies that were aimed at detecting mine voids under its congressional mandate to conduct mining health and safety research, and through its history, including that of the USBM. Because of the Quecreek Mine incident, one of these technologies, ground penetrating radar (GPR), was tested to determine its ability to resolve adjacent mine workings. The work was conducted at two NIOSH locations - an underground coal mine and an underground limestone mine.
NIOSH operates underground test facilities for research aimed at improving the health and safety of those working in the mine environment. The Safety Research Coal Mine (SRCM) and Experimental Mine complex is a multi-purpose coal mine located near Pittsburgh, PA (figure 1). Here there are specialized full-scale underground test facilities with ancillary underground and surface equipment that provide for realistic testing and research for newly developed equipment, procedures, and technologies (NIOSH, 2002).
The Experimental Mine was opened in the early 1900's and the SRCM became operational in the early 1970's. The SRCM is a room-and-pillar mine layout approximately the size of a working section in a commercial coal mine (NIOSH 1998). The mine was developed in the Pittsburgh Coalbed and abandoned mines are located nearby. The mine opening averages about 14 ft wide and 6.5 ft tall (includes the Pittsburgh Coalbed and the overlying drawslate and rider coal).
The Lake Lynn Laboratory (LLL) is a highly sophisticated underground and surface laboratory located about 60 miles southeast of Pittsburgh, PA, and 10 miles northeast of Morgantown, WV, where large-scale explosion trials and mine fire research are conducted. The underground workings are sized to match those of commercial coal mines, thus making them true, full-scale test galleries. Movable bulkheads permit the setup of single-entry, triple-entry, and longwall face configurations for experiments (NIOSH 1999). LLL occupies more than 400 acres and was developed in the Greenbriar Limestone of the Mauch Chunk Formation. It is locally known as the Wymps Gap Limestone (also formally known as the "Greenbriar of Pennsylvania"). The units exposed are typically gray, hard, and massive with a few interbedded shale units (Shultz, 1999). LLL was built at an abandoned commercial limestone quarry where underground entries 49-ft wide by 33-ft high were developed when surface mining ceased in the late 1960's. Later, under the auspices of the U.S. Bureau of Mines, 7,545 ft of new underground development was constructed using 19.7-ft wide by 6.6-ft high entries (figure 2). These entries, in conjunction with the novel use of two explosion-proof bulkhead doors that can be positioned to open or close an entry, can be configured to simulate modern-day mining, including room-and-pillar and longwall mining (Triebsch and Sapko, 1990).
Objective and Approach
The objective of the study was to test the capability of GPR to detect adjacent mine openings. We approached this problem by using a variety of antennas whose frequency spectra produced pulses centered at near 80-, 100-, 200-, 300-, 400-MHz, in two geologically different materials (limestone and coal) at the facilities described above. The 100-, 200-, 300-, and 400-MHz antennas were enclosed in shielded cases. The 80MHz multiple low frequency (MLF) antenna was not enclosed and as such could pick-up stray reflections from surfaces near and around the antenna. It was decided to select pillars in mine areas where underground structures had not been built to minimize the chance of interference reflections (clutter). We also needed to determine the dielectric constant, ![]() , for each material, because
, for each material, because ![]() varies with the velocity (v) of radiowaves in these materials:
varies with the velocity (v) of radiowaves in these materials:
![]() = (c/v)2, where c = 3 x 10⁸m/sec.
= (c/v)2, where c = 3 x 10⁸m/sec.
Ground Penetrating Radar
GPR is a non-invasive geophysical method that uses reflected and backscattered electromagnetic waves to image, locate and quantitatively identify changes in electrical properties in the subsurface. Its primary feature is a very short pulse, which allows a vertical resolution ranging from centimeters to a few meters, depending on bandwidth. The first ground penetrating radar survey was performed as early as 1929 (Olhoeft, 1988; Stern, 1929, 1930). It was first applied to earth science problems during the 1940's and 1950's for ice sounding and planetary exploration (Evans, 1963; Thompson, 1979; Olhoeft, 1988). Geotechnical applications of GPR to rock and soil did not occur until the 1970's when the systems became commercially available (Ulriksen, 1980; Olhoeft, 1988). GPR has applications in archeological, construction, environmental, and geological studies where it is most often used to determine the location, lateral continuity, and depth of buried objects and geologic strata.
The system generates an electromagnetic pulse that is transmitted into the ground with an antenna that is moved along the surface, generally at a uniform speed and direction. The transmitted energy of the pulse is radiated in an elliptical conical pattern roughly 90E wide in the antenna plane and 60E wide in the perpendicular plane. Whenever there is a change in the dielectric constant of the subsurface material, a portion of the pulse energy is reflected back to the surface and is detected by the receiving antenna. This reflected pulse provides information on the attenuation characteristics (signal strength) associated with the subsurface material and the two-way travel time is recorded.
How well GPR works depends on two electrical properties of the geological materials under investigation: dielectric constant (relative dielectric permittivity) and electrical conductivity. The dielectric constant affects the velocity of propagation of the radar pulse. The dielectric constant ranges from 1 for air (fastest propagation) to 81 for water (slowest propagation). In rocks and minerals, dielectric properties are primarily a function of mineralogy, porosity, water saturation, frequency, and depending on the lithology, component geometries, and electrochemical interactions (Martinez, 2001; Knight, 1990; Knoll, 1996). Variations in each of these parameters can significantly change bulk dielectric constants (Martinez, 2001). The greater the difference in dielectric constant between two materials, the stronger the reflected pulse energy becomes. The electrical conductivity controls the depth of pulse penetration. The lower the conductivity of the material, the deeper the pulse can penetrate. Conductivity is controlled by the water, mineral, and clay content in the subsurface. The depth of penetration of the pulse also depends on the antenna frequency. Higher frequency antennas (e.g., 1200 MHz) provide high resolution, but shallow depths of penetration; conversely, lower frequency antennas (e.g., 80-MHz) have low resolution, but can detect significantly deeper targets.
SIR-2 System
The equipment used to conduct the ground penetrating radar surveys was a GSSI SIR® System 2 (SIR-2) Model No. DC-2 control unit built by Geophysical Survey Systems, Inc.1 The SIR-2 is a lightweight, portable, general-purpose radar system (figures 3-6) and is available as an intrinsically safe unit. The reflected pulse is processed by the control unit and the data are displayed on the monitor and stored on an internal hard disk. The output display can be (1) a single wiggle trace (analogous to an oscilloscope trace), (2) a waterfall plot of the wiggle traces, or (3) a multicolored line scan in which the reflected signal amplitudes are represented by various colors according to a user-selected color look-up table. The data can also be printed via an external printer.
The two-way travel time is determined by measuring the time interval between the start of the transmit pulse and start of the received reflected signal. The amplitude of the reflected signal is influenced by the size and geometry of the target, the signal attenuation characteristics of the geological materials, and the total distance that the pulse has to travel.
Calibration Testing at LLL
At the LLL site, a test pillar was selected that was located between the first and second cross-cuts of the A and B Drifts. The width of the test pillar was 38 ft and the length was 67 ft. Calibration tests were conducted at the midpoint of the pillar along its length and width. The tests included installing the antenna about 6 inches above the mine floor and pointing it towards the other end of the pillar. The GPR system was then operated in an attempt to detect the opening on the other side of the pillar. Table 1 shows the SIR-2 System set-up used for each antenna. Deep scan standard set-up parameters were used for each antenna. The values shown in the table, with the exception of the vertical high and low pass filter settings, are standard default values. Adjustments to the vertical low pass filter settings were made to eliminate high frequency noise (snow) from the data. Adjustments to vertical high pass filter settings were made to eliminate low frequency noise (tilt) from the data (GSSI, 1994).
At the onset of calibration testing, we used published dielectric constant values for limestone (range 5.5 - 8) (GSSI, 1994). We also examined the perimeter of each calibration pillar for obvious signs of geologic anomalies, and none were observed. During the tests, the dielectric constant was adjusted in the SIR-2 unit until the arrival time of the reflected signal (expressed in term of depth) approximated the dimension of the calibration pillar. As a result of the tests, a dielectric constant of 6.0 was established for the limestone at the LLL. The resulting radar records were analyzed using GSSI's Radar Data Analyzer for Windows NT (RADAN) software1. This package allows the user to operate in the Windows environment with application-specific modules. Figure 7 shows examples of the interpreted radar records and the observed anomalies for the calibration tests.
| Parameter | Setting for 100 MHz Antenna | Setting for 200 MHz Antenna | Setting for 300 MHz Antenna | Setting for 400 MHz Antenna | Setting for 80 MHz (MLF) Antenna |
|---|---|---|---|---|---|
| Data collection mode | Continuous | Continuous | Continuous | Continuous | Continuous |
| Range, ns | Varied1 | Varied2 | Varied2 | Varied3 | Varied3 |
| Samples per scan | Varied4 | 1024 | 512 | 512 | 512 |
| Resolution, bits | 16 | 16 | 16 | 8 | 16 |
| Number of gain points | 4 | 5 | 5 | 5 | 4 |
| Vertical high pass filter, MHz | Varied5 | 30 | 30 | 30 | 25 |
| Vertical low pass filter, MHz | 200 | 400 | 1000 | 800 | 200 |
| Scans per second | 16 | 32 | 32 | 32 | 32 |
| Horizontal smoothing, scans | 0 | 5 | 5 | 4 | 0 |
| Transmit rate, KHz | 64 | 64 | 64 | 64 | 32 |
| Dielectric constant | 6 | 6 | 6 | 6 | 6 |
1. Varied from 200 to 1600 ns.
2. Varied from 300 to 1300 ns.
3. Varied from 600 to 1000 ns.
4. Varied from 512 to 2048.
5. Varied from 15 to 25.
Calibration Testing at SRCM
At the SRCM, two underground sites were selected. The first site was located in dead-end cut No. 16 Room of the C-Butt entry. Here, two calibration tests were performed, parallel to the coalbed's dominant joint set (face cleat, also known as the main or master cleat) and the subdominant joint set (butt cleat, also known as the cross or board cleat) (McCullogh, 1974). In the Pittsburgh Coalbed, the face cleat is well developed, exhibiting larger more continuous fracture surfaces. The butt cleat trends approximately perpendicular to the face cleat and is much less continuous and frequently terminates against the face cleat (McCullogh, 1976).
Once the locations were selected, the tests were conducted in the same manner as the tests at the LLL. The width of the pillar where the antenna was oriented parallel to the butt cleat (station A) was 47 ft (figure 8) and the width of the pillar where the antenna was oriented parallel to the face cleat (station B) was 42 ft (figure 9). A second test site (station C) was selected where the pillar length was 76 ft (figure 10). In this case, the antenna was oriented parallel to the butt cleat direction.
Similar to the LLL site, we began the calibration study with a published value for the dielectric constant for coal (4.5) (GSSI, 1994). We also examined the perimeter of each calibration pillar for obvious signs of geologic anomalies, and none were observed. During the tests, the dielectric constant was adjusted in the SIR-2 unit until the arrival time of the reflected signal (expressed in terms of depth) approximated the dimension of the calibration pillars. The value of the dielectric constant when the antenna was placed parallel to the face cleat was determined to be 3.0 and when placed parallel to the butt cleat was 4.5. It is believed that this difference is related to the orientation of the coalbed joint system, possibly the discontinuous nature of the butt cleat and the impact on the variables described above. Table 2 shows the SIR-2 System set-up used for each antenna. Similar to the LLL calibration test, deep scan standard set-up parameters were used for each antenna. The values shown in the table, with the exception of the vertical high and low pass filter settings, are standard default values. Adjustments to the vertical low pass filter settings were made to eliminate high frequency noise (snow) from the data. Adjustments to vertical high pass filter settings were made to eliminate low frequency noise (tilt) from the data (GSSI, 1994).
| Parameter | Setting for 100 MHz Antenna | Setting for 200 MHz Antenna | Setting for 300 MHz Antenna | Setting for 400 MHz Antenna | Setting for 80 MHz (MLF) Antenna |
|---|---|---|---|---|---|
| Data collection mode | Continuous | Continuous | Continuous | Continuous | Continuous |
| Range, ns | Varied1 | Varied1 | Varied1 | Varied1 | Varied2 |
| Samples per scan | 512 | 512 | 1024 | 512 | 512 |
| Resolution, bits | 16 | 16 | 16 | 8 | 16 |
| Number of gain points | 4 | 4 | 4 | 6 | 4 |
| Vertical high pass filter, MHz | 25 | 30 | 30 | 30 | 15 |
| Vertical low pass filter, MHz | 200 | 400 | 600 | 800 | 160 |
| Scans per second | 16 | 32 | 32 | 32 | 32 |
| Horizontal smoothing, scans | 0 | 5 | 5 | 4 | 0 |
| Transmit rate, KHz | 64 | 64 | 64 | 64 | 64 |
| Dielectric constant (parallel to face cleat) | 3.0 | 3.0 | 3.0 | 3.0 | 3.0 |
| Dielectric constant (parallel to butt cleat) | 4.5 | 4.5 | 4.5 | 4.5 | 4.5 |
1. Varied from 300 to 1000 ns.
2. Varied from 300 to 1200 ns.
GPR Capability Testing - LLL
To test the capability of the GPR system at the LLL site, an area of workings known locally as the "ramp" (primary escapeway) was selected that runs subparallel to the trend of the D-Drift. The ramp area forms the transition from the old workings to the new workings of the mine. The D-Drift is 1,706 ft long, 6.9 ft high and 19.7 ft wide and it was thought that because this structure is so large that it would make a good target for testing the GPR system capabilities. A total of 11 stations leading away from the intersection of the ramp and the D-Drift were selected for antenna locations. At each station along the ramp, the antenna was elevated approximately 3 ft above the mine floor (because of the dip of the strata) and aimed toward the D-Drift. Straight-line measurements were made from the mine map perpendicular to the trend of the D-Drift to each antenna location. This measurement proved to be extremely helpful when examining the records during post-processing of the GPR data.
The results of the tests are shown in table 3. An example of an interpreted radar record showing the observed anomaly (D-Drift) is displayed in figure 11. Figure 12 shows a comparison of radar records for the 80- and 100-MHz antennas. Note that the anomaly, believed to be the abandoned mine workings, appears at about the same position in each radar record. A value of "Yes" in the table indicates that an anomaly in the record was observed at the approximate distance to the D-Drift. A value of "No" in the table indicates that no anomalies were observed at the approximate distance to the D-Drift. From the results of the tests at the LLL, it appears that deepest depth of penetration at the test site was about 85 ft.
| Location | Distance, ft | Frequency of Antenna | ||||
|---|---|---|---|---|---|---|
| 100MHz | 200MHz | 300MHz | 400MHz | 80-MHz(MLF) | ||
| A (Calibration site) | 381 | Yes | Yes | Yes | Yes | Yes |
| B (Calibration site) | 671 | Yes | Yes | Yes | Yes | Yes |
| A | 92 | Yes | Yes | Yes | Yes | Yes |
| B | 292 | Yes | Yes | Yes | No2 | Yes |
| C | 452 | Yes | Yes | Yes | Yes | Yes |
| D | 582 | Yes | Yes | Yes | Yes | Yes |
| E | 662 | Yes | Yes | Yes | Yes | Yes |
| F | 712 | Yes | Yes | No | No | Yes |
| G | 852 | Yes | No | No | No | Yes |
| H | 1282 | No | No | No | No | No |
| I | 1592 | No | No | No | No | No |
| J | 1572 | No | No | No | No | No |
| K | 1782 | No | No | No | No | No |
1. Distance to other side of pillar.
2. Distance to D-Drift.
GPR Capability Testing - SRCM
At the SRCM, the test of the GPR system took on a different form. Here, a pre-1905 abandoned mine existed adjacent to the No. 18 Room. Maps obtained from the Office of Surface Mining's Mine Map Repository indicated that the mine had been entered in June 1922, but it is not clear if mining or only surveying work was conducted in the mine at that time (Robertson, 2003). Therefore, only the relative extent of the workings could be determined. In addition, an in-seam borehole was drilled in the late 1980's from the SRCM to the northeastern part of the abandoned mine as part of an environmental research project by the USBM. Since the drilling records no longer exist, it is unknown if the borehole was accurately surveyed. Nevertheless, the information available from the mine map, indicated that the abandoned mine workings were penetrated at a depth of about 210 ft.
To test the GPR system, it was decided to select locations near the site of the borehole in the SRCM in an effort to detect the nearby abandoned mine workings. A total of five stations were selected. During each test, the antenna was elevated approximately 6 in above the mine floor and aimed toward the abandoned mine. Straight-line measurements of propagation distance were made from the mine map to the abandoned mine at each antenna location. This measurement proved again to be extremely helpful when examining the records during the post-processing work on the GPR data. The results of the tests are summarized in table 4. Examples of interpreted anomalies in the radar records are displayed in figures 13-15. Figure 16 shows a comparison of radar records for the 80- and 100-MHz antennas. Note that the anomaly, believed to be the abandoned mine workings, appears at the same position in each radar record.
Similar to the test at the LLL site, a value of "Yes" in the table indicates that an anomaly in the record was observed at the approximate location of the either the other side of the pillar (for calibration points A-C) or the abandoned mine (points D-H). A value of "No" in the table indicates that no anomalies were observed in the record at the approximate location of either the other side of the pillar (for calibration points A-C) or the abandoned mine (points D-H). From the results of the tests at the SRCM, it appears that deepest depth of penetration at the test site was about 205 ft.
| Location | Distance, ft | Frequency of Antenna | ||||
|---|---|---|---|---|---|---|
| 100-MHz | 200-MHz | 300-MHz | 400-MHz | 80-MHz(MLF) | ||
| A (Calibration site) | 471 | Yes | Yes | No | No | Yes |
| B (Calibration site) | 421 | Yes | Yes | No | No | Yes |
| C (Calibration site) | 761 | Yes | No | No | No | Yes |
| D | 2002 | Yes | No | No | No | Yes |
| E | 2052 | Yes | No | No | No | Yes |
| F | 2502 | No | No | No | No | No |
| G | 1952 | Yes | No | No | No | Yes |
| H | 2202 | No | No | No | No | No |
1. Distance to other side of the pillar.
2. Estimated distance to abandoned mine.
Directional Drilling at the SRCM
As a method of ground truthing our radar data and to confirm the location of the abandoned mine, Target Drilling of Pittsburgh, PA partnered with NIOSH to drill a confirmation horizontal borehole from the SRCM to the abandoned mine. Target Drilling has significant experience in drilling underground horizontal boreholes for coalbed methane recovery, coalbed exploration, abandoned mine verification, and water drainage (Kravits, 2002). The drilling equipment and procedures employed in this effort were same used for horizontal boreholes, which can extend over 4,000 feet. The drill rig was set-up in the No. 18 Room of the SRCM and about 6 ft from the existing borehole. The planned trajectory for the borehole was along a line that would penetrate the northernmost extent of the abandoned mine workings. This trajectory was selected because the mine map information provided by the Office of Surface Mining, the available information about the old borehole, and the interpreted GPR records all indicated that the abandoned mine was correctly located, but little information existed about the northern area of the abandoned mine.
The electrohydraulic drill rig used for this work consisted of three major components; the drill mast and controls; an electric/hydraulic power pack; and a self contained electric/hydraulic triplex water pump (figure 17). The high-pressure triplex water pump boosts water pressure to drive a downhole motor. The downhole tooling used consisted of a PCD (polycrystalline diamond) drill bit, connected to a short nonmagnetic downhole motor, a permissible survey system called Downhole Drill Monitor (DDM), and 30 feet of nonmagnetic drill collars. The downhole motor has a bent subhousing behind the bit. When drilling, the bent housing exerts a force on the sidewall of the hole causing the bit to deflect in the opposite direction. Through proper orientation of the bent housing, it is possible to steer the trajectory of the borehole.
The permissible DDM survey tool, housed inside a nonmagnetic pressure barrel and drill collar sits directly behind the downhole motor and is only ten feet behind the bit. The short distance between the bit and the survey tool improves the accuracy of bit projections, which is particularly important when drilling thin coalbeds. Nonmagnetic drill collars and downhole motors are utilized to prevent magnetic interference with the survey tool. The survey tool uses magnetometers and accelerometers to measure changes in the earth's magnetic field, and gravitational vector, respectively. Those changes are converted into positional and elevation changes in the borehole. NT-sized (2-3/4 in outside diameter by 10 ft long) drill rods with the signal wire permanently mounted inside the rod make up the balance of the drill string. The drill rods are high-strength core rods that can bend with the borehole. The approximate maximum bend per drill rod is 1.5 degrees.
The signal wire assembly Modular Electrically Connected Cable Assembly (MECCA) inside the drill rods transmits the survey data from the DDM's downhole unit to the uphole monitor and computer, where the data are processed into positional readouts. The MECCA couples automatically when two drill rods are screwed together, which means there is no lost drilling time due to signal wire connections. In this operation, Target Drilling utilized its permissible DDM MECCA to accurately establish the borehole position. Positional surveys were conducted for every 10 feet of directional drilling and provided the drill operator with real time borehole survey data including borehole azimuth, inclination and toolface alignment (figure 18). The DDM uphole monitor box then calculates borehole left/right position and elevation distance from the start of the borehole. The demonstrated accuracy of the survey is within ±1.0o, and much more accurate results have been documented. Regardless of depth in the borehole, it only takes about five seconds to collect, process and display a positional survey using the DDM. The ability to survey quickly provides increased survey frequency without sacrificing drilling time, increases directional control, and promotes high drilling productivity.
Wellhead control is of paramount importance as it prevents an uncontrolled discharge of water or gas when abandoned mine workings are encountered. In this operation a 4-inch diameter, 14-ft long collarpipe with valve assembly was grouted into the rib. Once the collarpipe grout was set and tested, the horizontal borehole was drilled. The borehole penetrated the abandoned mine working at a depth of 238 ft and was completed in about 3 hours. Figure 19 shows the side view trajectory of the borehole. Note the change in horizontal trajectory is caused by changes in the orientation of the bent sub during drilling.
Figure 20 shows the final position of the borehole relative to the abandoned mine and the SRCM. It is unknown why the borehole did not penetrate the workings at a depth of about 220 ft as measured from the mine map. Perhaps the outline of the mine as shown on the old map does not accurately reflect the extent of the mine workings in this area.
Summary and Conclusions
In this study, ground penetrating radar was tested to determine its ability to resolve adjacent mine workings. The work was conducted at two NIOSH locations - an underground coal mine and an underground limestone mine using a variety of antennas (100-, 200-, 300-, 400-MHz and an 80- MHz MLF antenna). In the case of the limestone mine, the maximum depth of penetration, where the adjacent mine workings could be resolved was 85 ft.
In the case of the coal mine, it was found that the dielectric constant for the coalbed varied depending upon whether the antenna was placed parallel to the butt cleat or face cleat direction. The value of the dielectric constant when the antenna was placed parallel to the face cleat was determined to be 3.0 and when placed parallel to the butt cleat it was
4.5. This observation is considered significant because depth determination errors could be made for anomalies found in the radar records during post-processing work. The maximum depth of penetration where the abandoned mine working could be resolved was 205 ft. This depth of penetration was achieved using both the 100-MHz and 80-MHz MLF antennas.
It appears that ground penetrating radar can be used to scan rib and face areas to determine the near proximity of abandoned mines. Large areas of the unmined coalbed can be scanned from the active mine quickly using this technology. From this work, it has been determined that significant experience must be obtained with the radar technology (including post-processing software) and the material being mined before confident interpretations can be made. It is unclear from these tests if similar results can be obtained if the abandoned mine workings are flooded. Future testing of this technology should address this issue.
At this time, directional drilling of horizontal boreholes (with downhole surveying) is undoubtedly the best technology for accurately determining the location of abandoned mines. Proper advance planning for borehole layout and accurately surveying active workings can enable a mine operator to avoid problem areas. Given the continuing problem of inaccurate abandoned mine maps, it may be possible to utilize ground penetrating radar for initial studies followed by directional drilling to accurately delineate the extent and position of adjacent abandoned mine workings.
References
Commonwealth of Pennsylvania, 2002, Governor's Commission on Abandoned Mine Voids and Mine Safety, Executive Order No. 2002-10, September 4, 2002, 3 p.
Evans, S., 1963, Radio Techniques for the Measurement of Ice Thickness: Polar Rec., v.3, p.406-410.
Geophysical Survey Systems, Inc. (GSSI), 1994, SIR System - 2 Operation Manual, Manual # MN72-140, 91 p.
Knight, R, and A. Endres, 1990, A New Concept in Modeling the Dielectric Response of Sandstones: Defining a Wetted Rock and Bulk Water System; Geophysics 55, No. 5, pp. 586-594.
Knoll, M.D., 1996, A Pertophysical Basis for Ground-Penetrating Radar and Very Early Time Electromagnetics, Electrical Properties of Sand-Clay Mixtures, PhD dissertation, University of British Columbia, 316 p.
Kravits, S.J., 2002, Proven Benefits of Target Drilling Inc.'s In-Mine Directional Drilling Technology for Abandoned Mine Verification, Abstract from the Symposium on Geotechnical Methods for Mine Mapping Verification, October 29, 2002, Charleston, West Virginia, 12 p.
Martinez, A, and Byrnes, A.P., 2001, Modeling Dielectric-Constant Values of Geologic Materials: An Aid to Ground-Penetrating Radar Data Collection and Interpretation, Current Research in Earth Sciences, Bulletin 247, Part 1.
McCulloch, C.M., M.Deul and P.W. Jeran, 1974, Cleat in Bituminous Coalbeds, US Bureau of Mines Report of Investigations No. 7910, 25 p.
McCullogh, C.M., S.W. Lambert and J.R. White, 1976, Determining Cleat Orientation of Deeper Coalbeds from Overlying Coals, US Bureau of Mines Report of Investigations No. 8116, 19 p.
Mine Safety and Health Administration, 2003, Incident Reports 1983-2002.
Olhoeft, G.R., 1988, Selected Bibliography on Ground Penetrating Radar, in Proceedings of the Symposium on the Applications of Geophysics to Engineering and Environmental Problems, March 28-31, 1988, Golden, CO, p. 462-520.
Pennsylvania Department of Environmental Protection, 2002, Report of Commission on Abandoned Mine Voids and Mine Safety, November 15, 2002, p. 46.
Pittsburgh Post Gazette, 2002, Home Page, The Quecreek Mine Rescue, Pittsburgh Post Gazette, August 6, 2002, http://www.postgazette.com/localnews/20020729mineindex9.asp.
Robertson, G.J. 2003, Personal Communication, May 6, 2003.
Rones, M., 1969, A Lithostratigraphic, Petrographic and Chemical Investigation of the Lower Middle Ordovician Carbonate Rocks in Central Pennsylvania, Pennsylvania Geological Survey Bulletin G 53, 224 p.
Shultz, C.H., 1999, The Geology of Pennsylvania, Pennsylvania Geological Survey Special Publication 1, p. 143-144.
Stern, W., 1929, Versuch einer elektrodynamischen Dickenmessung von Gletschereis: Ger. Beitr. zur Geophysik, v.23, p. 292-333.
Stern, W., 1930, Uber Grundlagen, Methodik und bisherige Ergebnisse elektrodynamischer Dickenmessung von Gletschereis: Z. Gletscherkunde, v.15, p. 24-42.
The National Institute for Occupational Safety and Health, 2002, Home Page, U.S. Department of Health and Human Services, Public Health Service, Centers for Disease Control and Prevention, National Institute for Occupational Safety and Health, http://www.cdc.gov/niosh/mining/prlfacil.html.
The National Institute for Occupational Safety and Health, 1998, The Experimental Mine and the Safety Research Coal Mine (flyer). Pittsburgh, PA: U.S. Department of Health and Human Services, Public Health Service, Centers for Disease Control and Prevention, National Institute for Occupational Safety and Health, 1 p.
The National Institute for Occupational Safety and Health, 1999, Lake Lynn Laboratory (flyer), Pittsburgh, PA: U.S. Department of Health and Human Services, Public Health Service, Centers for Disease Control and Prevention, National Institute for Occupational Safety and Health, DHHS (NIOSH) Publication No. 99-149, 1 p.
Thompson, T.W., 1979, A Review of Earth-Based Radar Mapping of the Moon: The Moon and Planets, v.20, p. 179-198.
Triebsch, G.F. and M.J. Sapko, 1990, Lake Lynn Laboratory: A State-of-the-Art Mining Research Laboratory, in Proceedings of the International Symposium on Unique Underground Structures, June 12-15, 1990, Denver, CO, Chapter 75, pp. 75-1 to 75-21.
Ulriksen, C.P., 1980, Investigation of Peat Thickness with Radar: in 6th International Peat Congress, Aug.17-23, Duluth, MN, p.126-129.
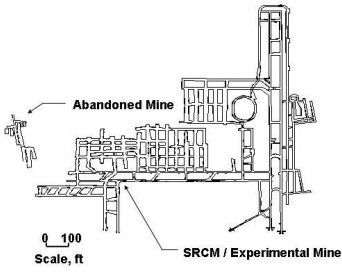
Figure 1. Layout of the NIOSH Safety Research and Experimental Mines.
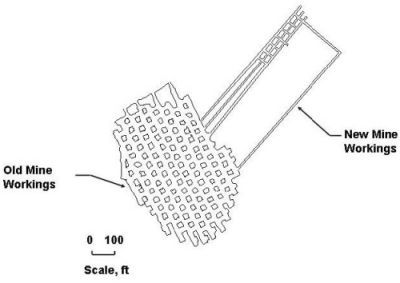
Figure 2. Layout of the NIOSH Lake Lynn Laboratory Experimental Mine.
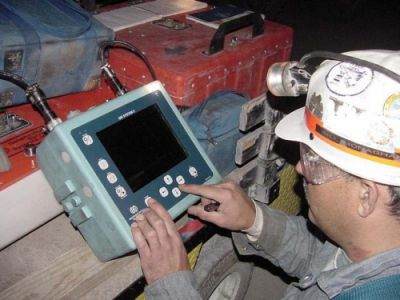
Figure 3. Photo of Engineer using the SIR-2 System.
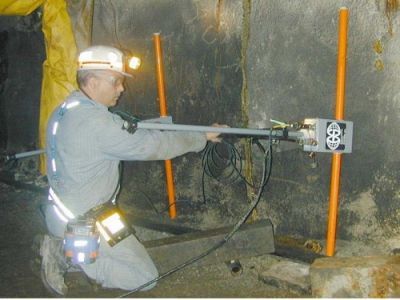
Figure 4. Photo of Engineer holding 80-MHz (Multiple Low Frequency) antenna.
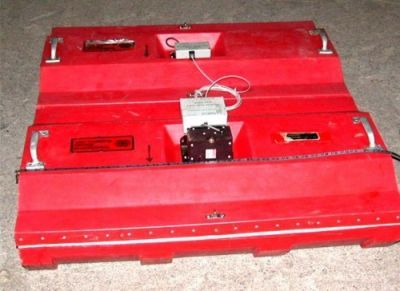
Figure 5. Photo of 100-MHz antenna (as configured antenna size 33 in by 44 in).
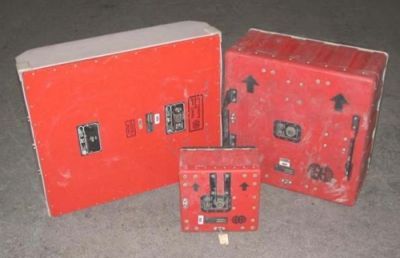
Figure 6. Photo of 200- (antenna size 24 in by 24 in), 300- (antenna size 27 in by 31 in) and 400-MHz antennas (antenna size 12 in by 12 in).
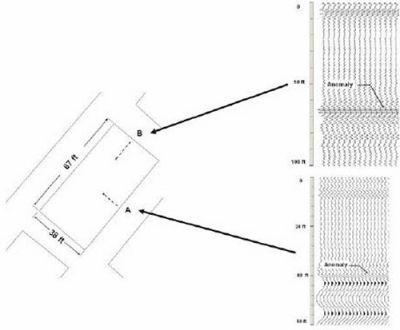
Figure 7. Layout of test pillar at LLL and examples of the 100-MHz interpreted radar records for the calibration tests. Note the dashed arrow shows the direction of the transmitted radar pulse.
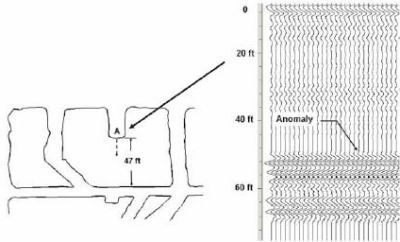
Figure 8. Station A - SRCM layout map and the 100-MHz interpreted radar record for the calibration tests. Note the dashed arrow shows the direction of the transmitted radar pulse.
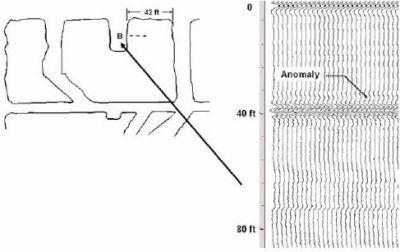
Figure 9. Station B - SRCM layout map and the 100-MHz interpreted radar record for the calibration tests. Note the dashed arrow shows the direction of the transmitted radar pulse.
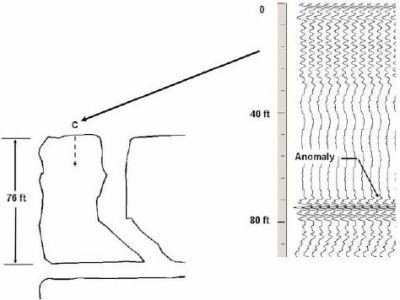
Figure 10. Station C - SRCM layout map and the 100-MHz interpreted radar record for the calibration tests. Note the dashed arrow shows the direction of the transmitted radar pulse.
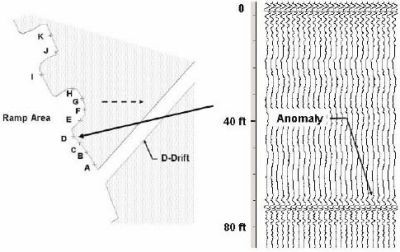
Figure 11. Layout of stations for radar capability testing at LLL and an example of the 100 MHz interpreted radar record (station D). Note the dashed arrow shows the direction of the transmitted radar pulse.
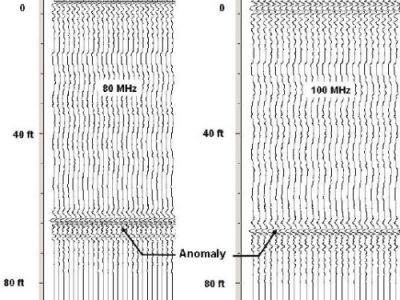
Figure 12. Interpreted radar records for the 80- and 100-MHz antennas at station D-LLL.
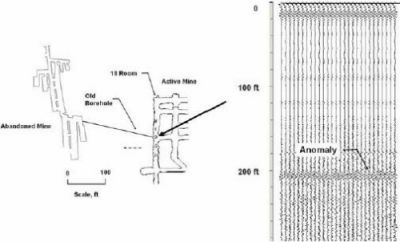
Figure 13. Layout of stations for radar capability testing at the SRCM and an example of the 100-MHz interpreted radar record (station D). Note the dashed arrow shows the direction of the transmitted radar pulse.
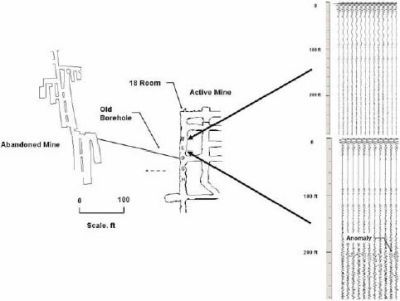
Figure 14. Layout of stations for radar capability testing at the SRCM and examples of 100-MHz interpreted radar records (stations E & F). Note the dashed arrow shows the direction of the transmitted radar pulse.
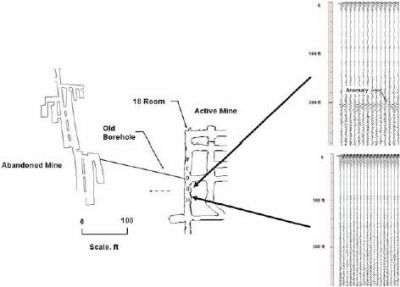
Figure 15. Layout of stations for radar capability testing at the SRCM and examples of 100-MHz interpreted radar records (stations G & H). Note the dashed arrow shows the direction of the transmitted radar pulse.
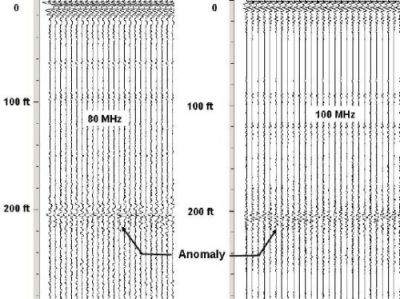
Figure 16. Interpreted radar records for the 80- and 100-MHz antennas at station E - SRCM.
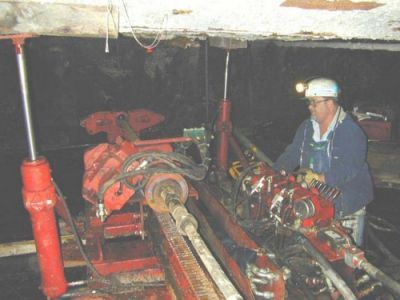
Figure 17. Photo of electrohydraulic drill rig that was used to drill the horizontal borehole.
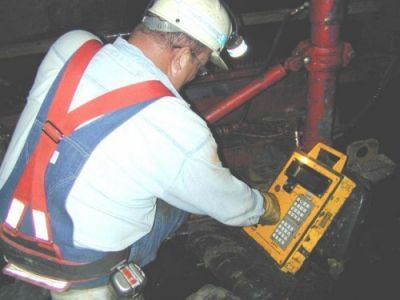
Figure 18. Target Drilling Engineer performing survey of borehole using DDM MECCA unit.
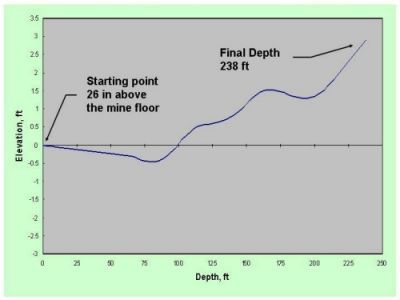
Figure 19. Side view trajectory of the borehole.
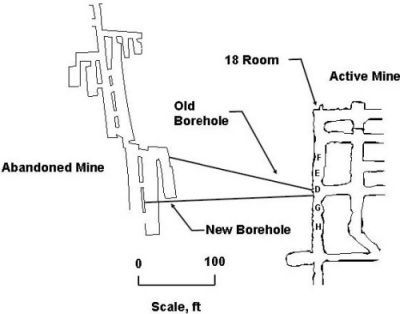
Figure 20. Final position of the new borehole relative to the abandoned mine and SRCM.
1 Mention of specific product or trade name does not imply endorsement by NIOSH.