

Archived: Interstate Technical Group on Abandoned Underground Mines
An Interactive Forum
Subsurface Void Detection using Seismic Tomographic Imaging
Roland Gritto
Lawrence Berkeley National Laboratory
Berkeley, CA 94720, USA
Abstract
Tomographic imaging has been widely used in scientific and medical fields to remotely image media in a nondestructive way. This paper introduces a spectrum of seismic imaging applications to detect and characterize voids in coal mines. The application of seismic waves to detect changes in coal relies on two types of waves: body waves refracted along the interface between coal and bedrock (i.e., refracted P-waves) and channel waves that propagate directly through the coal (dispersive wave trains of the Rayleigh or Love type). For example, a P-wave tomography study to find underlying old mine workings in a coal mine in England, produced velocity patterns that revealed increases in velocity where high stress concentrations occur in the rock, which are most likely connected to old pillars left in support of the old working areas. At the same time, low velocities were found in areas of low stress concentrations, which are related to roof collapses indicating the locations of mined areas below. The application of channel wave tomography to directly image the presence of gaseous CO2 in a low velocity oil reservoir showed that the injected CO2 followed an ancient flow channel in the reservoir migrating from the injector to the producer well. The study showed how channel waves are preferable over refracted P-waves, as the latter were only marginally affected by the presence of the gas in the low-velocity channel. Similar approaches show great promise for the detection of voids in coal mines. Finally, a newly developed technique, based on scattering theory, revealed that the location and the size of a subsurface cavity could be accurately determined even in the presence of strong correlated and uncorrelated noise.
Introduction
Noninvasive techniques have been widely used in medical, engineering, and earth sciences applications to image the structure of a medium inaccessible to direct observations. Tomographic imaging is a noninvasive technique that has been successfully used for a wide range of applications ranging from medical imaging of the human body to imaging the interior structure of the Earth (Nolet, 1987). The physical and mathematical concepts underlying both applications are the same, in that X-rays, electromagnetic or seismic waves are sent through the material to illuminate its structure. Sources and receivers, emitting and recording the waves, need to be well positioned around the object to obtain good coverage of the raypaths associated with the waves propagating through the medium. The better the ray coverage throughout the medium, the more reliable are the imaging results. In the case of medical imaging sufficient ray coverage can be easily achieved as the human body can be placed in CAT-scanning devises that dense coverage of sources and receivers yielding resolutions on the order of millimeters. In scientific applications, however, where the object under investigation is a section of the Earth's subsurface that is inaccessible for direct investigations, sufficient ray coverage may be difficult to achieve. If the medium is accessible from the surface only, the resulting poor ray coverage prevents the application of tomographic methods. If, on the other hand, boreholes can be placed such that the medium under investigation is located between the wells, tomographic methods yield reliable estimates about the physical parameters of the medium.
In the case of underground coal mines, access is given by panels and shafts, which allow sources and receivers to be placed along the face of coal seams to image the properties of the coal in a horizontal plane. Such a transmission survey will yield good estimates of the coal properties between the source and receiver locations. If underground access is not available, an array of boreholes that penetrate the coal seam from the surface can be set up. In this case the boreholes can be used as source and receiver holes (sources and receivers would be fired at mid-seam depth). However, this type of survey, which is often referred to as a cross-hole seismic survey, is limited to transmission experiments, as the density of boreholes needed for sufficient tomographic ray coverage is prohibitively expensive. A cross-hole seismic survey would yield information about the existence of a disturbance between sources and receivers, but not about its location or nature. Results, similar to those obtained for underground transmission surveys, can be produced from the surface when horizontal boreholes are drilled within the coal seam.
During the past 30 years in-seam seismic methods have been applied in coal mines around the world to find disturbances in the coal seams, which pose a risk to coal mining activities (Buchanan et al., 1981; Mason, 1981; Dresen and Rueter, 1994). Disturbances may vary from faults that offset coal seams and reduce production rates of longwall mining operations, to abandoned mine workings that may be water-filled and pose a general risk to underground activities, to gas-filled mylonized zones which may trigger explosions upon sudden stress release due to mining. In-seam seismic techniques include transmission surveys (including tomographic methods) and reflection surveys. In the current paper the application of tomographic, in-seam seismic, and scattering techniques, will be discussed and evaluated with respect to subsurface void detection.
Principles of Seismic Wave Propagation in Coal
A coal seam embedded in bedrock constitutes a low velocity channel for elastic waves propagation. If a source (e.g. an explosive charge) is fired in the middle of the coal seam, elastic waves propagate from the source in all directions throughout the coal. Upon encountering the coal rock interface along the roof and floor of the coal seam part of the energy is refracted along this interface as compressional- (P) and shear waves (S) propagating with their respective velocities of the bedrock medium. Because these waves refract along the interface they are not directly affected by voids in the coal. However they are affected by secondary effects caused by the presence of a disturbance in the coal seam (see below). In addition to being refracted along the interface upon encountering the coal boundary, the waves are also reflected back into the seam under various angles with different phase velocities and form a system of constructive interference. The created interference system is a channel (or seam) wave propagating in two dimensions within the coal seam without radiating energy into the surrounding bedrock. Because the propagation is only two dimensional, long transmission distances of up to 2 km have been reported for channel waves in coal seams in the past (Greenhalgh et al., 1986). There are two types of seam waves: Rayleigh waves, which are comprised of body waves of the P and SV type that have a vertical elliptic particle motion, and Love waves, comprised of SH waves only, which reveal a horizontal particle motion. Both types are commonly excited and interpreted in in-seam seismic surveys. The interference of phases created under various angles of reflection leads to dispersion of the channel waves. Dispersion occurs when the propagation velocity of a wave in a medium is a function of frequency, which means that the different frequencies of the channel waves propagate at different speeds. As a result, the longer the travel distance of the wave the more its phases get separated and the wave train is recorded as an elongated arrival on the seismogram (Gritto and Dresen, 1992).
Both wave types, the refracted interface waves and the channel waves, can be used for tomographic imaging of coal properties. Although the use of channel waves in tomographic applications to image coal properties is more reliable than that of refracted waves, the former is less commonly used, because the processing of the data has to account for the dispersion of the waves. In the following two examples of P- and channel wave tomography in low velocity channels will be given.
Tomographic Imaging of Subsidence in Old-Mine Workings
The current example is reported by Mason (1981), where a tomographic survey was performed in the High Hazles seam of Thorseby colliery near Nottingham, England. The objective was to delineate old abandoned mine workings below a currently mined coal seam. Old mine workings can cause problems beyond the threat of water flooding of active mine areas, by increasing the stress in the panels above or below the old workings. Zones of increased stress can interfere with long-wall mining activities or produce outburst of rock mass from the coalface.
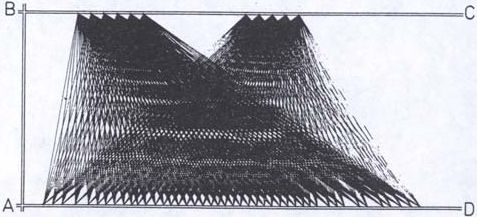
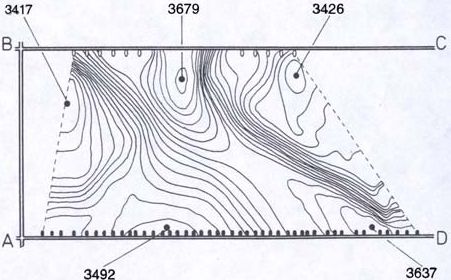
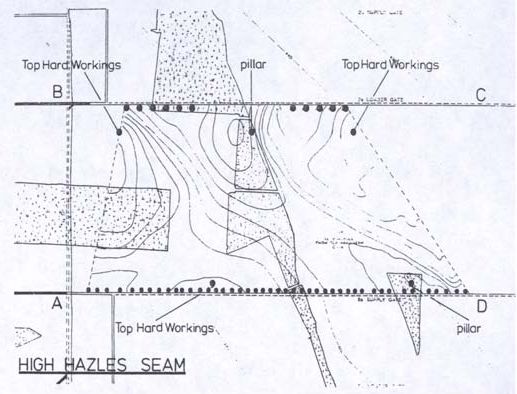
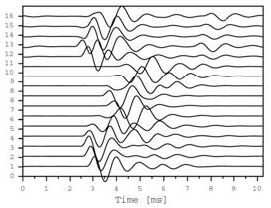
The imaged area included a 950 x 425 m block of coal, shown in Figure 1, where access to three sides was provided by tunnels in the mine. An array of shot locations and two sub-arrays of receivers were set up along opposing panels, as shown in Figure 1. Shots consisted of 227g charges located in 1-m long horizontal boreholes separated by 20 m along the tunnel wall, while two groups of geophones where positioned along the opposite tunnel at 30 m spacing. The resulting ray coverage is shown in Figure 2. First arrival times were determined from refracted P-waves propagating along the interface between the coal and bedrock, and an algebraic reconstruction technique was used to estimate the velocity distribution in the coal. The result of the inversion process is given in Figure 3, where the velocity field is given by contour lines. Estimates of the highest and lowest velocity values are given by spot values. It can be seen that high and low values alternate along the outskirts of the imaged area. The interpretation of these data is simplified by superimposing a surveyor map of the old mine workings in the underlying coal seam. Figure 4 shows the superposition of the two results. The shaded areas indicate the position of pillars left in place after excavation in the underlying seam. It can be seen that high velocity values spatially coincide with the location of the pillars, while low velocity values coincide with the mined areas. Because seismic velocities in the earth increase with depth as the increase in pressure causes voids and cracks to close, it is likely that the increase in stress field created by the underlying pillars is affecting the seismic waves propagating through the coal seam. In contrast, the roofs of mined areas collapse around support pillars creating cracks and voids in the medium above by reducing the stress in the strata, and thus decreasing the seismic wave velocity in the roof. The same statement holds true for situations where the disturbance is directly located within the coal seam between sources and receivers. Therefore, the distribution of seismic velocities of refracted waves in coal channels can be used as an indirect measurement of the state of mining in the seam.
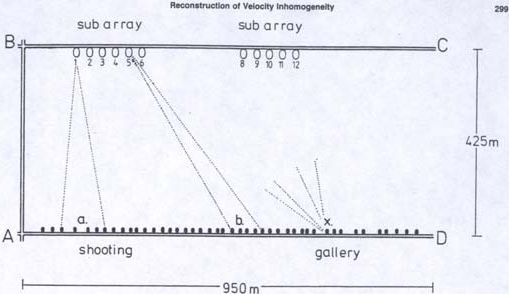 Figure 1: Plan view of the surveyed panel. Shot point and receiver locations are indicated by black dots and ellipses, respectively. (Mason, 1981)
|
However, direct measurements of coal properties between sources and receivers would yield more reliable estimates of the presence of disturbances in the coal. The following example shows an experiment where channel wave tomography was used to image the distribution of CO2 in a thin low-velocity reservoir.
Tomographic Imaging of a CO2 Flood in a Low-Velocity Oil Reservoir
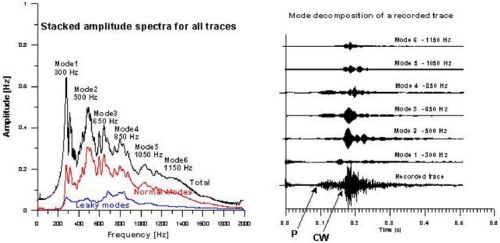
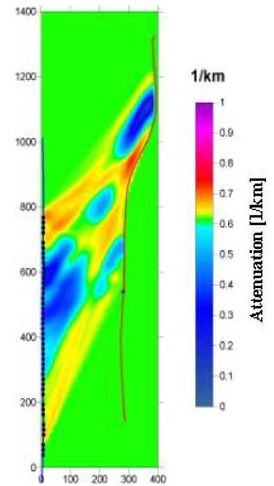
The advantages of CO2 injection into oil reservoirs are two-fold. It enhances the recovery of oil in place that would be difficult to produce otherwise, while it offers one method of geologic carbon sequestration. During a recent experiment in an oil field, CO2 was injected in a 10 m thick oil reservoir at a depth of 1500 m, to decrease the viscosity of the oil in place and increase production rates (Majer et al., 2001). The boreholes were drilled using directional drilling technology reaching vertically down to a depth of 1500 m before turning horizontally for a distance of 1000 m in the reservoir layer. The reservoir consisted of a limestone deposit between two anhydrite layers, thus forming, similar to the situation of a coal seam, a low-velocity channel between fast bedrock layers. To map the location of the injected CO2 it was decided to conduct a tomographic experiment, where sources and receivers were placed in opposing horizontal boreholes within the limestone reservoir. The source was piezoelectric ceramic attached at the end of coil tubing, while the receivers where hydrophones placed inside a fluid-filled coil-tubing string. Figure 5 shows a plan view of the horizontal projections of injector and producer well. The two wells were located 300 m apart, while the length of the imaged area was approximately 500 m. A total of 100 source and 72 receiver positions were used during the experiment. The amplitude spectra of a typical seismic trace and its spectral decomposition are shown in Figure 6. A total of six modes were recognized in the data. The bottom trace in the right panel of Figure 6 shows a recorded trace. The refracted P-waves arrive as small amplitudes at about 0.1 ms while the channel waves are represented by the largest amplitudes on the seismogram arriving at about 0.17 ms. In addition to the fact that the channel waves propagate directly through the low velocity reservoir (whereas the P-waves propagate along their boundary with the hostrock) their amplitudes have a much higher signal-to-noise-ratio than in the case of the P-waves, and therefore are better suited to estimate the properties of the reservoir. However, the arrival times of the channel waves are difficult to determine, because of their dispersive character and therefore it was decided to compute the energy within a time window of the 4th mode (at 850 Hz) and use this parameter to estimate the spatial distribution of the attenuation in the reservoir. It is know that gas (being more compressible than rock and water) attenuates seismic waves during propagation and thus areas of increased attenuation (decreased amplitudes) would indicate the location of the CO2 in the reservoir. The result of the attenuation imaging is given in Figure 7. The color scale indicates attenuation levels of the channel waves with 1 and 0 representing high and low attenuation, respectively. In the current case the yellow-reddish areas indicate the locations of the gaseous CO2 in the reservoir. Surface reflection and reservoir modeling studies subsequently confirmed the results of the tomography study. The linear yellow-reddish structure in the upper part of the image trending from 1000 m across the image to 800 was identified as a flow channel in the limestone reservoir. Similar results can be expected for the imaging of water or gas filled voids in coal seams.
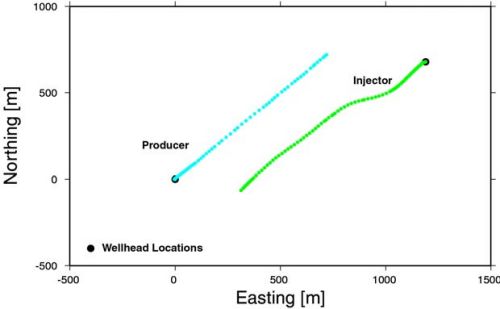 Figure 5: Plan view of the horizontal section of the injector and producer wells. Source and receiver positions are indicated by green and blue dots respectively.
|
Imaging of Subsurface Voids using a Scattering Approach
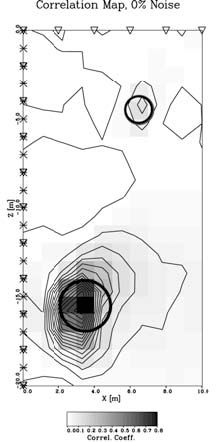
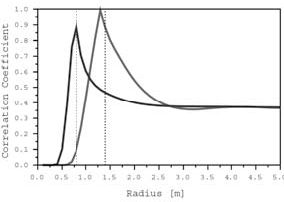
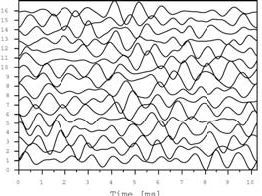
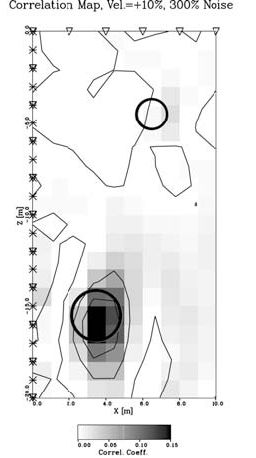
In a recently developed approach, the location and size of subsurface cavities was accurately determined even in the presence of strong correlated and uncorrelated noise (Gritto and Majer, 2000). The method can be applied in cases when information about the background medium is available such as the case of a cavity in a coal seam. The knowledge of the background medium, and the information that a water- or air-filled cavity is the target, reduces the experiment to a problem with two unknowns: the location and size of the cavity. Based on this a priori information a correlation analysis in conjunction with a grid search can be performed to estimate these parameters. Figure 8 shows the results of a numerical experiment where the "field" data was generated using an analytic solution for the scattering of elastic waves by a sphere (Korneev, and Johnson, 1996). The inversion approach is based on the Mie approximation for the same scattering problem (Korneev and Johnson, 1993), which is an approximation to the exact solution in the low to intermediate frequency range. The geometry of the experiment is given in Figure 8b, where two cavities with different radii are located in the subsurface. Seismic sources and receivers are distributed in a borehole and along the surface. Figure 8a shows the scattered field for the two cavities as computed by the analytic solution. The correlation map in Figure 8b was computed using a maximum likelihood approach. Scattering functions based on the Mie approximation were computed for a representative cavity for 200 possible cavity locations in the subsurface, and correlated with the exact scattered field shown in Figure 8a. This resulted in the correct location of both cavities in the subsurface. In a second inversion step, scattering functions were computed for cavities with varying radius at the newly found locations, and subsequently correlated with the data shown in Figure 8a. The result is shown in Figure 8c, where it can be seen that the radii of the cavities are well estimated. The next case indicates what happens when the "field" data is contaminated by large-amplitude noise as seen in Figure 9a, where 300% uncorrelated white Gaussian noise was added to the data. In addition, the background velocity, which is assumed to be known, is intentionally chosen to be too high in this case (+10%). Although the low signal-to-noise ratio of the seismic data seem to render any successful data processing impossible, the correlation analysis still provides reasonable results, as the large cavity is still correctly located in space, while the location of the smaller one has migrated to the right, because of the assumption of a higher background velocity. Similarly the radii in Figure 9c are well estimated. Thus the problem of locating and estimating the size of subsurface cavities can be solved by correlation analysis even in the case of large data noise. The important fact is that enough data is collected over a certain bandwidth to be able to improve the signal-to-noise ratio by stacking the results during the correlation analysis. In a similar way, the problem of locating voids in coal seams can be approached.
|
Conclusions
Tomographic imaging has been successfully applied in the past to estimate properties of the medium under investigation. The better the source and receiver coverage, the more reliable are the results of the imaging. Inherent problems associated with tomographic methods are limited access and long propagation distances between sources and receivers. The longer the wavelength of the seismic wave the farther is its maximum propagation distance, but the lower is the resolution of the wave. In contrast, short wavelengths provide high resolution but their propagation is limited to short distances. Thus, a good balance is required between resolving power and sufficient propagation distance to image the medium under consideration.
Seismic detection of voids in coal seams can be based on two principles: direct and indirect measurements. If seismic P-waves are used for detection, indirect parameters will be measured such as induced stress patterns in the roof or floor of the coal seam, because the P-waves propagate along the coal/bedrock interface and thus are not directly affected by the presence of a void. Experience is needed to interpret the resulting velocity patterns to estimate the location and size of a cavity. The migration of stress through rock is a diffuse process and anisotropic stress pattern, present even in apparently homogeneous rock, are to be expected in mining areas. The general layout of coal mines, including multiple levels of tunnels to mine vertical sequences of coal seams, gives rise to this complicated stress pattern. In some instances a calibration of the method in areas with known voids is preferable to determine the characteristics of the resulting velocity pattern.
If channel waves are used, the obstruction by voids located in their path becomes apparent in terms of increased travel times and attenuated amplitudes, relative to channel waves that had a clear path through the coal. Because the obstruction of the travel path can be observed in most tomographic surveys, the estimation of location and size of voids becomes more reliable. Channel waves exhibit more bandwidth than P-waves. The higher the transmitted seam waves frequencies, the higher the resolution of the survey. The phases of high frequencies are concentrated within the area of the coal seam whereas lower frequencies carry energy outside as well as within the seam (Gritto and Dresen, 1992). If phases with lower frequencies encounter an object during propagation, part of the channel wave is reflected back, while the part propagating in the bedrock adjacent to the coal seam continues unaffected. These phases will interfere constructively again, and create a new channel wave several wavelengths behind the disturbance. The only noticeable difference is a reduction in high frequency energy, requiring a careful analysis of the transmission seismograms for these effects. In a best-case scenario, high frequency sources (e.g. small explosive charges) should be used such that the frequency content is high enough and energy is confined to the coal seam. However, these high frequencies will be attenuated quickly and thus a compromise between resolution and distance of propagation must be found individually for each case.
Void detection in coal mines is a difficult task, because of the complicated geology encountered in previously mined areas. Collapsing roof structures produce strong heterogeneities that scatter rather than reflect energy in a coherent from. This results in the recording of seismic waves that resemble more typical noise patterns than coherent data containing the necessary information about the voids. Recent developments in scattering theory, however, resulted in promising techniques to utilize the scattered energy to determine the location and size of voids in the subsurface.
A combination of the above mentioned techniques will likely yield the highest success rate, as they are complimentary to each other. The data can be collected in a single seismic experiment, as long as the specifics of each technique are taken into consideration (i.e., use of sources with sufficient bandwidth, use of 3-component geophones, etc.). Therefore, the costs of data collection will not be higher than for any other seismic experiment that uses only one of the above mentioned techniques.
Acknowledgement
This work was supported by the Director, Office of Science, Office of Basic Energy Sciences, Division of Engineering and Geosciences, of the US Department of Energy under Contract No. DE-AC03-76SF00098. Data processing was performed at the Center for Computational Seismology, LBNL, which is supported under the same contract.
Literature
Buchanan, D.J., Davis, R., Jackson, P.J. and Taylor, P.M. (1981): Fault location by channel waves seismology in United Kingdom coal seams, geophysics, Vol. 46, pp. 994-1002.
Dresen L. and Rueter, H. (1994): Seismic coal exploration, Part B: In-seam seismics, Vol. 16B, eds. Helbig, K. and Treitel, S., Pergamon, pp. 433.
Greenhalgh, S.A., Burns, D. and Mason, I. (1986): A cross-hole and face-to-borehole in-seam seismic experiment at Invincible Colliery, Australia, Geophysical Prospecting, Vol. 34, pp. 30-55.
Gritto, R. and Dresen, L. (1992): Seismic modelling of seam waves excited by energy transmission into a seam, Geophysical Prospecting, Vol. 40, pp. 671-699.
Gritto, R. and Majer E.L., (2000): Seismic Mapping of Subsurface Cavities, Conference Proceedings of the Annual Symposium on the Application of Geophysics to Engineering and Environmental Problems (SAGEEP), Arlington, VA, pp. 1215-1244.
Korneev V.A. and L.R. Johnson, (1993): Scattering of elastic waves by a spherical inclusion - I. Theory and numerical results, Geophys. J. Int., 115, pp. 230-250.
Korneev V.A. and L.R. Johnson, (1996): Scattering of P and S waves by a spherically symmetric inclusion, PAGEOPH., 147, pp. 675-718.
Majer, E.L., Daley, T.M., Gritto, R., Korneev, V.A., and Li, G., (2001): Application of cross well and single well seismic methods for mapping CO2 movement, Proceedings, GSA, 97th Annual Meeting.
Mason, I., (1981): Algebraic reconstruction of a two-dimensional velocity inhomogeneity in the High Hazle seam of Thoresby colliery, Geophysics, Vol. 46, pp. 298-308.
Nolet, G. (ed.), (1987): Seismic Tomography, D. Reidel Publishing Company.