

Archived: Interstate Technical Group on Abandoned Underground Mines
An Interactive Forum
Advanced Electromagnetic Wave Technologies for the Detection of Abandoned Mine Entries and Delineation of Barrier Pillars: Continued - Part 2/3
Coal Seam Vision with the Radio Imaging Method (RIM)
The coal seam waveguide is effective in the frequency range above 10 kHz to at least 500 kHz. Near the low-frequency limit, in-mine experiments suggest that it is difficult to excite the seam transmission mode with reasonable size loop (magnetic dipole) antennas. At the high-frequency limit, the attenuation rate of the wave increases and limits the operating range.
Mr. Roger Fry, Senior Geologist at Utah Power and Light Company, and Stephen Doe, Senior Geologist at American Electric Power's Meigs Division mining complex, undertook the first RIM tomography surveys in 1985 and 1986 (20-23). Since then, RIM has been used extensively in the United States, Australia, New Zealand, South Africa, and the United Kingdom to evaluate coal seam geology (24, 25). More than 500 surveys have been conducted world wide.
RIM has proven cost effective in detecting voids and geologic anomalies in coal beds. RIM EM waves strongly interact with the types of geologic anomalies shown in Figure 19. The observable in the RIM data is increased attenuation rate.
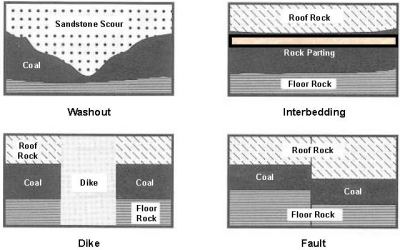
Figure 19. Natural coal seam anomalies
Mine safety is adversely impacted near anomalous geologic zones. Dikes, faults, and paleochannels alter the roof rock and contribute to the potential for roof falls. Oftentimes, high-pressure water and gas are trapped in slip fault zones. Rock falls occur along the margins of paleochannels as illustrated in Figure 20.
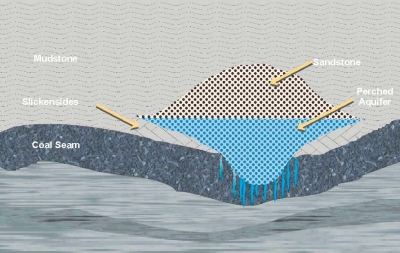
Figure 20. Cross section of a paleochannel
Differential compaction combined with scouring and thinning of sedimentary rock overlying the seam creates the roof fall hazard. Roof control should be more aggressive in entries that are developed under channel margins.
Dealing with the problem of minimizing mining hazards and risk involves a three-step procedure: detection, confirmation, and mitigation. RIM is cost effective in detection of voids and geologic anomalies. Confirmation requires two steps. First, tomography surveys provide a silhouette map of the anomalous region and higher attenuation rate zones locate voids and anomalies. Second, using tomography as a means of targeting, horizontal directional drills with integrated radar can acquire confirmation data. Mitigation may require accurate horizon control of the cutter drum under the channel margins.
Tomography resolution has been improved with the development of three-dimensional (3-D) processing algorithms. The comparison of tomography algorithms is illustrated in Figure 21.
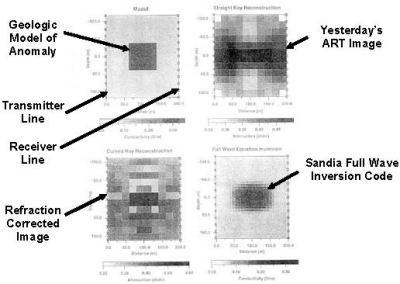
Figure 21. Comparison of RIM image reconstruction methods
The comparison of reconstructed images shows that the algebraic reconstruction technique (ART) produces a smeared image in the direction of wave propagation. The ART algorithm assumes that the coal seam waveguide signal travels on a straight ray path. Severe geologic anomalies cause refraction of the signal, and the ray path assumption fails. This is the cause of the smeared image. In mild anomalies in the Pittsburgh coal seam, the image is not significantly distorted. Cross-panel RIM tomography has proven effective in detecting geologic anomalies within longwall panels. The full-wave algorithm processes the RIM receiver magnitude and phase data to reconstruct the image with much higher resolution than ART.
Advanced RIM instrumentation has been developed that achieves an operating range exceeding 1800 ft in coal beds (26).
The instrumentation was applied in the detection and imaging of dykes, faults, and paleochannels. The image of a paleochannel in a longwall panel is illustrated in Figure 22 (26).
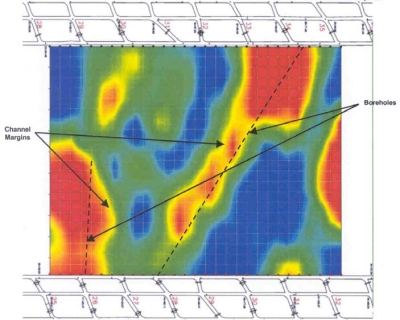
Figure 22. Image of a paleochannel in a 1,000-ft-wide longwall panel
The image maps the attenuation rate of the RIM-IV signal in the coal bed. The warmer colors indicate the regions of the panel where the attenuation rate increases; geologic anomalies are suspected within the red zone. Since the RIM-IV signal attenuation rate increases under a paleochannel, the red zones illustrate paleochannels crossing the longwall panel. Oftentimes, meandering channels scour into the coal bed where the energy of the water flow is maximized (cut bank). Along the margins of the channel, the roof rock is fractured by differential compaction. It is not possible to determine the amount of scouring or roof rock fracturing from the image alone. Mine planning requires an additional step of confirmation. Confirmation can be achieved by horizontal directional drilling (dashed line) in the red zones to determine seam height. Oftentimes, undulations in the coal bed occur under a paleochannel. However, horizontal drilling requires improved guidance and navigation technology to ensure the drill stays within the seam and intersects the target. By integrating radar and navigation technologies (such as drillstring radar [DSR]) with horizontal drilling, the seam height can be mapped along the drillhole, and this feature will ensure adequate guidance. The coal bed undulation can be determined from the processed radar data and navigation information used to enable accurate confirmation.
Crosswell RIM-IV instrumentation can complement directional drilling by imaging between pairs of boreholes. Tomographic imaging can map voids between two parallel boreholes or between a mine entry and a horizontal borehole. Tomographic imaging requires the movement of the RIM-IV receiver and transmitter in the boreholes. The transmitter can be maneuvered with the horizontal drilling machine.
Void Detection with Electromagnetic Wave Methods
Pennsylvania Governor Mark Schweiker's special Commission on Abandoned Mine Voids and Mine Safety Report recommendation for detection and imaging technologies is achieved by integrating radar on horizontal drills and applying RIM crosswell imaging. Over the past 20 years, there have been a total of 449 inundations in underground mines—397 in coal and 52 in metal/non-metal mines (27). These inundations have occurred at the rate of nearly two per month. To decrease the risk of mining into old works, mines operating within 200 ft of a known working are required to drill boreholes 20 ft in advance and at 45-degree angles every 8 ft of development. The combination of radar and RIM is cost effective in that drilling every 8 ft of advance increases product cost by as much as $5 per ton.
Stolar Radio Imaging Method in Void Detection
3-D RIM to Locate and Image Mine Voids
Several configurations of RIM instrumentation are available for deployment at the mine site for void detection surveys. These configurations consist of an in-mine man-portable RIM system for use in exiting entries, and a borehole probe system for use in drillholes originating from either the surface (vertical boreholes) or in-seam (horizontal boreholes). The systems are flexible to enable combinations of borehole to in-mine scans as well.
The RIM technology can be used to help current mining operations avoid old mine workings by two methodologies: (1) confirmation of barrier pillar integrity with a pillar fence line, or (2) location and imaging of the old workings with tomographic imaging.
Principles of Void Detection with RIM
Irrespective of which survey method is used (fence-line or tomography), the detection of voids (mine entries) within a coal seam using RIM is based entirely on the waveguide behavior of the coal seam itself. The RIM EM wave travels in a "trapped" mode in the coal between the conductive roof and floor material. The EM wave travels along a "ray path" or "wave front" from transmitter to a companion receiver, decaying in signal strength as a function of distance. In homogeneous conditions, the rate of this decay is consistent and predictable beyond the near field of the transmitting antenna.
In a homogeneous coal seam, the EM wave (radio signal) attenuates (decays) with distance traveled at a fixed rate; this is termed the attenuation rate. If a geological anomaly exists along the ray path, the receiving antenna will measure lower signal strength (increased attenuation rate). Geological anomalies that will affect the RIM signal include faults, dykes, paleochannels, seam thinning, and increased water in the seam. Non-geological anomalies that may affect the RIM signal include abandoned mine works. If a portion of that seam waveguide is water-filled or air-filled, the rate of decay changes. A plot showing the normal attenuation rates (as a function of frequency) in air, coal, and water is shown in Figure 23.
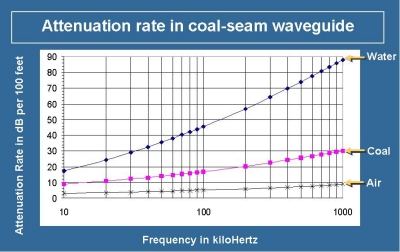
Figure 23. Normal attenuation rates (as a function of radio-wave frequency) for water-filled, air-filled and coal waveguides
As an example: if a 100-kHz radio wave travels 100 ft in a coal seam with a normal attenuation rate of 18 dB/100 ft, it decays by 18 dB. If the radio wave must travel through a 20-ft-wide water-filled entry, it will decay at a rate of 45 dB/100 ft over those 20 ft instead of the coal-based rate. The difference between the coal rate and the water rate is 27 dB/100 ft and its effect on the attenuation is an additional 5.4 dB (excess loss = 20 ft x (0.45 - 0.18) dB/ft = 5.4 dB). Therefore, the total signal loss for the radio wave is 23.4 dB instead of 18 dB due to the presence of the water-filled entry (a 30% increase for a 100-ft signal path).
The example described above is an idealized case. The attenuation rates measured in the field are a function of seam thickness, geology, electrical conductivity, and moisture. Most coal seams have a standard attenuation rate of 5 to 10 dB/100 ft, which increases 3 to 6 dB if entries are encountered.
3-D RIM Configurations
The RIM instrumentation systems currently available for field use are in-mine and downhole instrumentation.
In-Mine 3-D RIM Survey Instrumentation
The in-mine instrumentation is illustrated in Figure 24. The synchronizing (sync) signal is sent from the sync transmitter through the coal seam waveguide to a companion receiver at a very low frequency. Figure 9 shows that the low-frequency sync signal is insensitive to the geology of the coal bed. The sync is recovered at the sync receiver and then sent over nonconducting fiber-optic cable to the RIM-IV receiver.
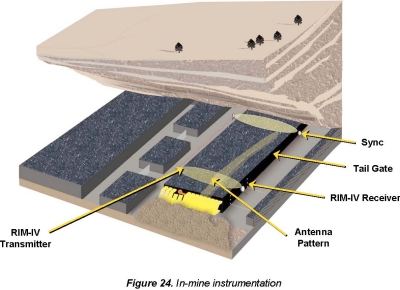
Figure 24. In-mine instrumentation
The in-mine system incorporates environmentally sealed housings for its electronics or antennas and is awaiting final assembly in flameproof and sealed enclosures for its electronics, battery pack, and antennas. The in-mine 3-D RIM instrumentation consists of a transmitter (TX) and a receiver (RX). The current In-Mine RIM transmitter instrument is shown in Figure 25.
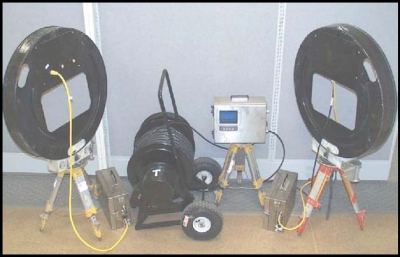
Figure 25. In-Mine RIM-IV transmitter
Fiber-optic cable and adapters interconnect the In-Mine 3-D RIM instruments to air-core loop antennas (hermetically sealed) and a central graphical user interface (GUI) housed in an explosion-proof (X/P) enclosure.
Downhole Survey Equipment
The downhole RIM-IV instrumentation can be applied in vertical boreholes as illustrated in Figure 26.
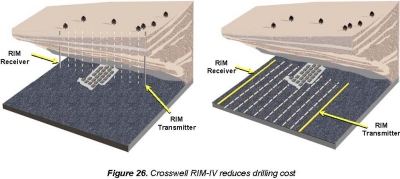
Figure 26. Crosswell RIM-IV reduces drilling cost.
The RIM downhole instrumentation consists of a multi-frequency transmitter and receiver units designed for borehole applications. The antennas consist of wound ferrite cores powered by downhole batteries and phase linked by a fiber-optic synchronization cable. The field procedure is to set up transmitter (TX) and receiver (RX) units in adjacent boreholes and measure the decay of the RIM signal over distance (the "measured signal strength"). Signal strength will be diminished by any disruption to the seam waveguide properties-in this case, by voids associated with underground mine works. Figure 27 illustrates void detection with RIM crosswell instrumentation.
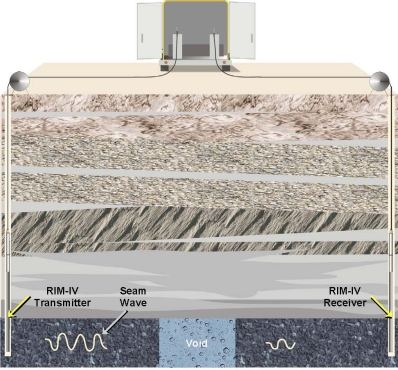
Figure 27. Crosswell detection of a coal seam void
The survey involves the use of a central control unit (instrumentation trailer) that houses the TX and RX hoists and a data logger/computer. Field personnel communicate by means of two-way radios to synchronize the insertion of the probes into the borehole, the lowering of the antennas to the appropriate horizon, and the removal of the probes from the hole. Coordination of the project is the responsibility of the senior RIM engineer located in the central control unit.
The data are recorded on computer and subsequently downloaded and interpreted by a qualified Stolar geophysicist. The Stolar RIM Instrumentation Trailer is shown in Figure 28. The RIM Trailer can be placed anywhere in the borehole pattern and sequentially deploy its downhole probes over fiber-optic cables to the borings.
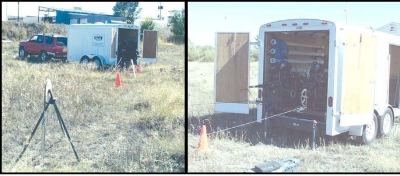
Figure 28. The RIM downhole probes are lowered into vertical borings using fiberoptic cable (left photo). Stolar's RIM Instrumentation Trailer contains two (2) cable hoists, control electronics, and probe inventory (right photo).
The antennas are lowered to the middle of the seam in both TX and RX boreholes, and the signal propagates through the coal seam waveguide. The RX unit measures the signal strength. It is important to have available accurate seam depth information in order to position the antennas in the appropriate part of the coal sequence. However, irrespective of the provided depth information, experimentation in the field by the RIM engineer will confirm the position of the antenna in the seam (moving of the probes out of the coal will result in a noticeable decrease in signal strength).
The advanced downhole 3-D RIM is shown in Figure 29. This packaging includes stainless steel or titanium X/P housings for all the electronics and batteries. The antenna housing is a fiberglass composite and the mil-spec fiber-optic cable is deployed from a portable electric hoist.
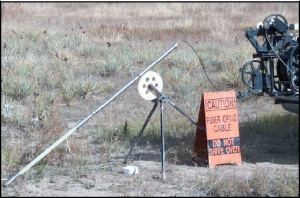
Figure 29. Receiver probe for the Downhole RIM-IV system deployed for field-testing
The current design of all Downhole 3-D RIM systems includes Intrinsically Safe (I/S) and X/P components for in-mine and in-seam use. The I/S components include the antenna assemblies (TX and RX) and the battery packs. The X/P components are housed in X/P enclosures and include the fiber-optic adapters and the electronics (TX and RX). Downhole 3-D RIM uses ferrite-core loop antennas (hermetically sealed) and a central GUI housed in a non-X/P enclosure for surface use.
Phase Synchronization
The Downhole 3-D RIM design allows the TX and RX sections to be connected, via fiber optics, through to the display enclosure. This "hardwire link" allows the phase synchronization to be maintained at all times during use of the system. With synchronization, accurate measurements of signal phase shift can be made for all ray paths yielding higher signal-to-noise ratios, which is highly desirable.
The In-Mine 3-D RIM design allows for the same type of "hardwire link" to be used underground, providing the TX and RX sections can be connected via fiber optics. If this is not possible, then the cable can be replaced with a radio-link system (20 kHz) that does an effective job of maintaining phase coherence.
As indicated above, the RIM systems can be deployed in combination to provide the industry with different approaches for void detection and/or barrier pillar confirmation. The following illustrates different approaches.
RIM Method 1: Fence-Line Confirmation of Barrier Pillar
Figure 30 shows a mine plan map adjacent to a complex of abandoned mine workings. The area of solid coal between the old works and planned works is the barrier pillar.
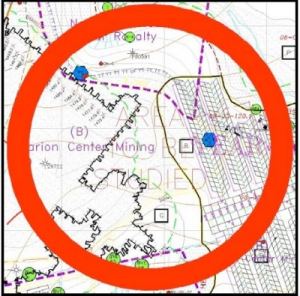
Figure 30. Map of a mine's target area. The old working are the outlined structure to the left, while the new working are shown as a projection of entry grids to the right
Mining engineers are considering all options to confirm the boundary of the old works and/or integrity of the pillar. These options include extensive drilling using vertical and horizontal drill methods. The goal of the drilling is to verify the existence of a solid pillar between the workings (old and new) and possibly to locate water-filled voids in the coal seam that indicate the location of an abandoned mine entry.
The primary method of barrier pillar confirmation is a fence line of boreholes. The fence line consists of a series of boreholes at varying separation distances (200 to 1000 ft) that form a boundary line between the old works and the mine plan development entries. The distance from the fence line to the planned mine works is equal to the minimum distance required for a barrier pillar in the area.
For a fence line of 2000 ft, only 4 to 10 boreholes would be needed using the RIM fenceline approach. Using surface drilling alone, as many as 100 vertical boreholes, spaced 20 ft apart, would be required to confirm the integrity of the barrier pillar along the same 2000-ft boundary line (assuming the old working entries are 20 ft wide). If the average depth of the coal seam along this line is 300 ft, the cost to rotary drill 100 vertical boreholes could exceed $300,000. The advantage of a RIM survey is that considerably fewer boreholes need to be drilled because the RIM systems can scan between holes, providing valuable information and eliminating the need for such a tight drilling pattern.
The primary technical objective of the RIM fence-line survey is to confirm whether there are water-filled (or air-filled) voids that might be the result of old works along the boundary line. The following outlines the survey plan for a fence-line survey.
Fence-Line Survey Plan
For a 2000-ft fence line in a 6-ft thick coal seam possessing moderate attenuation rates, the approach is to form a fence line through which old workings must not pass if the barrier pillar is to maintain a safe minimum width. The position of the fence line should be the required distance from the proposed location of the new mine workings. If RIM can establish the presence of a continuous coal seam between adjacent boreholes on the fence line, then the barrier pillar is of sufficient width and seam continuity. The locations of the fence line and the RIM survey boreholes for the example mine map are shown in Figure 31. Boreholes to the right of the fence line at locations 2 and 9 can be drilled to confirm that an old works entry has not circled behind the fence.
Drilling logs of the boreholes are a helpful component in the survey planning so that the depth and thickness of the coal seam for each borehole are known. It is also critical that surface conditions (topography, vegetation, etc.) allow the routing of fiber-optic cables between adjacent boreholes.
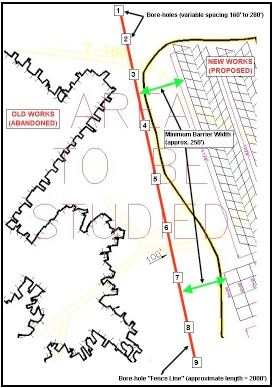
Figure 31. Diagram of RIM survey site showing the pillar fence line (red line) and the nine (9) proposed borehole locations (numbered boxes) relative to the old and new mine workings
Calibration Survey
The first objective of the survey is to establish the appropriate RIM antenna frequency to be utilized and the optimal resolution with which to sample the seam. This is termed the calibration survey.
The calibration survey involves deploying the RIM TX and RX probes into adjacent boreholes, lowering them to the center of the coal seam, and measuring radio-wave signal and phase for a variety of radio frequencies between 50 kHz and 500 kHz. It is desirable to use the highest frequency possible given the range requirements of the survey. Higher frequencies imply greater resolution, but the subsequent tradeoff is a decrease in the range of the instrumentation. In the target area, the calibration survey will be carried out between Boreholes 1 and 2 (minimum ray-path length), and again between Boreholes 7 and 8 (maximum ray-path length). The calibration survey will take four (4) to six (6) hours to complete.
Reconnaissance Survey
After the antenna frequency is selected, the objective is to take as many measurements as possible from the eight (8) borehole combinations in order to define the continuity of the seam; this is termed the reconnaissance survey. The reconnaissance survey involves deploying the RIM TX and RX probes into adjacent holes, lowering them to a point above the seam, and measuring radio-wave signal and phase.
Each hole-to-hole ray path, termed a "shot", can be performed relatively quickly once the instrumentation trailer and hoists are in place and the probes are in the boreholes. The RIM crew can perform four (4) to six (6) reconnaissance shots per day dependent on surface topography, obstructions, and borehole depth.
RIM Method 2: Tomographic Imaging of Mine Workings
A more involved method for using RIM in void-detection applications is the actual mapping of old workings using image-generation techniques and software. 3D-RIM is able to transmit signals through greater distances than previous RIM technologies, and the advanced system measures and detects signal phase shift. When coupled with advanced Full Wave Inversion Code (FWIC) software modeling packages, the phase-shift data produces greatly enhanced and higher-resolution tomographic and 3-D images.
High-resolution tomographic imaging of in-seam structures allows us to focus on an area and create detailed two-dimensional (2-D) and 3-D images of the survey area for the purpose of resolving the size, shape, and trend of specific geologic disturbances or structure, such as mine entries and barrier pillars. The resolution of these images is dependent on shot location and the density of the 2-D or 3-D ray paths through the area.
The primary objective of a RIM tomography survey would be to develop an image of existing old workings so that their location and extent are known for current mine planning. A sample map of old workings near a highwall outcrop is shown in Figure 32. This group of old works originated in highwall and is approximately 2000 ft long and 600 ft deep into the highwall. A RIM image of the workings (termed a "tomogram") could be generated at the highest resolution possible so that the shape, size, and location of the entries can be discerned within the image.
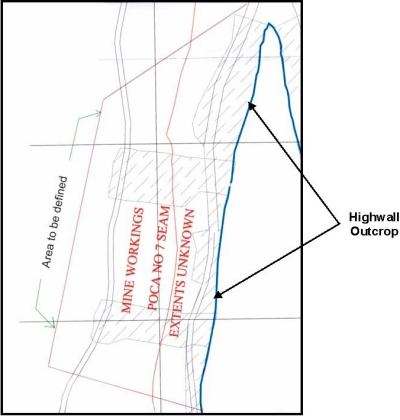
Figure 32. Map of the old workings originating from a highwall bench
For this application, a highwall outcrop of the coal seam will be used in conjunction with boreholes distributed throughout a 2200-ft by 800-ft area centered on the old works. Direct lines of radio frequency transmissions (ray paths) between the boreholes and the outcrop provides the RIM data necessary to define the workings. The boreholes are located at strategic locations, of variable separation, to provide optimal resolution when used with ray paths to the outcrop. The resulting image forms the approximate shape and location of the workings to accuracies within 50 ft, depending on borehole spacing.
RIM Tomography Survey Plan
The RIM tomography technique provides very detailed 2-D and 3-D images of the survey area based on mathematical reconstructions of many ray-path data sets.
The ray paths required could be generated using a plan of 12 boreholes and 11 outcrop locations. The boreholes are distributed through the old works in two rows on roughly 400-ft centers. The outcrop stations are at coal seam level within the highwall pit on 200-ft centers. Using these 23 stations for radio-wave transmission and reception, there could be 81 possible ray paths to use for tomographic processing and imaging. A diagram showing the possible borehole and outcrop locations is shown in Figure 33.
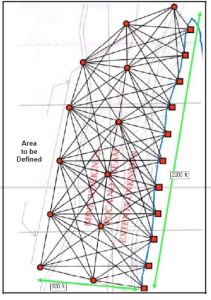
Figure 33. Map of a recommended survey plan at an old-workings site
The resulting tomographic image (tomogram) would consist of a plan view contour map showing the shape and location of the old workings and their entries. The locations, relative to the boreholes, could then be projected to existing surface maps and mine plans to evaluate their proximity to current or proposed workings. The number and location of boreholes can be modified based on final logistics and the required scope and scale of the imaging project.
The time required to perform the tomography survey is dependent on the number of borehole combinations used. The RIM crew can perform twenty (20) to thirty (30) tomography shots per day dependent on surface topography, obstructions, and borehole depth, therefore, the 81 ray paths proposed would take three (3) days to complete.
RIM Tomography Survey Results
For example, a dike system penetrating a coal seam could be effectively imaged by straddling it with a borehole grid for tomographic surveying, as shown in Figure 34. The sample grid, comprised of nine (9) boreholes, would have a maximum hole-to-hole separation determined during calibration. As with the reconnaissance survey, any combination of ray paths can be adopted based on the target size, practical boring pattern, and desired resolution.
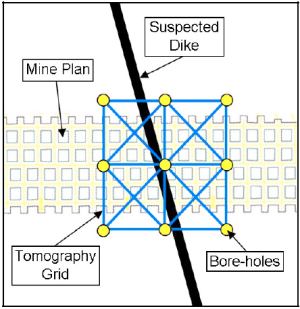
Figure 34. Location and borehole pattern of tomography grid over a suspected dike
A sample tomography survey image through the dike, at 1000-ft borehole separations, is shown in Figure 35. In this example, the attenuation rate of the RIM signal passing through the dike is 6 dB/100 ft higher than that through continuous coal. The location of the dike is quite evident on the plot and it is possible to estimate the dike shape, trend, and thickness. This image is at the top of the coal seam.
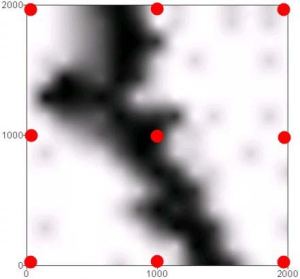
Figure 35. Two-dimensional images for a 2000-ft tomography survey grid over a dike at 1000-ft hole-to-hole separation