

Archived: Interstate Technical Group on Abandoned Underground Mines
An Interactive Forum
Locating and Characterizing Abandoned Mines Using Microgravity
by Richard C. Benson1, Ronald D. Kaufmann1, Lynn Yuhr1, Richard Hopkins2
Abstract
Surface geophysical methods can be an important part of any site characterization effort. Microgravity is a geophysical method that is increasingly being used for environmental and geotechnical investigations. Microgravity measurements respond to changes in subsurface density, and are a non-invasive way to effectively identify and characterize subsurface voids, including abandoned mines. When integrated with other geologic information and geophysical datasets, a microgravity survey will provide a more complete and accurate assessment of subsurface voids than borings alone. We demonstrate in a case history how microgravity measurements were an effective first step in characterizing a collapse zone in an abandoned mine.
Introduction
A microgravity survey is a non-invasive geophysical method for the delineation of subsurface density variations. A microgravity survey consists of making sensitive gravity measurements at discrete points on the ground surface. Spatial changes in gravity are referred to as gravity anomalies and are directly related to subsurface features with a measurable density contrast (Telford, et al., 1976, Seigel, 1995).
The microgravity method has been used for decades in oil and mineral exploration. Advances in microgravity equipment have improved the accuracy and efficiency of obtaining microgravity data and have extended the application of the method to geotechnical and environmental site characterizations (Kaufmann and Doll, 1998). Detection and delineation of subsurface cavities (karst conditions) are the most common applications of microgravimetry. Microgravimetry comes closest of all the geophysical methods to allowing a positive statement regarding the presence or absence of subsurface cavities at a site (Butler, 1980).
There is a reasonable analogy between the process of locating and characterizing cavities and abandoned mines. In both cases, microgravity data will respond to features with density contrasts, whether they are natural (as with a karst conduit) or man-made (as with a mine). This paper presents an introduction to the microgravity method, which can be effectively used as part of a site characterization investigation for locating and characterizing abandoned mines.
Strategy
Site characterization is the process of understanding the three dimensional geologic framework, engineering and hydrologic properties, and contaminant distribution of a site. It is the cornerstone of all geotechnical and environmental projects. The process is quite similar for characterizing man-made subsurface features such as abandoned mines. What makes site characterization so difficult in practice is the always-variable geologic regime and often culturally impacted settings in which we work. This is especially true for abandoned mine sites, which can have an extreme level of both geologic and man-made uncertainties.
In the simplest terms, the strategy for any geotechnical or environmental site characterization effort is a two-step process that requires a diverse, yet strongly integrated approach. First, it is essential to obtain appropriate, adequate (spatial and temporal) and accurate data. Second, we must interpret and integrate a wide range of data into a reasonably accurate conceptual model of site conditions.
Numerous considerations go into designing a site characterization effort to ensure that appropriate and adequate data are obtained. Geophysical methods often play a vital part in the subsurface investigation. Geophysical methods are typically non-invasive and represent a cost-effective way of obtaining a much more complete characterization than traditional borings and sampling can provide. However, there is no single universally applicable geophysical method or group of methods that can be used to meet all project needs. While a given method may be successful in one situation it may not be in another. There is no silver bullet and there never will be.
This paper focuses on the microgravity method, which can be a useful tool for characterizing abandoned mine sites. It must, however, be part of a site characterization that integrates data from multiple methods and sources. The more data that are available for a site, the less we rely on assumption and opinions. When multiple methods of measurements agree, we have greater level of confidence in our understanding of site conditions.
Methodology
Gravity measurements are based upon Newton's Law of gravitation:
![]()
where Fg is the force of gravity;
G is the gravitational constant;
M1 and M2 are the two masses involved; and
r is the distance the two masses are separated.
From this, the acceleration of gravity g is:
![]()
The unit of gravitational acceleration is the Gal after Galileo (1 Gal = 10-2m/s2). The Earth's average gravity is approximately 980 Gals. The unit commonly used in regional gravity surveys is the milliGal (1 mGal = 1/1000 Gals). Since the targets of interest for engineering or environmental surveys typically produce anomalies much smaller than one milliGal, gravity surveys for environmental and engineering applications require measurements with a resolution of a microGal (1 µGal = 0.001 mGals or one part per billion of the Earth's gravity). Since measurements are made at the microGal level, the term "microgravity survey" is used to differentiate it from regional gravity surveys.
Equipment
Portable gravimeters are extremely sensitive instruments that measure relative differences in gravity from station to station (Figure 1). Gravimeters measure changes in the vertical component of gravity by balancing gravitational forces with a spring and mass system. A change in gravitational force results in a change of the length of the spring. The position of the mass is sensed and the amount of external force required to bring it back to a standard position is a measure of the gravity value. Modern gravimeters have a sensitivity of 1 µGal with a typical noise level less than ±10 µGals under normal field conditions.
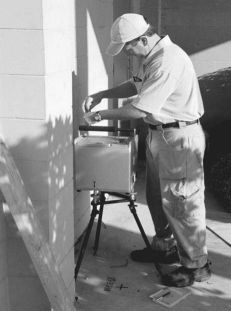
Figure 1. Gravity measurement with a Scintrex CG-3M gravimeter
Gravity Anomalies
Gravity anomalies are variations in the Earth's gravitational field, which are directly related to density variations of the subsurface geology and/or man-made structures. Gravity anomalies will vary in size and spatial extent depending on the density contrast, size, and depth of the subsurface feature. Laterally uniform subsurface conditions will not produce gravity anomalies.
Density is a function of the type and distribution of materials that make up the host rock and of the type and amount of fluids found within the pore space. The density contrast between the host rock and an abandoned mine depends on the condition of the mine itself (i.e. air-filled, water-filled, rock-filled, etc.). Table 1 shows average density values for various rocks and materials that may fill a mine. Note that there is typically a large density contrast between competent rocks and unconsolidated fill materials.
| Material | Average Density (g/cc) |
|---|---|
| Graywacke | 2.65 |
| Schist | 2.64 |
| Limestone | 2.55 |
| Bauxite | 2.45 |
| Shale | 2.40 |
| Sandstone | 2.35 |
| Gypsum | 2.35 |
| Rock Salt | 2.22 |
| Sand | 2.00 |
| Gravel | 2.00 |
| Alluvium | 1.98 |
| Loess | 1.64 |
| Anthracite | 1.50 |
| Soft Coal | 1.32 |
| Water | 1.00 |
| Air | 0.00 |
Table 1. Average density values of rocks and fill materials (after Telford et al., 1976)
Figure 2 is an example of microgravity anomalies due to a simple model of an air-filled, 20-foot diameter cylinder at three different depths. If the cylinder were filled with water, the anomaly magnitudes would decrease by a factor of 0.6. In reality, a mine may extend out laterally much more than a cylinder, and the associated gravity anomaly would be much larger than shown in this example. The model illustrates some basic concepts:
- Microgravity anomalies ≥10 µGals should be routinely detectable (Butler, 1980);
- Shallower features of the same size will produce a greater magnitude anomaly with a narrower width; and
- Deeper features of the same size will produce a smaller magnitude anomaly with a broader width.
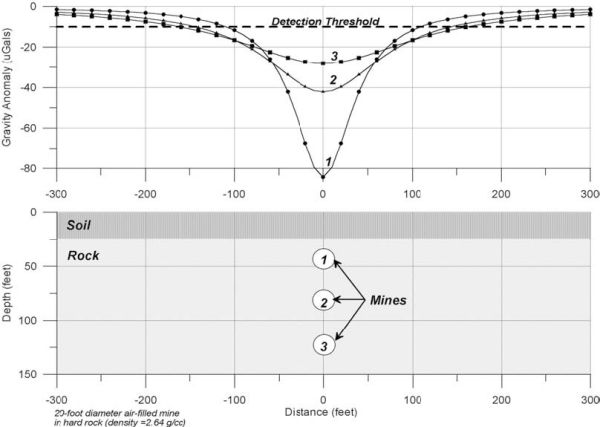
Figure 2. Simple gravity model of mines at three different depths
Survey Parameters
Prior to carrying out a microgravity survey, the parameters for the survey should be carefully planned so that adequate data (spatial coverage and orientation) are obtained to detect the feature of interest. A forward model should be developed to calculate the expected magnitude and width of an anomaly (as in Figure 2).
Microgravity data are obtained at stations along a survey line or within a survey grid. Optimally, the survey lines should extend from the area of interest into background conditions. Survey line lengths and station spacing can be planned from the modeling. Depending on the depth of the feature, a station spacing of 10 to 50 feet is normally used for environmental and geotechnical applications. Microgravity data are extremely sensitive to elevation, and the station elevations must be obtained with a precision of 0.01 feet for microGal level surveys.
Data Analysis
The raw data are processed to remove instrument drift and external gravitational effects such as tides, elevation, latitude, and nearby topography. The resulting data are known as Bouguer gravity values and are directly related to lateral density variations in the subsurface. The data may be plotted as profile lines or contour maps depending on the applications. While the gravity technique measures the density variations in the subsurface, it is the interpreter who, based on knowledge of the local conditions or other data, must interpret the data. Interpretation can simply be the location of a gravity anomaly or can require extensive modeling to support interpretation of size and depth and calculations of mass deficit.
Limitations
As with any geophysical technique, there are limitations to the microgravity method. These include:
- Microgravity data will only detect features with a density contrast within the host medium.
- Localized features at depth can produce the same response as broader, shallower features. This ambiguity must be resolved by other geologic information or measurements.
- Deep features must be large enough to produce a gravitational response above the detection threshold.
- Noise can occur in the data due to natural sources (ground motion from distant earthquakes, waves impacting the shoreline, and wind) and man-made sources (vibrations from vehicles, railroads, construction equipment, etc.).
- Localized topography can introduce noise in the data if not accounted for by detailed terrain corrections. Terrain corrections that are not applied correctly can produce false anomalies that are not due to subsurface features.
Case History: London Mine, Isabella, Tennessee
The London Mine is an abandoned copper mine in the hills of southeastern Tennessee. The mine closed in the late 1920's and currently contains surface structures that are heavily decayed by the pyrite-rich mine tailings (Figure 3). Dangerous open shafts and pits are common in this area, which is closed to the public. One large collapse, with subsidence to depths of 100 feet or more, has occurred since the mine closed (Figure 4). Some portions of the collapse were filled with unconsolidated material providing a surface indication of the collapse location, however the exact location of the collapse area, the thickness of the fill and the presence of voids within the fill or surrounding rock were not known.
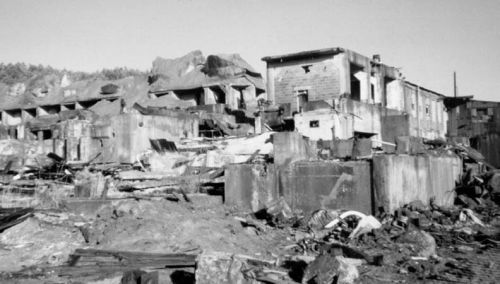
Figure 3. Surface of the London Mine in 1998
Objective
A site characterization was carried out in and around the known collapse area prior to demolition of structures at this location (Technos, 1998; Marrich, 1998). The main objective of the characterization was to determine if subsurface voids were present that would pose a safety risk for demolition crews working on the surface. Microgravity was used as the primary geophysical method to meet the project objectives.
Geology
The London Mine is located in the Blue Ridge physiographic province of southeastern Tennessee. The mine is in massive sulfide deposits occurring within highly folded and metamorphosed clastic sediments. The massive sulfide deposits are bounded by interbedded metagraywackes and mica schists with a steep (50 to 80 degree) dip (Slater, 1982). Copper deposits were mined at depths of approximately 100 feet below the surface using both subsurface and open-pit mining techniques.
Microgravity Survey
Microgravity data were acquired along eight survey lines with a station spacing of 10 feet. The survey lines were positioned to provide dense data coverage in and around the approximate location of the collapse area. Access was limited in many locations due to surface structures and topography (Figures 3 and 4). Localized topographic variations, including a large rock outcrop, posed additional challenges for the microgravity survey because of their gravitational effects at nearby gravity stations.
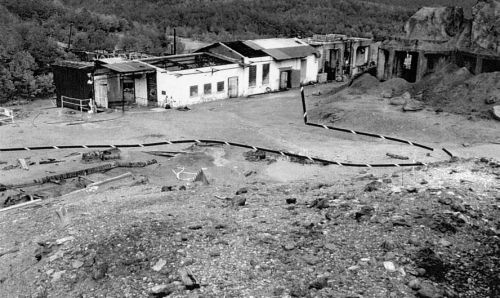
Figure 4. Photo showing surface of collapse area
Data were acquired at a total of 257 stations using a Scintrex CG-3M gravimeter. Twenty-one percent of the stations were measured more than once at different times during the survey to provide a measure of quality control. The multiple readings show an average deviation of ±6 µGals, which represents the noise threshold for the survey. The data were reduced to Bouguer values using standard formulas (Telford et al., 1976) and corrected for the effects of nearby terrain variations.
Results
Areas of low gravity anomalies (100 to 175 µGals) were identified in five of the survey lines. The anomalous areas are centered within the collapse area and are aligned with the strike of the mine. An example of the data along one of the profile lines is shown in Figure 5a.
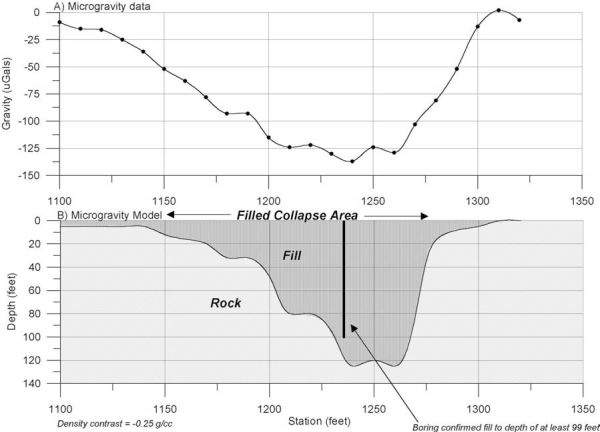
Figure 5. Microgravity data (a) and model (b) showing anomalous area
Based on the microgravity data alone, it is not possible to provide a unique interpretation of the gravity anomalies. Two possible scenarios were analyzed as possible causes of the anomalies: water-filled voids (mine shafts) and collapse areas filled with unconsolidated material. Both scenarios and combinations of them are realistic possibilities for the site, but pose different levels of safety hazards. Therefore, the locations of these anomalies guided the placement of borings to identify the exact cause of the anomalies.
Vertical and angle borings were drilled in anomalous and non-anomalous areas of the site. The information from the borings was used to constrain the microgravity models to provide an accurate model of the subsurface. Figure 5b shows a model of the gravity data constrained by the results of a boring. The boring was drilled to a depth of 99 feet and encountered unconsolidated fill material through its entire length. The boring verified that the gravity anomaly is due to the density contrast between the fill material and surrounding host rock and not due to large air or water-filled voids.
Conclusions
The microgravity data successfully guided the boring placement in anomalous areas that had the potential of containing voids. These areas were checked with the borings and it was determined that the cause of the anomalies was lower-density fill material. Based on the results of the microgravity data and subsequent boring information, the surveyed area does not contain large voids that would be a safety concern during demolition activities.
This case history demonstrates how microgravity can be used as an effective first step in an abandoned mine characterization. The microgravity data allow a much more thorough characterization of the subsurface than random borings alone could have provided. It is imperative, however, that the microgravity data be integrated with other data sources to develop an accurate subsurface characterization.
References
Butler, D. K, 1980, Microgravimetric techniques for geotechnical applications, Miscellaneous Paper GL-80-13: U.S. Army Engineer Waterways Experiment Station, Vicksburg, MS, 121 pp.
Kaufmann, R. D., and Doll, W. E., 1998, Gravity meter comparison and circular error, Journal of Environmental and Engineering Geophysics, 2, 165-171.
Marrich, Inc., 1998, Geotechnical Report: Microgravity survey, London Mine, Isabella, Tennessee, Job # 98065, April, 1998.
Seigel, H. O., 1995, High precision gravity survey guide, Scintrex Ltd., 120p.
Slater, R., 1982, Massive sulfide deposits of the Ducktown Mining District, Tennessee, Exploration for Metallic Resources Southeast Conference, Athens, Georgia, Sept. 28-29, 1982.
Technos, Inc., 1998, Final Report: Microgravity survey at the London Mine, Isabella, Tennessee, Technos Project No. 98-118, April 15, 1998.
Telford, W. M., Geldart, L. P., Sheriff, R. E., and Keys, D. A., 1976, Applied Geophysics, Cambridge University Press, 860p.
1Technos, Inc., 10403 NW 31stTerrace, Miami, FL 33172
2MARRICH, Inc. P.O. Box 9179, Knoxville, TN 37940
©Technos, Inc. Used with permission