

Final Report Phase 1 - Temporary Wet-weather Pavement Markings for Mork Zones
APPENDIX A-3: HUMAN FACTORS FIELD EVALUATION AT TTI
Human Factors Evaluation of Prototype all-weather pavement markings under dry, wet and rain conditions
The objective of this study was to evaluate the nighttime visibility of three prototype paint and dual-optics drop-on element-based s to determine their performance especially for work-zone applications. The nighttime visibility of the prototype pavement markings was evaluated in a dynamic driving condition under dry, wet, and raining conditions. Two commercially available pavement marking systems were also evaluated as benchmarks.
Experimental Design
The experiment was designed to simulate the nighttime driving task in a roadway work zone, and to assess the nighttime visibility of prototype all-weather pavement markings under dry, wet, and continuous rain conditions. Participants drove an experimental vehicle with low-beam headlights in a closed-course environment. The driving course included several passes through a rain-tunnel located in a Texas Transportation Institute (TTI) facility, where 0.5 inch/hour rain was generated. The participants were asked to identify the earliest point where they could detect a simulated work zone taper (and the direction of the taper). A full-factorial within-subjects design with repetitions was administered, where each participant evaluated all conditions with repetition.
Measure of Effectiveness (Dependent Variable)
The measure of effectiveness (MOE) used for this study built off of previous research. (1,3-6) Knowing the limitation of static evaluations, a review of dynamic evaluations was completed. Beginning and end detection tasks were considered as well as the detection of isolated skip lines. In an effort to create a work zone related visual task, this research used a MOE defined by the detection distance of a simulated work zone taper delineated exclusively by pavement markings.
Longitudinal pavement markings of varying lengths (150 to 250 ft) were installed along tangent sections of roadway. Both ends of each section of longitudinal pavement marking ended in a Y configuration with tapers to the left and right (see Figure 11). During the study only the tapers at the end of each pavement marking were shown (depending on the direction of travel) and usually only one taper was shown. However, as a way to prevent guessing, in some cases, both tapers were shown or no taper was shown. Therefore, the possible responses were: Right, Left, Both (both tapers shown), or None (both tapers were covered). The latter two responses were included solely to avoid a heuristic response. The measure of effectiveness was the distance at which a driver could correctly identify the direction of the taper. All participants viewed three repetitions of each test marking in the continuous-rainfall condition, and two repetitions of each marking treatment under the wet-recovery and dry conditions.
To form each of the tapers, the Y-configuration at the ends of each pavement marking section included 20 ft of additional pavement marking material with an angle of approximately seven degrees, resulting in a 2.5 ft offset at the end of the 20 ft taper section. Changing the configuration required temporarily covering the unused extensions with black line mask tape as shown in Figure 12. To further approximate the nighttime visual complexity in a real work zone, retroreflective delineator cones were placed at 100 foot intervals in a staggered pattern to the left and right of the travel lane as shown in Figure 12.
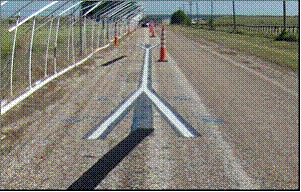
Figure 11. Pavement marking section as installed.
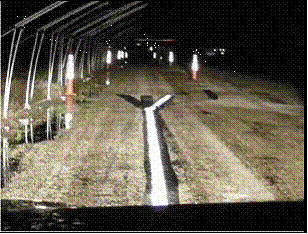
Figure 12. Pavement marking viewed at night with unused tapers masked.
Independent Variables
The key independent variables investigated in the study were the taper detection distance, the environment conditions (3 levels- dry, recovery, continuous rain), and marking types (5 levels- three prototype markings and two benchmark markings). Other variables were held constant as described below.
- Pavement marking position - all of the pavement markings used for the analysis were positioned in the center of the travel lane. This center position allowed detection distance to be collected in both directions of travel as the illuminance on the markings would be the same.
- Seat position - all the detection distances were recorded with the research test subjects driving the test vehicle and therefore from the driver's seat position.
- Ambient lighting - the experiments were conducted at night at the Texas A&M University (TAMU) Riverside Campus, which is a dark, rural environment with little ambient lighting from buildings or nearby communities.
- Recovery time - within 45-seconds and 90-seconds after cessation of rain
- Rain rate - approximately 0.5 inch/hour
- Experimental vehicle - 2004 Ford Taurus
- Headlight setting: Only-low beam headlights were used
Pavement Marking Types
Five different pavement marking treatments were tested. Three prototype all-weather marking systems were tested along with two commercial marking systems (Table 8). The prototype markings featured dual-optics elements in addition to conventional glass beads on waterborne paint. Two commercial markings, which served as benchmarks, were a standard pavement marking treatment that consisted of waterborne paint with AASHTO M247 Type 1 beads (7), and a removable preformed wet reflective structured tape (3M 780 series). The markings were all white 4-inch-wide continuous lines. The standard retroreflectances of the test markings were obtained in-situ. Coefficient of reflected luminance (RL) at the standard CEN 30-m geometry was measured under dry, rain and wet recovery conditions using a calibrated external beam retroreflectometer (LTL-X from Delta Instruments). Determination of the standardized retroreflective efficiency of the markings under dry (RL-dry) and wet recovery conditions (RL-wet) were conducted according to ASTM E1710 (8) and ASTM E2177 (9), respectively. Retroreflective efficiency under actively falling rain conditions (RL-rain) was measured according to EN1436 (10) using a rain simulator giving artificial rainfall, without mist or fog, at an average intensity of 0.8 inch/hour.
| Marking | Binder | Wet Film thickness | Optics |
|---|---|---|---|
| Prototype A | high-build waterborne paint | 20 | 3M medium size high refractive index dual-optics drop-on elements (low drop rate; 4g/lineal ft) in combination with MODOT Type P Drop-on 1.5 index Glass Beads (12g/lineal ft) |
| Prototype B | High-build waterborne paint | 20 | 3M medium size high refractive index dual-optics drop-on elements (high drop rate; 8g/lineal ft) in combination with MODOT Type P Drop-on 1.5 Glass Beads (12g/lineal ft) |
| Prototype C | high-build waterborne paint | 25 | 3M large size high refractive index dual-optics drop-on elements (high drop rate; 8g/lineal ft) in combination AASHTO M247 Type 1 Drop-on 1.5 index Glass Beads (12g/lineal ft) |
| Benchmark 1 | High-build waterborne paint | 15 mil | AASHTO M247 Type 1 Drop-on 1.5 index Glass Beads |
| Benchmark 2 | Preformed structured tape | NA | Specially designed optics to provide high retroreflective efficiency in dry and wet conditions (3Mtm Stamarktm Wet Reflective Removable Tape Series 780) |
Participants
Thirteen men and seventeen women participated in the study. All study participants but one (55 years of age) were over 60 years of age. Ages ranged from 55 to 80, with an average age of 69. All participants possessed a valid driver's license. Participants were met at the entrance to Texas A&M University (TAMU) Riverside campus and taken to an office for a prescreening. During the prescreening, they completed an Informed Consent form and a demographics questionnaire, then underwent the Snellen Eye Chart test for visual acuity, the Functional Acuity Contrast Test (F.A.C.T.), and the Ishihara Color Test. Twenty-eight participants were found to have Snellen visual acuity scores of 20/25 or better; twenty-six scored 20/25 or better on the F.A.C.T. test. One participant's Snellen score indicated 20/30 vision, but the F.A.C.T. score was 20/20; three participants scored 20/30 on the F.A.C.T. test but had Snellen acuity scores of 20/25 or 20/20. One participant had 20/40 vision, as measured by both the Snellen and F.A.C.T. tests. The Ishihara test confirmed that all participants had normal color vision.
Experimental Equipment and Facilities
A 2004 TTI Ford Taurus with HB5-halogen headlamps was used as the test vehicle (see Figure 13). All measured data were collected with the participant driving approximately 30 mph. The vehicle was equipped with the following: (1) a special control switch on the passenger side that allowed the researcher to control the windshield wipers, and (2) a distance measuring instrument (DMI) for recording detection distances of the pavement marking samples (see Figure 14). During the test runs, the windshield wipers were set to high during both the rain and the wet recovery conditions. The researcher sitting in the passenger seat recorded the DMI readings and used a used a radio to communicate with field staff.
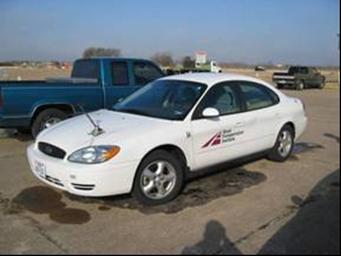
Figure 13. Ford Taurus used as study vehicle
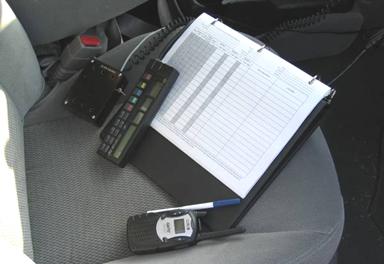
a) DMI, Data Sheet, and Radio
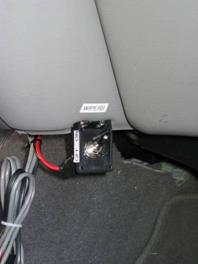
b) Wiper Switch
Figure 14. Test equipment
To produce the dry, wet, and continuous-rainfall conditions, each pavement marking system was installed at two locations within the TAMU Riverside Campus. One set of markings was installed on Avenues A and B for evaluation under dry conditions. The second set of markings was installed on the TTI Rain Range, which is fitted with rain nozzles cantilevered over the roadway. The rain range located on Bryan Road was used to generate the artificial rain and wet conditions simulating immediately after a rain event (also known as wet-recovery condition). A driving route was selected to minimize the probability of a heuristic (i.e., learning) effect on detection distances.
Figure 15 illustrates a section of the rain range showing the equipment used to produce artificial rain. For the wet recovery condition, the system was turned on for at least one minute to fully wet the roadway, then turned off. The study participants were instructed to enter the rain tunnel approximately one minute after the rain was turned off.
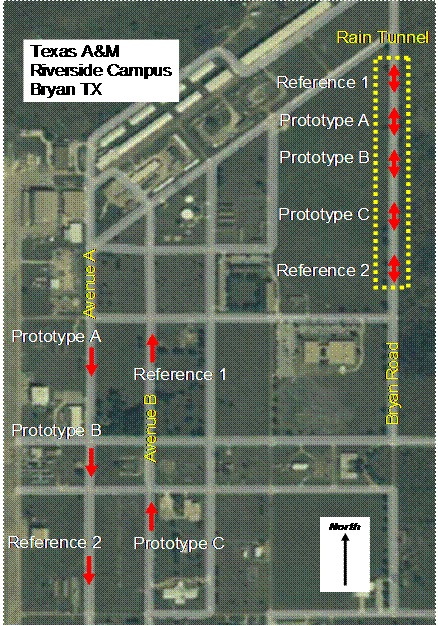
Figure 15. Experimental test course layout.
The rainfall area in the TTI rain tunnel is approximately 14 feet in width, or slightly over one standard driving lane wide. Pavement markings were installed in the middle of the rainfall lane to allow test subjects to drive the rain tunnel and view the test markings from both directions (this keeps the amount of headlamps illumination consistent in both direction). For consistency, the markings were also placed in the center of the driving lane on the "dry" test sections located on Avenues A and B.
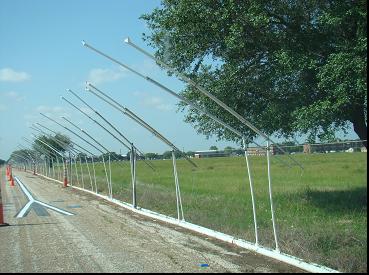
Figure 16. Close up view of sprinkler system used to produce artificial rain on the TTI Rain Tunnel, viewed from north end of Bryan Road.
Study Procedure
Two to three study participants were run per night. The study required 45 to 60 minutes to complete. The participants were paid $40.00 for completing the study.
Participants were told they would be evaluating pavement markings prior to the driving task, and given brief instructions regarding the study procedure. Each participant was then led outside to the test vehicle where they were allowed to adjust the driver's seat, mirrors and acquaint themselves with the vehicle. After the participant was comfortable they drove the vehicle to a test section to allow the participant to become familiar with the experimental protocol. Although the participants had reasonably good vision, failure in any one of the vision tests would not have disqualified them from participating. The vision tests were conducted to identify any vision defects for consideration in the data analysis.
Once a participant was familiar with the test vehicle and the experimental procedure, they were instructed to drive the experimental route at a speed of approximately 30 mph. The research team followed the general guidelines listed below:
- Data collection began after astronomical twilight.
- Each time the test vehicle exited the rain tunnel, a field crew reconfigured the tapers in accordance with the preset experimental plan prior to the re-entry into the rain tunnel.
- The order of environmental conditions was counterbalanced between participants. .
- When viewing a test segment, the participant was instructed to state aloud as soon as they could identify whether there was a taper to the left, to the right, in both directions, or straight. The researcher recorded the DMI distance value at the time of the participant's response.
- Several reference points were set throughout the course to stop the vehicle and reset the DMI. The distance to a test treatment section from its associated reference point was used to calculate taper detection distances from the observational DMI data. These reset points also provided opportunities to answer participant questions, to break up the testing to minimize heuristic responses as well as minimize any compounding of DMI measurement errors.
- The research protocol required testing to be suspended in the event of natural rain or high winds.
Data Analysis
Data were reduced into an Excel spreadsheet for further analysis. DMI distances recorded on the datasheets were manually entered along with the demographic information for each study participant and the marking layouts for each test section. The taper detection distances were calculated from the DMI recorded distances and the distance from the reference DMI reset point to the appropriate test marking.
Table 9 contains the descriptive statistics for all five pavement marking treatments grouped by the three environmental conditions (i.e., dry, wet-recovery, and continuous-rainfall). The sample sizes within each condition are the same across all marking treatments. Some data were lost due to equipment failures. However, relative to the number of missed responses (i.e., taper not reported) by study participants, the number of missing data points was negligible. It should be noted that the sample sizes for Benchmark 1 (conventional paint and beads) in the wet recovery and rain conditions are low because a significant portion of the study participants failed to detect the tapers constructed with this pavement marking system. A few missed responses were likely due to simple human error on the part of the study participant or the researcher, and with the exception of Benchmark 1, no driver missed any individual marking more than once. The Benchmark 1 treatment in the rain range was notable as the treatment to which study participants most often failed to respond (i.e., they did not see the marking at all).
If a participant did not provide a response to a marking, the researcher in the vehicle noted the missed response but did not inform the participant of the missed marking, since (to avoid biasing the responses) participants were not informed of the number of markings to expect on each run. Additionally, some participants identified the taper direction for a marking belatedly on one or more viewings, realizing that they had seen the marking only after the vehicle had already passed it. These late responses resulted in "detection distances" that were negative numbers. In the data analysis, the research team counted these belated responses as additional missed responses, since a driver detecting a real-world roadway curvature or obstacle after the vehicle has reached/passed it would be in as much danger of an accident as if he or she did not detect it at all. Table 10 summarizes the data points that were categorized as missed markings in the data analysis. The Benchmark 1 treatment was missed (not seen or identified late) 22 times in the wet recovery condition, and 54 times in the rain condition.
| Environmental Condition | Marking System | Sample Size | Detection Distance (ft) | |||
|---|---|---|---|---|---|---|
| Minimum | Mean | St dev of Mean | Maximum | |||
| Dry | A | 57 |
102 |
272.7 |
64.0 |
419 |
| B | 57 |
86 |
199.1 |
51.9 |
341 | |
| C | 60 |
79 |
221.0 |
56.6 |
325 | |
| Benchmark 1 (conventional paint and beads) | 60 |
58 |
199.8 |
46.7 |
279 | |
| Benchmark 2 (wet-weather tape) | 57 |
63 |
285.0 |
73.3 |
408 | |
| Wet Recovery | A | 60 |
58 |
170.4 |
56.3 |
276 |
| B | 60 |
40 |
161.3 |
57.3 |
304 | |
| C | 58 |
51 |
156.2 |
47.9 |
262 | |
| Benchmark 1 | 37 |
8 |
55.5 |
32.4 |
130 | |
| Benchmark 2 | 60 |
43 |
181.9 |
55.5 |
346 | |
| Rain | A | 111 |
8 |
134.4 |
50.5 |
257 |
| B | 114 |
15 |
135.0 |
49.9 |
299 | |
| C | 113 |
45 |
131.2 |
42.4 |
256 | |
| Benchmark 1 | 58 |
1 |
34.7 |
20.7 |
79 | |
| Benchmark 2 | 114 |
10 |
147.0 |
45.2 |
289 | |
| Environmental Condition | Marking System | No Response | Belated Response (after vehicle had passed marking) |
|---|---|---|---|
| Wet Recovery | C | 1 |
1 |
| Benchmark 1 | 15 |
7 |
|
| Rain | A | 2 |
1 |
| C | - |
1 |
|
| Benchmark 1 | 38 |
16 |
Figure 17 shows the average taper detection distances for each pavement marking system under the three environmental conditions. Error bars represent ±1 standard deviation from the mean. The results of a one-way ANOVA are presented in Table 11 in terms of Tukey's HSD (Honestly Significant Differences) Test. Overall, the dry conditions provided the longest detection distances, followed by wet recovery, then continuous rain conditions. Under the dry condition, the performance of prototypes B, C and Benchmark 1 were not statistically different from each other. Prototype A and Benchmark 2 (wet-weather tape) were also not statistically different from each other under dry conditions and both were different from the other two prototypes and Benchmark 1. The nighttime visibility properties of prototypes A, B, and C were not statistically different from one another or were they different from the Benchmark 2 under either the wet recovery or rain conditions. The detection distance for Benchmark 1 was significantly shorter in both the wet and rain conditions than the other marking systems evaluated.
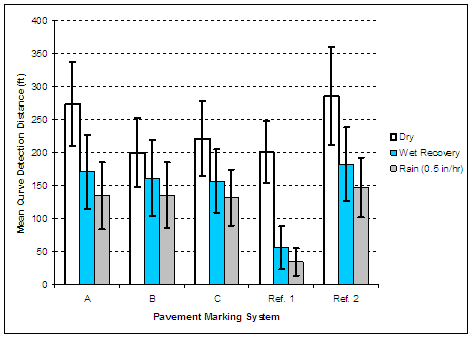
Figure 17. Mean Taper Detection Distance as a function of Pavement Marking System and Environmental Condition.
| Condition | Marking Treatment | Sample Size | Detection Distance (ft) | |
|---|---|---|---|---|
| Group 1 | Group 2 | |||
| Dry | B | 57 |
199 |
|
| Benchmark 1 | 60 |
200 |
||
| C | 60 |
221 |
||
| A | 57 |
273 | ||
| Benchmark 2 | 57 |
285 | ||
| Wet Recovery | Benchmark 1 | 37 |
56 |
|
| C | 58 |
156 | ||
| B | 60 |
161 | ||
| A | 60 |
170 | ||
| Benchmark 2 | 60 |
182 | ||
| Rain | Benchmark 1 | 58 |
35 |
|
| C | 113 |
131 | ||
| A | 111 |
134 | ||
| B | 114 |
135 | ||
| Benchmark 2 | 114 |
147 | ||
The retroreflective efficiency of each marking was measured using standard test protocols corresponding to the appropriate environmental conditions under which the marking were viewed - dry, wet recovery, and continuous rain ( Table 12). The retroreflectivity was measured periodically throughout data collection to assess any changes that might bias the results. Data presented in Table 12 show that the retroreflectivity of the markings was stable during the study.
| Weather Condition | Statistic | Prototypes | Benchmarks | |||
|---|---|---|---|---|---|---|
| A | B | C | 1 | 2 | ||
| Dry markings (per ASTM E1710) |
Avg | 520 |
547 |
532 |
284 |
866 |
| Stdev | 67 |
44 |
66 |
26 |
155 | |
| (average change from 4/28/2008 to 5/20/2008) | 0% |
-4% |
4% |
5% |
3% | |
| Wet markings (per ASTM E2177a; 45 sec recovery) | Avg | 628 |
545 |
407 |
13 |
611 |
| Stdev | 178 |
139 |
70 |
11 |
69 | |
| Rain markings (per EN 1436b; 5 min rain @ 0.8 in/hr)> | Avg | 520 |
433 |
328 |
17 |
575 |
| Stdev | 198 |
94 |
82 |
10 |
78 | |
a ASTM E2176 requires "..wet the area of the marking to be measured and the adjacent surrounding area (road surface and marking) for 30 s...Measure the coefficient of retroreflected luminance, RL, of the wetted marking 45 ± 5 s after completion of spraying.."
b EN 1436 requires "..artificial rainfall, without mist or fog, at an average intensity of (20 ± 2) mm/h [0.79 ± .08 in/hr] ...RL in condition of rain shall be made after 5 min of continuous rain...while rain is falling."
Findings
The findings of the visibility study of the three prototype all-weather work zone pavement markings are summarized below.
- On average, the removable wet-reflective tape provided the longest detection distances (Benchmark 2), and the paint with conventional glass-bead optics (Benchmark 1) provided the shortest detection distances.
- In all three environmental conditions, Benchmark 2 and Prototype A performed the best, in other words had the longest detection distances which were statistically equivalent to one another.
- In both the continuous rain and wet-recovery conditions, all three Prototypes and Benchmark 2 had statistically the same detection distances which were statistically longer than Benchmark 1 (conventional glass-bead optics).
- In the dry condition, Benchmark 2 and Prototype A had statistically the same detection distances, which were statistically longer than Prototypes B and C and Benchmark 1.
- Markings with dual-optics designed for wet weather conditions are less impacted by rain than conventional glass bead markings.
- Under the wet-recovery condition, the all-weather paint prototypes (and Benchmark 2 - the tape designed for wet weather conditions) sustained average detection distances at 60-80 percent of their dry values, while Benchmark 1 (a conventional glass bead marking) provided only 28 percent of its dry detection distances.
- Under the continuous rainfall condition, the all-weather paint prototypes (and Benchmark 2) sustained average detection distances at 50-70 percent of their dry detection distances, as opposed to 17 percent for Benchmark 1.
- Tapers marked with conventional markings were missed (not detected) by nearly half of study participants in the rain and by nearly one-third under wet-recovery conditions. The tapers marked with the experimental all-weather paint markings or wet-reflective tape markings were visible to all the drivers under all conditions.
References
- Horberry, Tim, Anderson, Janet and Regan, Michael A, The possible safety benefits of enhanced road markings: A driving simulator evaluation, Transportation Research Part F, 9, 2006, pp.77-87.
- Burns, David M., Hedblom, Thomas P., Miller, Terry W., Modern Pavement Marking Systems: The relationship between optics and nighttime visibility, Paper 08-0775, In TRB 87th Annual Meeting: Compendium of Papers. CD-ROM, Transportation Research Board of the National Academies, Washington, D.C., 2008. Accepted for publication in Transportation Research Record: Journal of the Transportation Research Board.
- Carlson, Paul J., Miles, Jeffrey D., Pratt, Michael P., and Pike, Adam M., Evaluation of Wet-Weather Pavement Markings: First Year, Publication FHWA/TX-06/0-5008-1, Texas Transportation Institute (TTI), college Station, TX (2005)
- Molino, John A., Katz, Bryan J., Duke, Dana E. Field Validation for the Relative Effectiveness of Combinations of Pavement Markings and Retroreflective Raised Pavement Markers in Recognizing Curves at Night, paper presented at TRB 2004 Annual Meeting.
- Aktan, F., Schnell, T., Performance Evaluation of Pavement Markings under Dry, Wet, and Rainy Conditions in the Field. Transportation Research Record No. 1877: Journal of the Transportation Research Board, 2004: p. 38-49.
- Schnell, T., Aktan, F., Lee, Y-C., Nighttime Visibility and Retroreflectance of Pavement Markings under Dry, Wet, and Rainy Conditions. Transportation Research Record No. 1824, Journal of the Transportation Research Board, 2003: p. 144-155.
- American Association of State Highway & Transportation Officials (AASHTO), "Standard Specification for Glass Beads used in Traffic Paints", Designation M247-05, Washington, DC (2005).
- ASTM, International, ASTM E1710-05: "Standard Test Method for Measurement of Retroreflective Pavement Marking Materials with CEN-Prescribed Geometry Using a Portable Retroreflectometer," West Conshohocken, PA, 2005.
- ASTM, International, ASTM E2177-01:"Standard Test Method for Measuring the Coefficient of Retroreflected Luminance (RL) of Pavement Markings in a Standard Condition of Wetness," West Conshohocken , PA, 2001.
- European Standard EN 1436-1997:" Road marking materials - Road marking performance for road users", European Committee for Standardization (CEN), Brussels, Belgium, 1997.
Photometric Characterization of Test Markings Under Dry and Rain Conditions Using a Calibrated CCD Photometer
Field measurements were made of the test markings luminance at the TTI Rain Tunnel to characterize the properties of each marking system in the actual on-road installation. The measurements were made using a calibrated imaging photometer (Radiant Imaging ProMetric Imaging Photometer Model PM-1413E-1) equipped with a variable zoom lens. Measurements were made from the driver point of view from within the test vehicle with illumination provided by the vehicle low beam headlights. The measurements were made only on the test marks installed within the TTI Rain Tunnel to allow direct comparisons of each system under both dry and rain conditions. All five test markings were measured on the road under dry conditions, but only four were measured in the rain. The TTI Rain Tunnel is divided into two zones in order to be able to provide consistent artificial rain over its entire 1600 ft length. During the measurements in rain one of the pipes feeding the south zone broke requiring TTI to shut this zone off. Measurements of Reference 1 and Prototype C, which were located within the south zone, had been completed before the south zone failed. The north zone was unaffected and we were able to do Prototype A and Reference 1 in the rain. We were not able to conduct measurements on Prototype B in the rain because it was situated half in each of the two rain zones. The south rain zone was repaired and operational prior to the start of the human factors runs.
Luminance measurements were made at three distances (60m, 45m and 30m) to produce a photometric profile of each line. The 30m distance was chosen to correspond to the measurement geometry called for in the standard instrumental test protocols for coefficient of retroreflected luminance (RL). The luminance measurement location for each marking was the junction point of the Y-configuration where the tapers branched out from the main line at the ends of each test pavement marking section. Measurements were also made of the pavement adjacent to the marking to be used for calculating the contrast between the respective markings and the pavement. The road surface upon which the test markings were installed was not optically flat, but rather had the bumps and unevenness typical of a normal public roadway. Those normal road surface "imperfections" can influence the illumination received from the test vehicle at each location. We used diffuse reflective targets next to the measurement location to quantify the illumination at each measurement location Figure 18). Under the dry condition we also made illuminance measurements using a Minolta T-10 handheld illuminance meter (Figure 19). For the rain measurements only one diffuse reflective target was used for reference (Figure 20).
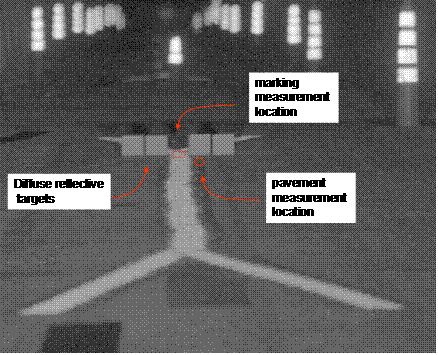
Figure 18. Screen capture from imaging photometer showing the locations of the reference luminance measurement location and set-up for the diffuse reflectance targets under dry conditions.
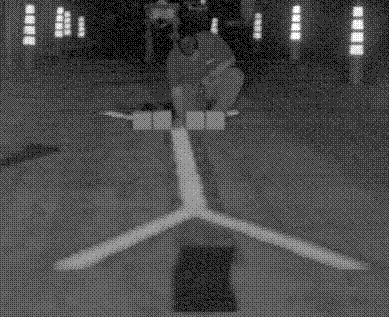
Figure 19. Illustration of illuminance measurement using the handheld illuminance meter.
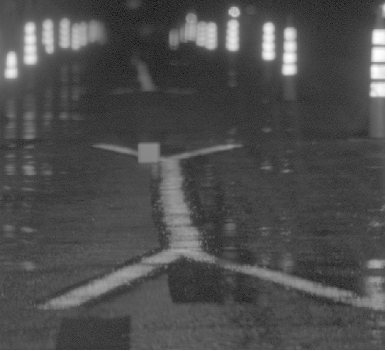
Figure 20. Screen capture from imaging photometer showing set-up for the diffuse reflectance targets under rain conditions.
The following are a series of plots showing the results of the photometric measurements.
Dry Results:
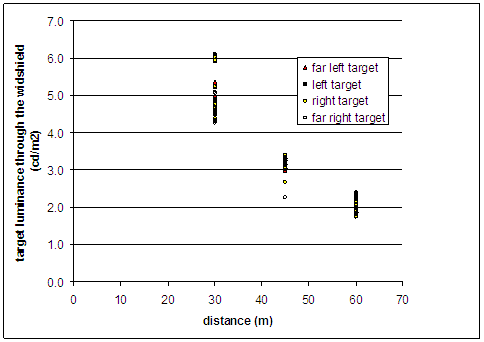
Figure 21. Diffuse target luminance from the driver point-of-view through the windshield as a function of distance and position on the road (dry conditions).
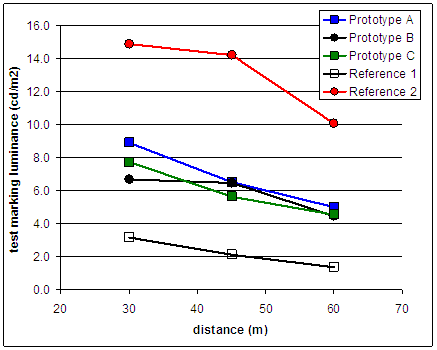
Figure 23. Test marking luminance from the driver point-of-view through the windshield as a function of distance (dry conditions).
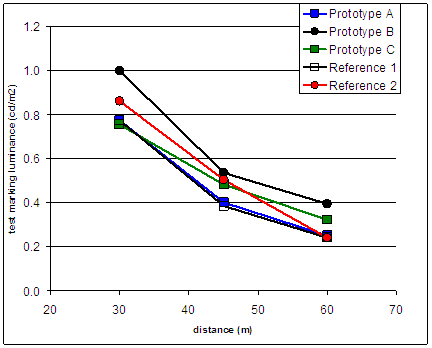
Figure 24. Luminance of the roadway surface adjacent to the test marking from the driver point-of-view through the windshield as a function of distance (dry conditions).
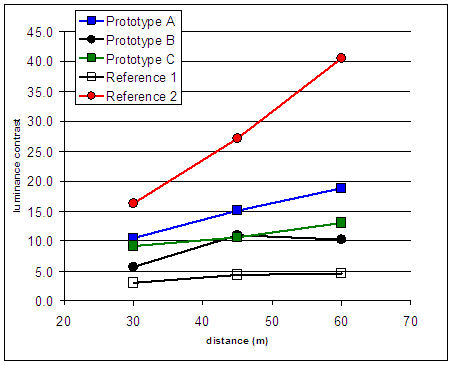
Figure 25. Luminance contrast between the test marking and the adjacent roadway surface as a function of distance (dry conditions, Contrast = (Lmarking-Lroad)/Lroad).
Rain Results:
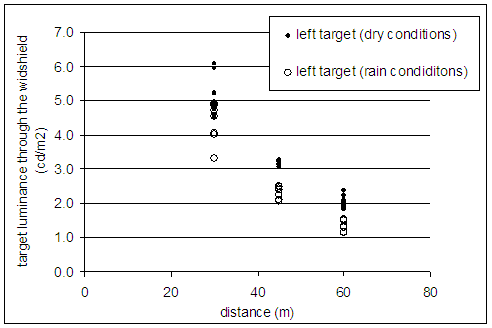
Figure 26. Diffuse target luminance from the driver point-of-view through the windshield as a function of distance, position on the road and conditions (dry versus rain conditions).
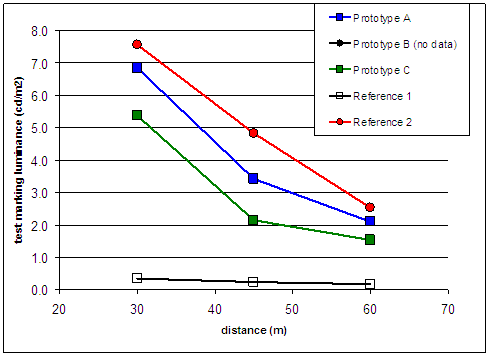
Figure 27. Test marking luminance from the driver point-of-view through the windshield as a function of distance (rain conditions).
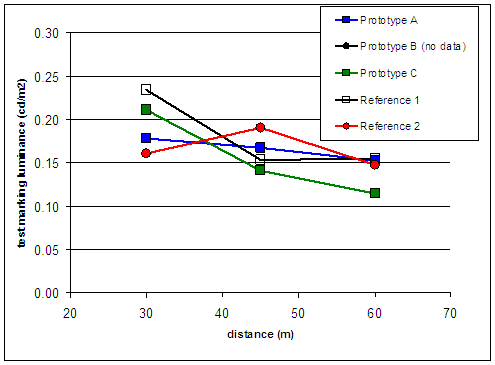
Figure 28. Luminance of the roadway surface adjacent to the test marking from the driver point-of-view through the windshield as a function of distance (rain conditions).
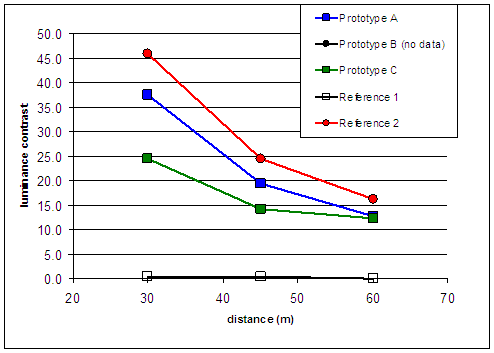
Figure 29. Luminance contrast between the test marking and the adjacent roadway surface as a function of distance (rain conditions, Contrast = (Lmarking-Lroad)/Lroad).
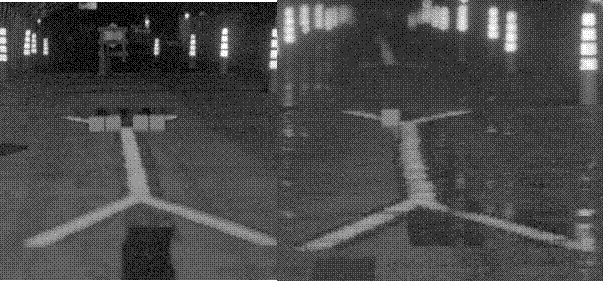
Figure 30. Screen captures from imaging photometer showing Prototype A at a distance of 45m under dry (left) and rain (right) conditions.
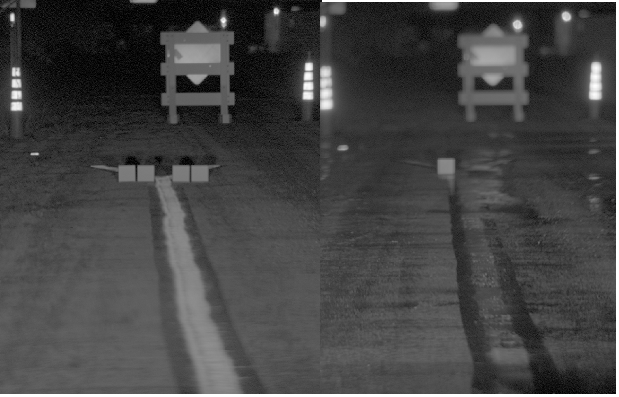
Figure 31. Screen captures from imaging photometer showing Reference 1 at a distance of 45m under dry (left) and rain (right) conditions.