

Composite Bridge Decking: Phase I Design Report
APPENDIX A: DETERMINATION OF PRELIMINARY DESIGN PROPERTIES
Overview
The trapezoidal profile used to create the replacement deck slabs in this project was developed from an earlier design developed at the University of Buffalo. In July 2010, XC Associates fabricated a protective ice shield for a bridge in Erie County, NY, using this profile design. The trapezoidal shape was slightly different than that proposed for the current project in that it only used a single grout cavity rather than two (see figure 8). The structure was fabricated from two trapezoids each approximately 0.1 inch thick. The smaller trapezoid was designed to be adhesively bonded inside the larger trapezoid. A series of these tubes were then adhesively bonded together to form a wall unit. To ensure the structural integrity of the wall unit, the assembly was completely wrapped by an outer laminate.
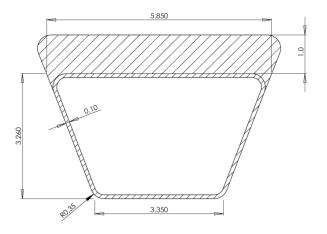
Figure 8. Diagram. Geometry of ice shield profile with single cavity.
The current bridge deck required significantly higher load bearing capacity than the ice wall units. To establish a feasible design, engineers planned to work from earlier finite element analysis models to determine suitable dimensions and FRP laminate configurations for the current deck application. To do this it was necessary to develop preliminary design properties which could be used in the finite element analysis modeling. Once the design had been developed, samples of the final laminates could then be produced and tested to validate predicted behavior.
This appendix outlines work done to develop design properties from the laminate configuration utilized in the earlier ice wall project. It also includes comparative testing performed on two alternative laminates of similar configuration produced by a different manufacturer.
Test Methods Utilized in Characterization Work
The test methods used in this characterization are outlined in table 2. These tests yield strength and modulus values in both primary directions (denoted as 0° for the primary fiber axis and 90° for the direction normal to that axis). Properties are determined in both tension and compression. In-plane shear strength was also determined. The fiber content of each panel was also determined to allow proper comparison of the resulting properties from each laminate.
| ASTM Test No. | Title | Properties Obtained | Symbol |
|---|---|---|---|
| D3039/3039M-08 | Standard Test Method for Tensile Properties of Polymer Matrix Composites | Ultimate tensile strength (0°) | σ11T |
| Ultimate tensile strain (0°) | ε11T | ||
| Modulus of elasticity (chord) (0°) | E11T | ||
| Ultimate tensile strength (90°) | σ22T | ||
| Ultimate tensile strain (90°) | ε22T | ||
| Modulus of elasticity (chord) (9°) | E22T | ||
| D6641/D6641M-09 | Standard Test Method for Compressive Properties of Polymer Matrix Composite Materials Using a Combined Loading Compression (CLC) Test Fixture | Ultimate compression strength (0°) | σ11C |
| Ultimate compression strain (0°) | ε11C | ||
| Modulus of elasticity (chord) (0°) | E11C | ||
| Ultimate compression strength (90°) | σ22C | ||
| Ultimate compression strain (90°) | ε22C | ||
| Modulus of elasticity (chord) (90°) | E22C | ||
| D7264/D7264M-07 | Standard Test Method for Flexural Properties of Polymer Matrix Composite Materials | Ultimate flexural strength (0°) | σ11F |
| Ultimate flexural strain (0°) | ε11F | ||
| Flexure Modulus (chord) (0°) | E11F | ||
| Ultimate flexural strength (90°) | σ22F | ||
| Ultimate flexural strain (90°) | ε22F | ||
| Flexure Modulus (chord) (90°) | E22F | ||
| D3171-09 | Standard Test Method for Constituent Content of Composite Materials Test Method I, Procedure G: Matrix Burnoff in a Muffle Furnace | Fiber fraction – mass | mƒ |
| Fiber fraction – volume | vƒ | ||
| D2344/D2344M-00 | Standard Test Method for Short-Beam Shear Strength of Polymer Matrix Composite Materials and Their Laminates | Short Beam Shear Strength |
Laminates Evaluated
The laminate produced by XC Associates was produced using Vectorply E-glass fabrics and Derakane 8084 vinyl ester resin. The fabric layup sequence was [E-QX2600 / E-LT5500 / E-QX2600] with E-QX2600 being a 25.18 oz/yd2 Quadraxial E-glass fabric and E-LT5500 being a 54.33 oz/yd2 Biaxial E-glass fabric. The resulting ply sequence was:
| 0° | 6.40 oz/yd2 |
| +45° | 6.27 oz/yd2 |
| 90° | 6.24 oz/yd2 |
| -45° | 6.27 oz/yd2 |
| 0° | 50.97 oz/yd2 |
| 90° | 3.36 oz/yd2 |
| 0° | 6.40 oz/yd2 |
| +45° | 6.27 oz/yd2 |
| 90° | 6.24 oz/yd2 |
| -45° | 6.27 oz/yd222 |
The Compmillenia panels were also produced using Vectorply E-glass fabrics, though different fabrics were selected due to materials held in-stock at Compmillenia. The fabric layup sequence in these panels was [E-LT3200 / E-LM1810 / E-BX2400 / E-LM1810 / E-LT3200], with E-LT3200 being a 31.36 oz/yd22 biaxial fabric, E-LM1810 being a 27.06 oz/yd22 uniaxial fabric with mat backing and E-BX2400 being a 23.90 oz/yd22 double bias fabric with fibers oriented at +45°/-45°. The resulting ply sequence from this configuration was:
| 90° | 13.44 oz/yd22 |
| 0° | 17.92 oz/yd22 |
| 0° | 17.92 oz/yd22 |
| CSM | 9.00 oz/yd22 |
| +45° | 11.95 oz/yd22 |
| -45° | 11.95 oz/yd22 |
| 0° | 17.92 oz/yd22 |
| CSM | 9.00 oz/yd22 |
| 0° | 17.92 oz/yd22 |
| 90° | 13.44 oz/yd22 |
Compmillenia provided two sample laminates with the alternative layup. One was produced using a standard vinylester (CoRezyn VE8121) and the other with an alternative fire retardant vinylester resin (CoRezyn VE8441). While the ply sequence of these panels are different from each other, the total weight of directional reinforcement in each panel is relatively close, as shown below in table 3.
| Direction | Ice Shield (oz/yd22) | Compmillenia (oz/yd22) |
|---|---|---|
0° |
63.8 |
71.7 |
90° |
15.8 |
26.9 |
+/- 45° |
25.1 |
23.9 |
CSM |
0 |
18.0 |
Theoretical Thickness |
0.106 in. |
0.15 in. |
Test Results
| Property | Symbol | XCA Ice Wall | Compmillenia VE-8121 |
Compmillenia VE-8441 |
|||
|---|---|---|---|---|---|---|---|
| Mean | Std. Dev. | Mean | Std.Dev. | Mean | Std.Dev. | ||
| Modulus | |||||||
| Tension Compression Flexure |
ET0 ET90 EC0 EC90 EF0 EF90 |
4.36 MSI 2.02 MSI 2.89 MSI 2.18 MSI 1.83 MSI 1.77 MSI |
0.15 MSI 0.25 MSI 0.42 MSI 0.48 MSI 0.09 MSI 0.08 MSI |
2.48 MSI 1.86 MSI 2.36 MSI 1.84 MSI 2.05 MSI 2.38 MSI |
0.20 MSI 0.26 MSI 0.35 MSI 0.13 MSI 0.08 MSI 0.07 MSI |
2.56 MSI 1.99 MSI 2.37 MSI 1.93 MSI 1.91 MSI 2.51 MSI |
0.18 MSI 0.44 MSI 0.24 MSI 0.13 MSI 0.07 MSI 0.07 MSI |
| Ultimate Strength | |||||||
| Tension Compression Flexure |
σT0 σT90 σC0 σC90 σF0 σF90 |
84.51 KSI 28.57 KSI 60.08 KSI 30.09 KSI 37.78 KSI 47.40 KSI |
1.70 KSI 2.05 KSI 3.35 KSI 1.34 KSI 1.81 KSI 1.72 KSI |
49.80 KSI 29.75 KSI 54.41 KSI 32.32 KSI 66.08 KSI 64.56 KSI |
2.05 KSI 1.81 KSI 4.03 KSI 2.07 KSI 4.06 KSI 4.30 KSI |
47.31 KSI 28.40 KSI 45.58 KSI 27.22 KSI 56.63 KSI 61.54 KSI |
3.42 KSI 0.44 KSI 5.07 KSI 2.20 KSI 3.60 KSI 3.40 KSI |
| Strain at Max. Stress | |||||||
| Tension Compression Flexure |
εT0 εT90 εC0 εC90 εF0 εF90 |
2.30 % 2.40 % 2.62 % 2.38 % 3.52 % 3.58 % |
0.13 % 0.12 % 0.38 % 0.95 % 0.25 % 0.22 % |
2.44 % 2.13 % 2.43 % 2.07 % 4.23 % 3.06 % |
0.14 % 0.11 % 0.54 % 0.40 % 0.11 % 0.14 % |
2.37 % 2.23 % 2.14 % 1.44 % 3.84 % 2.77 % |
0.20% 0.21 % 0.27 % 0.13 % 0.22 % 0.16 % |
| In Plane Shear Strength | τ12 τ21 |
13.30 KSI 15.41 KSI |
0.41 KSI 1.51 KSI |
14.02 KSI 13.59 KSI |
0.59 KSI 0.46 KSI |
13.98 KSI 13.69 KSI |
0.60 KSI 0.82 KSI |
| Short Beam Strength | 5.81 KSI | 0.28 KSI | 4.98 KSI | 0.26 KSI | 5.16 KSI | 0.26 KSI | |
| Fiber Content (%) mass volume |
mf vf |
70 % 48 % |
54 % 31 % |
52% 30 % |
|||
| Thickness | t | 0.113 in | 0.0012 in | 0.218 in | 0.004 in | 0.222 in | 0.003 in |
Observations on Physical Testing
From the test data it was observed that the two Compmillenia panels were very similar in terms of mechanical properties. There was only a minimal difference in the fiber volume fraction achieved in each panel; thus, the mechanical performance is very similar. The variation in ultimate strength values reflects the slight difference seen in corresponding strain values. The laminates display a highly linear elastic behavior up to failure, and the strength differences simply relate to the different amount of physical elongation seen prior to failure. Given the level of within-sample scatter seen in each sample sets it would seem reasonable to conclude that the different resin used in these panels makes a minimal difference to the mechanical performance.
Behavior in the Principal Fiber Direction(0º)
Under tension, the XC Associates panel displays considerably higher properties in the dominant fiber direction (0°). This is indicative of the fact that this panel possesses a significantly higher proportion of its total panel thickness with fibers in that direction. As can be seen from figure 9, in the Compmillenia panel approximately 16 percent of the total thickness of the laminate is occupied by fiber that runs in the 0° direction, compared with 29 percent in the XC Associates ice wall laminate (184 percent difference). It would thus be reasonable to expect that the 0° properties of the XC Associates ice wall panel would be a little under double those of the Compmillenia panels. This is seen in the test data. ET0 for the ice wall is 170-175 percent of the Compmillenia panels, and sT0 for the ice wall is 170 percent of the Compmillenia panel. Statistical analysis indicates that data from the two Compmillenia panels are from a common statistical population, which would be expected based on the identical architecture.
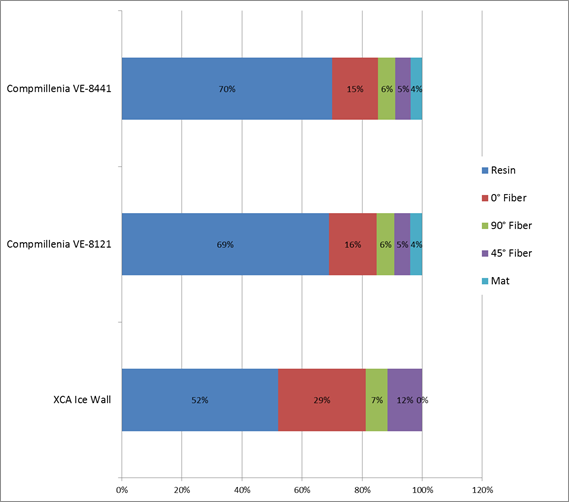
Figure 9. Graph. Constituent content of test laminates as a percentage of total laminate thickness.
From the strain data it can be observed that all of the specimens fail at approximately the same strain. Previous in-house testing has indicated tension capacity in the fiber direction is dominated by the fiber and that the average failure strain of unidirectional glass fiber laminates is around 2.4 percent (standard deviation of 0.56 percent) irrespective of the amount of reinforcement or the resin type. Observation of the average strain limits of the three laminates tested here indicates they all fail close to this level. Statistical analysis of the data indicates that the three strain data sets are part of the same statistical population. It is therefore reasonable to conclude that it is the fiber oriented along the load direction which is controlling the failure of these laminates under tension. When the fibers in the load direction reach their strain limit, rupture occurs and results in catastrophic failure of the laminate.
For compression properties in the principal fiber direction, it can be seen that the resin begins to play a more significant role in the mechanical properties obtained. In terms of ultimate capacity, the strain at break results of the three samples are found to be from the same statistical population, with a population mean of 2.41 percent. This again indicates that the fiber oriented in the load direction is primarily responsible for determining the laminate failure.
However, unlike the behavior under tension, when the laminates are tested in compression parallel to the principal fiber direction, there is not a direct correlation between the fiber content and the resulting modulus (EC0). In this instance, the difference between the ice wall laminate modulus and the modulus for the Compmillenia panels is only around 22 percent, not the expected 70 to 80 percent. This would indicate that the other laminate constituents play a more significant role under compression. Similar results are seen with the strength data (sC0), where the ice wall panel only displays 10 percent (VE-8121) and 32 percent (VE-8441) strength improvements over the Compmillenia panels.
Behavior in the Off-Axis Fiber Direction (90º)
In the 90° direction it can be seen that the proportion of the laminate thickness aligned with the load (90° fibers aligned with 90° axial load) is relatively close for all the panels (7.24 percent vs. 5.94 percent and 5.74 percent). It would therefore be anticipated that for fiber dominated properties the observed values in the 90° direction would be relatively close to each other. This is consistent with the observed data.
When normalized against the amount of fiber in the 90º direction as a proportion of laminate thickness, both the tension and compression modulus (E90T, E90C) are statistically from the same populations, indicating the dominant role of the fiber in the compression response of the laminates.
In terms of strength and strain data on ultimate capacity, the values obtained in testing are relatively close. However, deeper analysis of the data indicates statistically significant variations which cannot be fully explained by the proportion of load bearing fiber. Strain data in tension indicate that the Compmillenia panels are statistically from the same population, but there is significant variation between these values and those of the ice wall panel (average 2.14 percent vs. 2.44 percent). The reason for this variation is unknown and would require further testing to verify. It is thought that some of the variation may be due to the overall architecture of the laminates. With the Compmillenia panels all of the 90º fiber is located on one side of the laminate, while in the ice wall panel the 90º fiber is more evenly distributed throughout the thickness of the panel. It may be that having adjacent plies in other directions helps to preserve the integrity of the fibers to higher strain levels by better distributing load through the laminate thickness.
Under compression loads the data display significantly greater variation in terms of ultimate capacity. Statistical analysis of the compression strain data indicates statistically significant differences between all three sets of data. The average compression failure strains for the ice wall, VE-8121, and VE-8441 panels are 2.38 percent. 2.07 percent, and 1.44 percent, respectively. Statistically, the ice wall and VE-8121 data are from the same population, but the data for the VE-8441 panel are significantly lower. An examination of the failed specimens does not provide any obvious reason for the discrepancy in failure strains. Failure in inherently compression is more variable than corresponding tensile failure due to the increased number of possible failure mechanisms. Buckling can occur on both a macroscopic specimen level and a microscopic fiber level, with the latter being particularly difficult to identify. Examination of the stress-strain curves for the VE-8441 sample does not indicate any obvious buckling in the specimens. Additionally, all of the failures were properly within the gage length, so there was no obvious premature failure due to the grips. At this point it is possible to identify the difference between the samples, but it is not possible to further explain these variations.
Shear Behavior
In addition to axial tension and compression, shear strength was evaluated both in-plane and through the thickness between the individual laminate plies. In-plane shear testing was conducted using a V-notch shear test. Two different orientations were tested, as shown in figure 10.
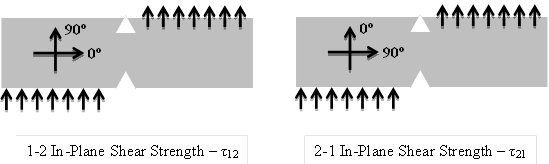
Figure 10. Diagram. Fiber directions for in-plane shear strength testing.
The V-notch shear test induces principal tension and compression stresses at +45º and-45º. On the basis of the previous discussions it would therefore seem reasonable to expect the in-plane strength of the laminates to be significantly influenced by the fiber oriented at +/- 45º.
Statistical analysis of the data from the two Compmillenia panels indicate they are from a single population, indicating that the behavior is fiber dominated. There is also no statistically significant difference between the τ12 data and the τ21 data. If the resin or the fiber oriented off the +/-45º axis were playing a significant role in determining the in-plane shear strength, it would expected that statistically significant differences would be evident in the four data sets. The absence of such differences would indicate that the fiber in the +/-45º directions does control the shear capacity.
As would be expected from the significant difference between their +/-45º fiber percentages, there is a statistically significant difference between the shear strengths of the ice wall and Compmillenia panels. However, while the ice wall panel displays an increase in in-plane shear capacity, there is not a direct correlation with the amount of +/-45º fiber present. The ice wall panel has an average shear strength of 12.4 ksi while the Compmillenia panels have an average of 11.3 ksi. This is a strength increase of only around 10 percent for the ice wall panel despite it having 12 percent of its thickness as +/-45º versus only 5 percent for the Compmillenia panels. All three panels have a similar load versus deflection behavior trend.
Interlaminar shear capacity was evaluated using a short beam shear test. This test uses a relatively short span under flexural loading to induce shear failure of the specimen between the individual plies, typically at the neutral axis. The interlaminar strength is generally considered to be a resin dominated property; however, the orientation of plies on either side of the failure plane will also play a role in the capacity obtained. The Compmillenia panels display relatively uniform results and were found to be statistically from the same population. Given the identical fiber architecture and similarities in the resin properties, this result would be consistent with expectations. The results for the ice wall panel are higher than the ones for the Compmillenia panels. It is thought that this is attributable to the differences in fiber architecture and resin properties, although no direct correlation can be established at this time.
Comparison of Panel Results
Some of the discrepancies between the ice wall panel and the two Compmillenia panels are due to the slightly different fiber architecture used by the two manufacturers. In a commercial context where manufacturers were relying on existing reinforcement stocks to produce the panels, the selection of the different reinforcements was entirely reasonable. Most manufacturers seem to work with a selection of preferred reinforcement products and then adapt designs around those products. The challenge for design engineers is how to accommodate those differences and to provide a valid comparison between two different options.
As can be seen from the test data, many of the properties in question tend to be fiber dominated due to the reinforcement architecture selected. Once properties are correlated against the actual amount of reinforcement used, what initially appear to be differences in panel quality can be identified as the simple result of varied reinforcement quantities. This is similar to reinforced concrete. Two finished beams may look similar from the outside and may have both been manufactured to high quality. However, if their internal reinforcement is different, one will provide significantly higher capacity than the other. The result is not the result of a quality flaw but rather stems from what would be an intentional design decision. The same is true for composites.
Beyond fiber architecture, the other principle reason for the difference in panel performance is the resin content of the panels. This is purely the result of manufacturing methodology. The ice wall panel was produced using a VARTM (vacuum infusion) process which infuses the resin into the fiber under vacuum, while the Compmillenia panels were produced by wet layup followed by a vacuum consolidation. The resin content differences that result from these processes are inherent to the processes themselves.
Both processes place the laminate under a plastic film to create an envelope which is then evacuated to create a pressure differential between the inside of the envelope and ambient atmospheric conditions. This pressure differential is used to consolidate the laminate with the aim of achieving a higher proportion of fiber in the final product. However the mechanism for achieving that consolidation is different with each method. VARTM first consolidates the dry reinforcement and then allows a limited amount of resin into the pre-consolidated fiber. For a vacuum bagged wet layup the reinforcement is initially wet out with resin under ambient conditions. Once the reinforcement and resin have been successfully combined (typically with a resin excess), the wet laminate is placed under the vacuum film and the pressure differential is induced to essentially squeeze out excess resin. While both processes use the same consolidation pressure, the VARTM process typically produces higher fiber percentages. This is because it is far easier to compact the dry fiber layers in VARTM than it is to displace a relatively viscous liquid from within the fibers to compact the wet layup. The result would be that, for a given fiber architecture and resin, a VARTM produced product would be slightly thinner than a vacuum bagged wet layup one. However, it is important to remember that the actual amount of reinforcement would not change—all that would happen is that one panel would possess less resin than the other.
For properties which are fiber dominated, the actual structural capacity of the two laminates would not be changed because the amount of reinforcement would be the same. However, the resulting properties, which are generally characterized in terms of force per unit area, would appear higher for the VARTM laminate due to the reduced thickness. It is essential to remember that thickness is essentially a manufacturing variable, not an inherent characteristic of the material.
Therefore, when comparing the ice wall panel and the two Compmillenia panels, it is necessary to separate manufacturing effects from the potential viability of the laminates. In producing the sample panel, Compmillenia indicated that a VARTM process could be used in the production of bridge components but that their standard production method was vacuum bagged wet layup. From the data obtained it would be reasonable to anticipate that if Compmillenia switched to a VARTM process the resulting laminate properties would be correspondingly higher.
Conclusion
From the test results it can be concluded that all three test panels provide mechanical performance consistent with the fiber architecture and the manufacturing method used. Both manufacturers produced panels that exhibited sufficient quality to be utilized in an actual bridge deck fabrication.
Assuming that a laminate specification is developed that reflects the original ice wall laminate construction and that it specifies the use of a VARTM process, the properties in table 5 could be specified for design calculations.
| Property | Symbol | Mean | B-Basis Value |
|---|---|---|---|
| Modulus | |||
| Tension Compression |
ET0 ET90 EC0 EC90 |
4366 KSI 1988 KSI 2889 KSI 2180 KSI |
|
| Ultimate Strength | |||
| Tension Compression |
σT0 σT90 σC0 σC90 |
84.56 KSI 29.15 KSI 60.05 KSI 30.17 KSI |
78.90 KSI 26.25 KSI 50.04 KSI 25.82 KSI |
| Strain at Max. Stress | |||
| Tension Compression |
εT0 εT90 εC0 εC90 |
2.30% 2.44% 2.62% 2.05% |
1.97% 2.32% 1.46% 0.77% |
| In Plane Shear Strength | τ | 12.34 KSI | 10.15 KSI |
| Short Beam Strength | 5.80 KSI | 5.16 KSI | |
| Fiber Content(%) mass volume |
mtf vf |
70% 48% |
|
| Thickness | t | 0.113 in |
Given the statistical nature of material failure, it is customary to use statistically based capacity values for engineering design. In this instance, B-basis values are given for the ultimate strength and strain capacity properties. The B-basis value is a 95 percent lower confidence bound on the tenth percentile of a specified population of measurements. Composite Materials Handbook 17 (formerly MIL-HDBK-17) adopts A-basis and B-basis values for characteristic properties of composite materials in engineering design. For the current project, A-basis values (95 percent confidence on the first percentile) are seen as overly conservative, particularly given that validation testing will be conducted at all stages of the design and development process. B-basis values are therefore recommended for capacity characterization.