

Composite Bridge Decking: Phase I Design Report
APPENDIX B: DETERMINATION OF LAMINA DESIGN PROPERTIES
Overview
The detailed analysis of FRP structures and sub-components is a typically a complex undertaking requiring the use of advance finite element analysis techniques. Due to their inherent brittleness and the directional nature of composite laminates, simplified analysis methods developed for isotropic materials such as steel often do not provide sufficient detail to ensure adequate structural performance with FRP composites. To utilize these methods it is necessary to develop good representative material properties which may be input into finite element models.
Physically, FRP laminates are constructed from a series of ply layers which after curing perform as a single unified layer. In instances where the laminate ply sequence is predetermined, it is possible to construct and test a laminate of the specified construction and to then input those properties into a finite element model. However, in most instances the designer does not know the ply sequence beforehand and will use an iterative process which moves between various ply sequences and structural forms to find an optimal combination of both.
Thankfully, modern finite element analysis packages typically possess laminated plate elements which allow the designer/analyst to specify various reinforcements and orientations. The individual layer properties can be entered and are ultimately combined in the model using classical laminate theory. The basic building block of this approach is the individual unidirectional ply or lamina. Thus, properly defining the properties of a unidirectional lamina is the key to developing viable structural models.
FRP materials are orthotropic in nature, which means the characterization of their mechanical behavior is more complex than for isotropic materials such as steel. The full set of material properties required to define the unidirectional lamina is given in table 6.
For commercial manufacturing purposes it is often convenient to produce a specified ply sequence using a multi-axial fabric. These fabrics combine dry reinforcement for two, three, or four laminae in a single fabric where the separate layers are stitched together with a non-load-bearing thread. Analytically, these fabrics are simply multiple unidirectional lamina placed on top of each other in different orientations, so it is technically not necessary to separately characterize these fabrics if unidirectional lamina properties have already been established. However, some designers prefer to characterize these fabrics in addition to the unidirectional lamina.
In addition to directional layers, it is relatively common for laminates to include layers of randomly oriented short fibers. In dry form these are layers are known as chopped strand mat (CSM) and consist of randomly oriented fibers of approximately 2 inches held together in fabric form by a compatible binder. These layers are essentially isotropic and must be characterized separately from the unidirectional lamina.
This appendix outlines the results of testing undertaken to characterize a unidirectional lamina and a CSM lamina of E-glass and vinyl ester. Addition testing was undertaken on a biaxial lamina (two plies at 0º and 90º) and a double bias lamina (two plies at +45º and -45º).
| Property | Direction | Symbol |
|---|---|---|
| Modulus of Elasticity | 0 | E1 |
| 90 | E2 | |
| In-plane Shear Modulus | 0-90 | G12 |
| 90-0 | G21 | |
| Tensile Strength | 0 | σ1T |
| 90 | σ2T | |
| Compression Strength | 0 | σ1C |
| 90 | σ2C | |
| Ultimate Tensile Strain | 0 | ε1T |
| 90 | ε2T | |
| Ultimate Compression Strain | 0 | ε1C |
| 90 | ε2C | |
| In-plane Shear Strength | 0-90 | τ12 |
| 90-0 | τ21 | |
| In-plane Poisson Coefficient | 0-90 | ν12 |
| 90-0 | ν21 | |
| Lamina Thickness | not applicable | t |
Test Methods Utilized in Characterization Work
The test methods used in this characterization are outlined in table 7. These tests yield strength and modulus values in both primary directions (denoted as 0° for the primary fiber axis and 90° for the direction normal to that axis). Properties are determined in both tension and compression. In-plane shear strength was also determined. The fiber content of each panel was also determined to allow proper comparison of the resulting properties from each laminate.
| ASTM Test No. | Title | Properties Obtained | Symbol |
|---|---|---|---|
| D3039/3039M-08 | Standard Test Method for Tensile Properties of Polymer Matrix Composites | Ultimate tensile strength (0°) | σ1T |
| Ultimate tensile strain (0°) | ε1T | ||
| Modulus of elasticity (chord) (0°) | E1T | ||
| Ultimate tensile strength (90°) | σ2T | ||
| Ultimate tensile strain (90°) | ε2T | ||
| Modulus of elasticity (chord) (90°) | E2T | ||
| D6641/D6641M-09 | Standard Test Method for Compressive Properties of Polymer Matrix Composite Materials Using a Combined Loading Compression (CLC) Test Fixture | Ultimate compression strength (0°) | σ1C |
| Ultimate compression strain (0°) | ε1C | ||
| Modulus of elasticity (chord) (0°) | E1C | ||
| Ultimate compression strength (90°) | σ2C | ||
| Ultimate compression strain (90°) | ε2C | ||
| Modulus of elasticity (chord) (90°) | E2C | ||
| D5379/D5379M-05 | Standard Test Method for ShearProperties of Composite Materials by the V-Notched Beam Method | In-plane shear strength (0-90) | τ12 |
| In-plane shear strength (90-0) | τ21 | ||
| D3171-09 | Standard Test Method for Constituent Content of Composite Materials Test Method I, Procedure G: Matrix Burnoff in a Muffle Furnace |
Fiber fraction –mass | mƒ |
| Fiber fraction – volume | vƒ | ||
| D2344/D2344M-00 | Standard Test Method for Short-Beam Shear Strength of Polymer Matrix Composite Materials and Their Laminates |
Short Beam Shear Strength |
Laminates Evaluated
Four laminates were fabricated for this testing. The test panels are outlined in table 8.
| Panel ID | Reinforcement Fabric | Reinforcement Description | Ply Sequence |
|---|---|---|---|
| LSC-11-LAM-010 | E-LA1312 | 13.42 oz/yd2 stitched unidirectional | [0]4 |
| LSC-11-LAM-011 | E-BX1200 | 12.54 oz/ydd2 stitched +45/-45 double bias | [+45/-45]4 |
| LSC-11-LAM-012 | E-LT1800 | 17.92 oz/ydd2 stitched 0/90 biaxial | [0/90]3 |
| LSC-11-LAM-013 | E-M0010 | 9.0 oz/ydd2 stitched CSM | [CSM]5 |
Test Results
Table 9 summarizes the results obtained through physical testing.
| Property | Unidirectional Laminate |
Double Bias Laminate | Biaxial laminate | Random Fiber (CSM) Laminate |
|||||
|---|---|---|---|---|---|---|---|---|---|
| Mean | Std. Dev. | Mean | Std. Dev. | Mean | Std. Dev. | ||||
| Modulus Tension Compression |
ET0 ET90 EC0 EC90 |
2365 KSI 728 KSI 2184 KSI 824 KSI |
171 KSI 23 KSI 329 KSI 125 KSI |
626 KSI 850 KSI 633 KSI 1009 KSI |
51 KSI 76 KSI 90 KSI 133 KSI |
1742 KSI 1957 KSI 1979 KSI 2019 KSI |
159 KSI 195 KSI 194 KSI 233 KSI |
1094 KSI 974 KSI 975 KSI 1131 KSI |
99 KSI 122 KSI 98 KSI 130 KSI |
| Ultimate Strength Tension Compression |
σT0 σT90 σC0 σC90 |
55.85 KSI 3.96 KSI 48.32 KSI 11.45 KSI |
3.15 KSI 0.27 KSI 1.71 KSI 1.40 KSI |
7.28 KSI 15.65 KSI 10.70 KSI 12.41 KSI |
0.27 KSI 0.49 KSI 0.66 KSI 0.32 KSI |
32.99 KSI 31.82 KSI 39.68 KSI 37.22 KSI |
2.40 KSI 4.04 KSI 3.49 KSI 1.35 KSI |
16.60 KSI 15.01 KSI 20.51 KSI 21.97 KSI |
1.31 KSI 1.48 KSI 0.61 KSI 1.46 KSI |
| Strain at Max. Stress Tension Compression |
εT0 εT90 εC0 εC90 |
2.46 % 0.62% 3.56 % 2.23 % |
0.14 % 0.00% 1.13% 0.61% |
17.73% 10.01 % 3.84 % 2.34 % |
4.97% 1.16% 0.92% 0.33% |
2.13 % 2.06% 2.69 % 3.72 % |
016% 0.27% 0.42 % 1.72 'lo |
2.01% 1.91 % 3.01 % 31. 6 % |
0.28 % 0.35% 0.65% 0.67% |
| In Plane Shear Strength | τ12 τ21 |
6.39 KSI 4.45 KSI |
0.25 KSI 0.61 KSI |
10.76 KSI 11.21 KSI |
0.30 KSI 0.38 KSI |
6.08 KSI 6.41 KSI |
0.37 KSI 0.26 KSI |
11.34 KSI . KSI |
0.00 KSI 0.75 KSI |
| Short Beam Strength | 40.00 KSI | 1.83 KSI | 17.80 KSI | 0.75 KSI | 33.00 KSI | 2.51 KSI | 21.70 KSI | 4.74 KSI | |
| Fiber Content (%) mass volume |
mf vf |
40 % 21 % |
36 % 18 % |
47 % 26 % |
35 % 18 % |
||||
| Thickness | t | 0.126 in | 0.148 in | 0.116 in | 0.135 in | ||||
Discussion of Results
Unidirectional Lamina Behavior
From the unidirectional lamina results, it can be seen that the properties in the principal fiber direction (0º) are significantly higher than the corresponding properties at 90º to the fiber axis. As the modulus of elasticity is taken early in the stress/strain response, it would be reasonable to expect the results for tension and compression modulus to be relatively close to each other. This is seen in the test data. Statistical analysis indicates that both the tension and the compression data are from the same statistical population. This is found both parallel and perpendicular to the fibers. This allows for the determination of a single modulus of elasticity for the material under both tension and compression loading. Using the pooled data, the mean modulus of elasticity for the laminate parallel to the fibers (E1) is 2.34 MSI (standard deviation 0.329 MSI). The pooled modulus of elasticity perpendicular to the fibers (E2) was found to be 0.77 MSI (standard deviation 0.097 MSI). It is worth noting that while a single statistical value can be established in each direction, there is significantly higher scatter seen in the compression data compared with the tension data.
Failure data for tension and compression do not display the same sort of commonality. This is to be expected due to the different failure mechanisms which drive behavior under tension and compression loading. The data obtained in this testing is seen to be consistent with testing of unidirectional laminae previously undertaken by the author.
Random Fiber Lamina Behavior
As mentioned earlier, the random fiber lamina is expected to be essentially isotropic, and there should be no statistically significant difference in the data obtained at 0º and 90º. Analysis of the modulus of elasticity results indicates that all four data sets (tension and compression at 0º and 90º) are statistically from the same population. This yields a mean modulus of elasticity for the lamina of 1.07 MSI (standard deviation 0.118 MSI).
In relation to capacity, 0º and 90º tensile strengths are found to be from the same population with a mean strength of 15.9 KSI (standard deviation 1.55 KSI). Tensile strain limits are also of the same population, giving an overall mean of 1.96 percent (standard deviation 0.303 percent). Compression strength and strain are similarly seen to be of the same statistical populations, with mean values of 21.18 KSI (std. dev. 1.31 KSI) and 3.08 percent (standard deviation 0.63 percent), respectively.
Based on these findings, shear response was only evaluated in the 0º direction. The mean shear strength was found to be 11.34 KSI with a standard deviation of 0.75 KSI.
Biaxial Lamina Behavior
As mentioned previously, a biaxial fabric is really just two unidirectional layers stitched together at 90º to each other. According to manufacturer data from Vectorply, each layer has an equal amount of unidirectional reinforcement: 8.96 oz/yd2. It would therefore be expected that the lamina properties would be equal at both 0 and 90º.
Analysis of the modulus of elasticity values obtained at both 0º and 90º under tension and compression indicated that all the values obtained belong to a common statistical population. It was found that the combined data set had a mean modulus of 1.94 MSI (std. dev. 0.219 MSI).
Analysis of the strength data indicates that statistically significant differences exist between the tension and compression behavior, but within each load type the results at 0º and 90° are of the same population. The mean tension strength (σT) was found to be 32.3 KSI (standard deviation 3.25 KSI), and the compression strength (σC) was found to be 38.0 KSI (standard devuation 3.02 KSI). Similar results were found in strain capacity, with the mean tensile found to be 2.09 percent (standard deviation 0.219 percent) and the mean compression strain found to be 2.61 percent (standard deviation 0.467 percent).
Double Bias Lamina Behavior
The double bias fabric used in this test series consisted of two unidirectional layers of 6.27 oz/yd2 each stitched together at +45° and -45° relative to the principle axis (0°), which is defined as the direction off the fabric roll. The layers are stitched together with a cotton thread running in the 0° direction (see figure 11). As there is an equal amount of reinforcement at each bias angle, it would be expected that properties at 0° and 90° would show to be from a common statistical population. This thought is supported by manufacturer data, which shows equal values for modulus of elasticity and strength in both directions. However, this type of behavior is not supported by the test data. Examination of the modulus and strength data shows significant difference at both 0° and 90° for tension and compression loadings.
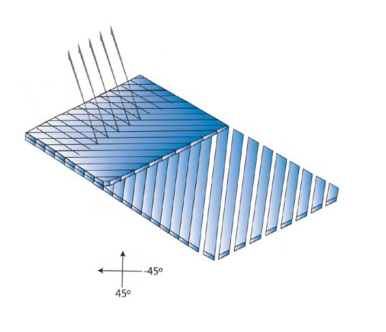
Figure 11. Diagram. Structure of double bias laminate.
It is believed that the reason for the differences observed in the test data stems from the cotton thread used to hold the glass reinforcement fibers in position. Upon further examination it was found that significantly higher stiffness and strength were exhibited when the test direction was parallel to the direction of cotton stitching. Visual examination of the dry reinforcement supported this conclusion, with the fabric demonstrating far more distortion under loading perpendicular to the cotton than with loading parallel to the cotton threads.
The question in characterizing this lamina thus becomes which set of properties should be used when designing with double bias fabrics. It is worth noting that these fabrics are generally used to assist in carrying shear loadings in structures which reduce to principal tensile and compressive stresses parallel to the bias fiber direction. It is also worth noting that the fabrics are often laid down during fabrication without consideration of the cotton stitching. It is therefore thought that the best approach would be to neglect the effect of the cotton and use a conservative approach which characterizes the material based on the properties normal to the cotton direction. In this instance, this translates to the 90° direction.
Analysis of the tension and compression modulus of elasticity data at 90° indicates that the data are from a common statistical population. This translates to a combined modulus of elasticity of 0.935 MSI (standard deviation 0.134 MSI) for the material.
In-plane shear behavior was found to not be affected by the cotton stitching, and statistical analysis of the data in the 1-2 and 2-1 directions showed both sets of results to be from the same statistical population. The in-plane shear strength for the double bias lamina was found to be 10.96 KSI (standard deviation 0.397 KSI).
Conclusion
Based on the outcomes of this testing, the values given in table 10 are suggested as design properties for the various lamina forms. The values were obtained using hand lamination and are not normalized for fiber content. This should be accounted for in design calculations and analysis.
Additional care should be taken with using the capacity values. The values given are mean values, and appropriate statistical adjustment should be made using the associated standard deviations to ensure a sufficient margin of safety is created in design work.
| Property | Unidirectional Lamina |
Double Bias Lamina | Biaxial Lamina | Random Fiber (CSM) Lamina | |||||
|---|---|---|---|---|---|---|---|---|---|
| Mean | Std.Dev. | Mean | Std.Dev. | Mean | Std.Dev. | Mean | Std. Dev. | ||
| Modulus | E0 E90 |
2340 KSI 770 KSI |
329 KSI 97 KSI |
935 KSI | 134 KSI | 1940 KSI | 219 KSI | 1070 KSI | 118 KSI |
| Ultimate Strength Tension Compression |
σT0 σT90 σC0 σC90 |
55.85 KSI 3.96 KSI 48.32 KSI 11.45 KSI |
3.15 KSI 0.27 KSI 1.71 KSI 1.40 KSI |
15.65 KSI 12.41 KSI |
0.49 KSI 0.32 KSI |
32.30 KSI 38.00 KSI |
3.25 KSI 3.02 KSI |
15.90 KSI 21.18 KSI |
1.55 KSI 1.31 KSI |
| Strain at Max. Stress Tension Compression |
εT0 ε190 εC0 εC90 |
2.46% 0.62% 3.56% 2.23% |
0.14 % 0.06 % 1.13% 0.61% |
10.01% 2.34 % |
1.16% 0.33% |
2.09% 2.61% |
0.219 % 0.467 o/o |
1.96% 3.08 % |
0.303% 0.63% |
| In Plane Shear Strength | Τ12 τ21 |
6.39 KSI 4.45 KSI |
0.25 KSI 0.61 KSI |
10.96 KSI | 0.40 KSI | 6.25 KSI | 0.35 KSI | 11.34 KSI | 0.75 KSI |
| Short Beam Strength | 40.00 KSI | 1.83 KSI | 33.00 KSI | 2.51 KSI | 33.00 KSI | 2.51 KSI | 21.70 KSI | 4.74 KSI | |
| Fiber Content (%) mass Volume |
mf | 40% 21% |
36% 18 % |
47 % 26% |
35% 18 % |
||||
| Thickness | t | 0.126 in | 0.148 in | 0.116 in | 0.13S in | ||||