

Intelligent Asphalt Compaction Analyzer Phase I Progress Report
| Program: | Highways for LIFE Technology Partnerships Program |
|---|---|
| Project Title: | Intelligent Asphalt Compaction Analyzer |
| Period: | February 01, 2008 – December 31, 2008 |
| Submitted by: | Sesh Commuri, Associate Professor, University of Oklahoma, Norman on behalf of Haskell Lemon Construction Company Bob Lemon, Vice President Phone: (405) 947-6069; Email: BLemon@haskelllemon.com |
| Project Team: | Haskell Lemon Construction Company, Oklahoma City, OK University of Oklahoma, Norman, OK Volvo Road Machinery, Shippensburg, PA Engineering Services and Testing, Inc., Norman, OK |
| Submitted to: | Federal Highway Administration Office of Acquisition Management (HAAM) 1200 New Jersey Ave., SE, Washington, DC 20590 |
The development of a prototype Intelligent Asphalt Compaction Analyzer (IACA) and its testing during field compaction is described in this report. The IACA is a device based on Neural Network Technology that can measure the density of an asphalt pavement continuously in real-time during its construction. The IACA technology was developed at the University of Oklahoma (OU) and was tested to a limited extent in the field5. The refinement and field validation of the Intelligent Asphalt Compaction Analyzer (IACA) were addressed in Phase 0 (October-December 2007) of the project6 (Assistance Agreement DTFH61-08-G-0002).
The following are the summary results of this phase of the project:
- An Electronic Control Module (ECM) (IDAN from RTD Embedded Technologies) was selected and the IACA algorithm was implemented on this platform. The selected hardware is resistant to shock and vibration and is suited for use in off-road applications. The ECM also comes with a variety of drivers and library functions that allow the easy porting of the existing IACA application.
- The suitability and performance of the IDAN ECM was verified using vibration data collected during compaction on SH-99 at Seminole (see Phase 0 Progress Report6).
- The IDAN prototype was evaluated during the construction of asphalt pavements across Oklahoma. Five different construction sites were selected to verify the ability of the IACA to estimate the density of the asphalt mat during the compaction. The selected sites had different geomorphologies and covered a range from the construction of full-depth pavements to overlays and the compaction of multiple lifts of asphalt to simple overlay of a two inch surface course. The analysis of the densities measured from roadway cores and the estimates of the IACA indicate that after calibration, the IACA was able to estimate densities within 1.5% of the maximum theoretical density of the asphalt mix. This implies that the IACA can be used for evaluating the quality of compaction during the construction of asphalt pavements.
- An user interface and a display monitor have been developed that enables the operator to easily calibrate the IACA. The GUI also allows for rapid report generation for the project including as-built maps, spatial variation of the compacted density, and core locations and density measured from the cores. Pass by pass variations in density can also plotted to study the rolling pattern and the compaction quality.
- Manuals for calibration and evaluation of the IACA have been developed.
- Five sets of hardware have been purchased in order to implement five (5) IACA units for rigorous field testing during the Phase 2 of the project (February-December 2009). The team is actively working with Volvo Road Machinery to determine production platform, wiring harness, mounting brackets etc. for commercial release of the technology. It is anticipated that the manufacture of the IACA will commence in early 2010 after the successful completion of Phase 2 of the project.
The results of the Phase 1 of the project indicate that the IACA can estimate the density of the asphalt pavement with an accuracy that is suitable for quality control during the construction of the asphalt pavement. The prototype is rugged and can be produced at a cost that improves the commercial feasibility of the technology. Based on the results of Phase 1, the project team is ready to start the next phase of the project, i.e. the rigorous testing of five IACA units by construction crew as described in the Phase 2 of the proposal.
Disclaimer
The contents of this report reflect the views of the author, who is responsible for the facts and the accuracy of the data presented herein. The contents do not necessarily reflect the views of the University of Oklahoma, Volvo Road Machinery, EST Inc., or the Federal Highway Administration.
Table of Contents
- 1.0 Project Goals and Results
- 2.0 Results and Discussions
- 2.1 Selection of IACA hardware
- 2.2 Cost and Commercial Feasibility of the IACA
- 2.3 Field Use of the IACA
- 2.4 Construction of SH-62 in Blanchard, OK
- 2.5 Construction of I-35 near Purcell, OK
- 2.6 Construction of I-35 in Oklahoma City, OK
- 2.7 Construction of US-77 near Noble, OK
- 2.8 Construction of Tecumseh Road in Norman, OK
- 3.0 Project Goals and Anticipated Results for the Phase II (March 01 - January 31, 2009)
- 4.0 Current and Cumulative Costs for Phase I (February 01 - December 31, 2008)
- 5.0 Conclusions and Recommendations for Future Work
- References.
- List of Figures
- List of Tables
1.0 Project Goals and Results
The Intelligent Asphalt Compaction Analyzer (IACA)2, 4, 5 is a device based on Neural Network Technology that can measure the density of an asphalt pavement continuously in real-time during its construction. This technology was developed at the University of Oklahoma (OU) and was tested to a limited extent in the field. These field trials demonstrated that, after calibration, the IACA can measure the density in real-time with accuracy comparable to existing point-wise measurement technologies (e.g., a nuclear density gauge or a non-nuclear density gauge such as Transtech's PQI 301).
Prior to the start of this project, the IACA training and calibration techniques were performed manually, thereby limiting the utility of the IACA. Also, the IACA was implemented on a desktop computer making it unsuitable for prolonged use in the field. In order to prepare the technology for use in the field, the following steps were necessary. (i) Implement the IACA on a rugged platform that can withstand shock, vibration, and extreme temperatures; (ii) develop automated, simple to use calibration techniques; and (iii) validate the performance during exhaustive field testing. In Phase 0 of the project (October-December 2007), a procedure to automatically train and calibrate the IACA during compaction was demonstrated. This calibration procedure was also validated during the actual construction of asphalt pavement6.
The following were the goals for Phase 1 of the project (February-December 2008). These goals are the outcomes of the tasks, described in the Detailed Work Plan7, designed as part of the project schedule (see Figure 1).
- Determine an electronic platform that is tested to SAE J14558 standard to withstand vibrations and temperature variations encountered in heavy duty off-road applications. Port the IACA application to this platform and test functionality in the laboratory (Tasks T-2 and T-3).
- Incorporate temperature sensor, odometer, vibration switch, travel direction sensor, GPS sensor and test the commercial prototype during compaction in the field (Task T2-3).
- Demonstrate the functionality of the selected hardware platform both in the laboratory as well as in during compaction operations in the field (Task T2-4 and Milestone M2).
- Identify five sites for systematic testing of the IACA. The sites selected will be representative of typical construction encountered in the field and will involve full depth construction as well as rehabilitation of existing pavements. The sites will also be selected to cover different soil types to address varying liquid limit and plasticity indices.
- The performance of the IACA will be validated during the construction of the base, intermediate, and the surface layers of the asphalt pavement. The performance of the IACA will be evaluated at each of the sites, during the construction of each lift of asphalt for both full depth construction as well as during rehabilitation of existing pavements (Tasks T2-5 and T2-6).
- The experience gained during the field testing of the IACA will be leveraged to refine the IACA and develop user manuals, training procedures and other documentation (Task T2-6 and T2-7).
- The submission of the annual report to FHWA constitutes the milestone M3 of the project and indicates the culmination of Phase 1 of the study.
The following are the results of the Phase I of the project (February-December 2008).
- An Electronic Control Module (ECM) (IDAN from RTD Embedded Technologies) was selected and the IACA algorithm was implemented on this platform. The selected hardware is resistant to shock and vibration and is suited for use in off-road applications. The ECM also comes with a variety of drivers and library functions that allow the easy porting of the existing IACA application.
- The suitability and performance of the IDAN ECM was verified using vibration data collected during compaction on SH-99 at Seminole (see Phase 0 Progress Report6).
- An infrared temperature sensor, vibration switch, travel direction sensor, GPS sensor were integrated into the IACA application and automatic calibration scheme was incorporated. A user display was also developed so that the roller operator can monitor the progress of compaction in real time (see Figures 2 and 3). The commercial prototype was then tested during compaction in the field (Task T2-3)
- The IDAN prototype was evaluated during the construction of asphalt pavements across Oklahoma. Five different construction sites were selected to verify the ability of the IACA to estimate the density of the asphalt mat during the compaction. The selected sites had different geomorphologies and covered a range from the construction of full-depth pavements to overlays of existing pavement and from the compaction of multiple lifts of asphalt to simple overlay of a two inch surface course. The analysis of the densities measured from roadway cores and the estimates of the IACA indicate that after calibration, the IACA was able to estimate densities within 1.5% of the maximum theoretical density of the asphalt mix. This implies that the IACA can be used for evaluating the quality of compaction during the construction of asphalt pavements.
- A user interface and display monitor have been developed that enables the operator to easily calibrate the IACA (Figures 4-6). The GUI also allows for rapid report generation for the project including as-built maps, spatial variation of the compacted density, and core locations and density measured from the cores. Pass by pass variations in density can also plotted to study the rolling pattern and the compaction quality.
- Manuals for calibration and evaluation of the IACA have been developed.
- Five sets of hardware have been purchased in order to implement five (5) IACA units for rigorous field testing during the Phase 2 of the project (February-December 2009). The team is actively working with Volvo Road Machinery to determine production platform, wiring harness, mounting brackets etc. for commercial release of the technology. It is anticipated that the manufacture of the IACA will commence in early 2010 after the successful completion of Phase 2 of the project.
2.0 Results and Discussions
2.1 Selection of IACA hardware
The IACA concept was initially developed using xPC Target hardware from Mathworks. This platform was used because the Mathworks toolset (Matlab, Simulink, Real-Time workshop) supported rapid prototyping. The capabilities of the xPC target are listed in Table 1. While this platform provided the necessary convenience for prototype development and testing, it required two sets of hardware - one for data acquisition and another for implementing the IACA. This was unacceptable from a cost point of view (approximately $16,000). Further, the hardware was built along the configuration of a Desktop PC, making it unsuitable for prolonged use in the field.
Initially, a target platform (Tiger 555 module from Pathway Technologies, Ambler, PA, http://www.pathwaytechnologies.net) was identified as a suitable rugged ECM for the IACA application. The key factors influencing the choice were (i) the computational capability of the device as determined through product literature and discussions with the technical staff at Pathway, (ii) technical support for porting existing application to the new hardware, and (iii) cost of the hardware and support. While the porting and initial tests of the hardware indicated success, detailed testing showed that the hardware was not capable of meeting the performance requirements of the IACA application. As a result, the project team proceeded with the second option of testing the IDAN ECM (RTD Embedded Technologies, Inc., State College, PA, http://www.rtd.com). This system is similar in capabilities and configuration to the current prototype being used by the research team at OU but is twice as expensive as the Tiger 555 module ($5000 as compared to $2200).The suitability and performance of the IDAN ECM (Figure 2) was verified using vibration data collected during compaction on SH-99 at Seminole (see Phase 0 Progress Report6). The Celeron processor used in the IDAN module on the whole is computationally less powerful than the Intel Pentium III processor used in the research prototype. However, increased processor speed and onboard memory cache allow the IDAN module to out-perform the research prototype when the entire application is taken into account (see Table 1). In fact, when the entire application was ported onto the research prototype, the research prototype could only function at a sampling rate of 100 Hz. On the other hand, the application could run at the required rate of 1000 Hz. on the IDAN hardware.
An infrared temperature sensor kit (production hardware from Volvo Road Machinery), vibration switch, travel direction sensor, GPS sensor were integrated into the IACA application and automatic calibration scheme was incorporated. The IDAN prototype was evaluated during the construction of the base layer of a full depth pavement on SH-62 near Blanchard, OK. An user interface was developed to train the neural network and calibrate the IACA using the mix design information, and density measurements obtained from extracted cores or through the use of a hand held gauge (see Figure 4). The real-time readout of the density on the operator console (Figure 1) as well as the as-built maps (Figure 5) and the pass-by-pass density will provide the needed guidance to the roller operator and the construction crew in meeting the quality guidelines during construction.
2.2 Cost and Commercial Feasibility of the IACA
The components used in the implementation of the IACA have reduced the cost of the device by over 60% as compared to the research prototype. The research prototype while being unsuitable for the field operation still costs over $ 30,000 to build (differential GPS ($18,000), xPC Target ($8,000), Laptop Computer ($3,500), accelerometer ($600)). Further, the system was cumbersome to install and took over 30 minutes to initialize before operation.
In contrast, the current prototype costs about $10,000 to build (IDAN ($5,000), GPS receiver ($2,500), Tablet PC ($2,000), accelerometer ($300)). These costs are retail prices of the components when purchased off-the-shelf in small quantities. This cost can be further reduced when manufactured in large quantities. The current IACA setup can be installed and initialized in less than 5 minutes on any vibratory compactor.
2.3 Field Use of the IACA
The calibration of the IACA in the field is straightforward and the underlying technology, while complex, is totally invisible to the user. Raw calibration can be achieved using the target density from the mix design sheet and can be refined further using either densities measured from roadway cores or those obtained through the use of a hand held gauge3. The calibration is typically performed in the field at the start of the project during the construction of the control strip. However, calibration can be performed at any point during the construction of the pavement. The process requires the marking of the calibration stretch using GPS coordinates and takes less than 10 minutes to train the neural network in the IACA. When the density results from the extracted cores are available, the refinement of the calibration process is taken care of by the User Interface and is typically accomplished in less than a minute.
In case field calibration is not feasible, then the user has the option of using calibration parameters from a previous job as long as the site and construction details are similar between the two projects.
2.4 Validation of the IACA during the Construction of SH-62 in Blanchard, OK
The project involves the construction of 1.689 miles of US Highway 62, near Blanchard (see Figure 7) in McClain County, Oklahoma (State job # 13574(04), Project # STPY-044B(319)). The subgrade soil at this site consists mostly of Stephenville fine sandy loam, having two to five percent slopes (Soil Survey of McClain County7, Oklahoma, 1979). Typically, the surface layer is brown fine sandy loam (SC, SM, ML, CL) six inches thick and having liquid limit and plasticity index in the range of 0-30 and 0-10, respectively (Table 2). The subsoil is red sandy clay loam (SC, CL) to a depth of 36 inches, where liquid limit and plastic limit vary 25-37 and 7-16, respectively. The underlying material is red soft sandstone. (Soil Survey of McClain County7, Oklahoma, 1979).
2.4.1 Test Plan and Pavement Cross Section
The project involves the construction of a full depth asphalt pavement consisting of four driving lanes, a turn lane, and eight feet shoulders on either side of the road. The existing pavement is removed and an eight inch modified (15% fly ash) is first compacted. The pavement cross section is shown in Figure 8. Figure 9 shows the Test sites TS1, TS2, TS3, TS4, TS5. Figure 10 shows the schematic of the access road of SH-62 project with the Test sites TS6, TS7, and TS8. These test sites along with the associated construction details are shown in Table 3. The base consist of two 'three inches' type S3 (PG 64-22 OK) asphalt mix with a further three inches of intermediate layer of type S3 (PG 76-28 OK). Finally, a two inches of surface course of type S4 (PG 76-28 OK) asphalt mix is laid.
A 3.0 inch base layer is first laid on top of the compacted stabilized subgrade. The mix contained approximately 22 percent rock, 27 percent manufactured sand, 15 percent screenings, 11 percent natural sand, 25 percent recycled asphalt pavement, and 4.2 percent PG 64-22OK binder. This is followed by a second 3.0 inch lift of the same S3 PG 64-22 OK mix. The gradations of the mix are shown in Table 4. A third lift of ODOT S3 Recycle mix was placed at a thickness of approximately 3.0 inches on top of the compacted base layer. This mix contained approximately 21 percent rock, 40 percent manufactured sand, 11 percent screenings, 13 percent natural sand, 25 percent recycled asphalt pavement, and 4.4 percent PG 76-28OK binder. The gradations of the mix are shown in Table 5. The surface course (4th lift) consisted of a 2 inch S4 Recycle mix placed on top of the compacted intermediate layer. The mix contained approximately 25 percent chips, 44 percent manufactured sand, 16 percent screenings, 15 percent natural sand, and 4.9 percent PG 76-28OK binder. The gradations of the mix are shown in Table 6.
2.4.2 Test Results
The training and calibration procedure outlined in Phase 0 report* was evaluated during the compaction of each of the asphalt layers. During the calibration process, 6 cores were extracted from the finished pavement (Figure 11) and their density was measured in the Laboratory in accordance with AASHTO T-166 method. These measured densities were used to determine the slope and offset used to calibrate the IACA. After the calibration was complete, the performance of the calibrated IACA was evaluated the performance of the IACA was evaluated during the construction of a 100 feet section of the pavement. Three cores are extracted at random from the final roller pass on the compacted pavement and the measured density is compared against the density estimated by the IACA.
The results of the tests conducted on the base layer at locations TS1 and TS3 is shown in Table 7. It can be seen from this table that when the IACA is calibrated using densities measured from roadway cores, the resulting estimates closely reflect the actual compaction of the pavement. At the 12 core locations, the IACA readings show a mean error of -0.05% where the density is represented as a percentage of the Maximum Theoretical Density (MTD) of the mix. Further, the 95% Confidence Interval of the measurement error was found to be [-0.6,0.55] for the tests conducted on the base layer. Similarly, for the tests conducted on the second lift (3.0 inch S3 64-22OK mix) and the third lift S3 (S3 PG76-28OK mix) a mean error of 0.32% with a 95% Confidence Interval of [-0.6,0.5] was observed (Table 8). Table 9 shows the estimated and measured densities at 9 locations on the surface course (2.0 inch S4 PG 76-28OK mix). In case of the surface course, a mean error of -0.2% with a 95% Confidence Interval of [-1.0,0.5] was observed. In several instances where large errors were seen, for example core location S4 in Table 9, the density in the vicinity of the core also shoed significant variations (Figures 13, 14).
The performance of the IACA depends on proper calibration of the device prior to its use. Using just the mix parameters (i.e. target compaction of 95.6%) results in higher estimated densities (mean error of 1.41%). This is because the highest density measured during the calibration process was 93.4%. However, the system was calibrated using higher density estimate of 95.65 resulting in higher estimates for the density (Table 7). Similarly, using target densities of 95.1% for the intermediate and the surface courses resulted in mean estimation errors of 1.23% (2nd lift), 1.33 (3rd lift), and 1.56% (top lift).
The effect of using of calibration data from a different site is shown Table 10. In the tests conducted on May 30, 2008, the base layer showed regions of significant undercompaction. The highest density observed was 92.1%. As a consequence, using this data for calibration causes systematic underreporting of the densities as seen in Table 10.
2.5 Validation of the IACA during the Construction of I-35 near Purcell, OK
The project involves the construction of 3.016 miles of Interstate I-35 in McClain County, Oklahoma (State job # 20998(04), Project # IMY-0035-2(302)095) (Figure 15). The subgrade soil at this site primarily consists of grant silt loam, having two to five percent slopes (Soil Survey of McClain County7, Oklahoma, 1979). Typically, the surface layer is reddish brown silt loam (ML, CL, CL-ML) about ten inches thick, having liquid limit and plasticity index in the range of 20-30, and 1-10, respectively (Table 11). The upper part of the subsoil is reddish brown and red silty clay loam (ML, CL) to a depth of 44 inches, and the lower part is red silt loam to a depth of 65 inches. The liquid limit and the plasticity index in this zone vary from 30 to 43, and 8 to 20, respectively. The underlying material is red soft sandstone.
2.5.1 Test Plan and Pavement Cross Section
The pavement cross section is shown in Figure 16 and the test sites for each layer are shown in Table 12.
The project involves the milling and removal of existing north and south bound Interstate freeway. An eight (8) inch subgrade stabilized with 12% fly ash is first prepared. Two lifts of 4.5 inch type S2 (PG 64-22 OK) asphalt mix (Table 13) are then compacted on top of the aggregate base, followed by a 3.5 inch intermediate layer of type S3 (PG 76-28 OK) (see Table 14). Finally, a 2 inch surface course of type S4 (PG 76-28 OK) asphalt mix is laid (Table 15). The roadway consists of four driving lanes, a turn lane, and eight feet shoulders on either side of the road. The pavement cross section is shown in Figure 16.
The S2 mix used for the base course contained approximately 22 percent rock, 27 percent manufactured sand, 15 percent screenings, 11 percent natural sand, 25 percent recycled asphalt pavement, and 4.2 percent PG 64-22OK binder. The S3 mix (third lift) contained approximately 21 percent rock, 40 percent manufactured sand, 11 percent screenings, 13 percent natural sand, 25 percent recycled asphalt pavement, and 4.4 percent PG 76-28OK binder. The surface course (4th lift) contained approximately 25 percent chips, 44 percent manufactured sand, 16 percent screenings, 15 percent natural sand, and 4.9 percent PG 76-28OK binder.
2.5.2 Test Results
The results of the tests conducted on the base layer at location TS-4 is shown in Table 16. It can be seen that when the IACA is calibrated using densities measured from roadway cores, the resulting estimates closely reflect the actual compaction of the pavement. At the 9 core locations, the IACA readings show a mean error of 0.1% where the density is represented as a percentage of the Maximum Theoretical Density (MTD) of the mix. Further, the 95% Confidence Interval of the measurement error was found to be [-0.31,0.44] for the tests conducted on the base layer. Similarly, for the tests conducted on the second lift (4.5 inch S2 64-22OK mix) a mean error of 0.0% with a 95% Confidence Interval of [-0.46,0.46] was observed (Table 17). The results of the validation tests on the third lift (3.5 inch S3 PG 76-28OK) are shown in Table 18. Here, again, it can be seen that the mean estimation error was -0.2% with a 95% Confidence Interval of [-0.6,0.24]%. Table 19 shows the estimated and measured densities at 9 locations on the surface course (2.0 inch S4 PG 76-28OK mix). In case of the surface course, a mean error of 0.0% with a 95% Confidence Interval of [-0.33,0.33] was observed.
2.6 Validation of the IACA during the Construction of I-35 in Oklahoma City, OK
The project involves the construction of approximately 4.5 miles of Interstate I-35 in Oklahoma County, Oklahoma (State job # 20998(04), Project # IMY-0035-2(302)095) (Figure 17). The subgrade soil at this site primarily consists of ashport silt loam, with a very mild (0-1%) slope (Soil Survey of Oklahoma County7, Oklahoma, 2007). Typically, the surface layer is reddish brown silt loam (ML, CL, CL-ML), about ten inches thick. The liquid limit and plasticity index are in the range of 22-37, and 2-13, respectively (Table 20). The upper part of the subsoil is reddish brown silty clay loam (CL) to a depth of 64 inches; the liquid limit and the plasticity index in this zone vary from 30 to 43, and 8 to 20, respectively. Moreover, a different zone of subgrade soil exists along the length of the road, and the subgrade soil in this region consists of miller silty clay, with 0-10 % slopes. The subgrade layer in this region consists of reddish brown silty clay (CH, CL) to a depth of 12 inches, having a liquid limit and a plasticity index of 41-60 and 18-35, respectively. Subsurface consists of reddish brown silty clay to a depth of 84 inches. The liquid limit and plasticity index of the soil at this depth range from 35-60 and 15-35, respectively.
2.6.1 Test Plan and Pavement Cross Section
The pavement cross section is shown in Figure 18 and the test sites for each layer are shown in Figure 19. The project involves the cold milling and removal of 3.0 inches of existing pavement. A 2 1/4 inch overlay of S3 (PG 76-28OK, see Table 21) mix is first compacted followed by a 2.0 inch S4 (PG 76-28OK, see Table 22) surface course. The test locations are shown in Figure 19 where the calibration for the first lift was done at location TS-1 and the validation was done both at TS-1 and TS-2. The calibration for the surface course was performed at TS-3 and the validation was performed at locations TS-3 and TS-4. Since I-35 is a heavily travelled arterial freeway, the construction was done during the night. A stretch of the pavement would be milled and removed starting 8:00 p.m. The asphalt mix would be compacted between 11:00 p.m. and 3:00 a.m. and the roadway would be open to traffic by 6:00 a.m. in the morning. The importance of the I-35 freeway to the national commerce severely restricted the total number of cores that could be extracted for validation. Further, since the construction had to proceed at a fast pace, the number of readings that could be taken with a nuclear density gauge were also limited.
2.6.2 Test Results
The results of the tests conducted on the first lift are shown in Table 23.and 24. The data from core locations R2, R5 and R8 were used to calibrate the IACA. The validation was done using data from core locations F1-F5. It can be seen that the IACA readings show a mean error of -0.66% with a 95% Confidence Interval of the [-1.38, 0,06]. On the surface course, it was not possible to extract roadway cores. The validation was therefore done using a nuclear density gauge. From Table 24, it can be seen that the IACA estimates compare well with those obtained using a nuclear density gauge.
2.7 Validation of the IACA during the Construction of US-77 near Noble, OK
The project involves the overlay of approximately 7.3 miles of US-77 Highway near Noble, Oklahoma (Figure 20). The subgrade soil at this site is similar to that of I-35 site near Purcell in McClain County.
2.7.1 Test Plan and Pavement Cross Section
The pavement cross section is shown in Figure 21. The project involves the cold milling and removal of the existing pavement and first compacting a 3/4 inch leveling course 0f S5 (PG 70-28OK) mix (see Table 25) followed by a 1 1/4 inch overlay using the same S5 mix.
2.7.2 Test Results
The results from this site are shown in Table 26. For the construction on US-77, the project team was not allowed to extract any roadway cores for testing. However, the testing and validation was done using a nuclear density gauge. From the results in Table 26, it can be seen that the mean error between the nuclear density readings and the IACA estimates was 0.2% with a 95% Confidence interval of [-0.7, 1.1]. From Table 26, it can be seen that the IACA estimates compare well with those obtained using a nuclear density gauge. The average error between a nonnuclear density gauge and the nuclear density readings was 1.9% (95% Confidence interval of [0.58, 3.22].
2.8 Validation of the IACA during the Construction of Tecumseh Road in Norman, OK
The project involves the construction of 1.881 miles of two lane road in Cleveland County, Oklahoma (State job # 14391(04), Project #STPY-014B(378)) (see Figure 22). The subgrade soil at this site primarily consists of Renfrow silty clay loam, with 1 to 5 % slopes (Soil Survey of Cleveland County7, Oklahoma, 1987). Typically the surface layer is dark grayish brown silty clay loam (CL) about 5 inches thick, liquid limit and plasticity index varying from 33-49 and 12-26, respectively (Table 6). The subsoil is brown silty clay loam (CL) to a depth of about 9 inches, having a liquid limit of 37-49 and a plasticity index of 15-26. There is reddish brown silty clay (CL, CH) to a depth of about 27 inches, and red silty clay to a depth of about 73 inches. The soil in this region has liquid limit and plasticity index in the range of 37-70 and 15-38 respectively. The underlying material is red and light gray, weakly laminated, calcareous siltstone and shale to a depth of 80 inches or more (Table 27).
2.8.1 Test Plan and Pavement Cross Section
The project involves the construction of an undivided two lane extension of Tecumseh Road between NW 12th Avenue and NE 12th avenue in Norman, Oklahoma. The construction involves clearing the vegetation and stripping the top soil and re-spreading the soil to achieve the desired slope. Approximately fifty five feet of the subgrade is modified with 12% fly ash to a depth of eight inches and is then compacted. The modified subgrade is then sealed by an application of prime coat and a base layer compacted using a type S2 (PG 64-22 OK) asphalt mix. This is followed by the construction of a four inch intermediate lift using type S3 (PG 70-28 OK) asphalt mix and surfaced with a two inch type S2 (PG 70-28 OK) asphalt mix. Each driving lane is 12 feet wide and the shoulder is 14 feet wide. Left turn lanes of 12 feet width are also constructed on select sections of the road. The pavement cross section is shown in Figure 23.
2.8.2 Test Results
The delays in identifying the prototype in Task T2-1 and the delayed start of the Phase 1 of the project resulted in Milestone M2 being met in early May, a delay of almost two months. To compound the problem, Haskell Lemon Construction Company had several changes to their work order which resulted in the project getting delayed by several months. As a consequence, the validation of the IACA could only be done during the construction of the base layer. The gradations of the mix used for the base course is shown in Table 28 and the results of the tests are shown in Table 29. It can be seen that the IACA readings show a mean error of -0.4% with a 95% Confidence Interval of the [-1.05, 0.26]%. Using a nuclear density gauge for calibration would have resulted in an average error of -0.3% with a 95% Confidence Interval of the [-0.99, 0.36]%.
3.0 Project Goals and Anticipated Results for the Phase II (March 01 - January 31, 2009)
In Phase II of the project, a total of five IACA units will be developed and installed on different vibratory compactors owned by Haskell Lemon (Task T3-1). Operators would be trained on the calibration and use of the technology (Task T3-2). The performance of the units in the field will be studied over a period of 10 months (Task T3-3 and Task T3-4). Comparative studies will also be conducted on the quality of construction with and without the use of the developed IACA technology. The impact of the technology on the productivity of the crew will also be analyzed. In this phase of the research, the team will coordinate the activities very closely with the contractor and with the Oklahoma Department of Transportation. It is anticipated that Volvo Road Machinery will assume supervisory role to a large extent in the execution of this stage of research. The successful validation of the technology will constitute Milestone M4 for the project. The submission of the final report detailing the research activity, performance data, and analysis would wrap up the project.
3.1 Project Goals for Phase 2
The following are the goals for this phase of the project:
- Build 5 prototype units and test their functionality in the lab. Install the tested units on test compactors.
- Coordinate with FHWA and Volvo Road Machinery for field training and demonstration of the IACA.
- Validation of the IACA during construction of asphalt pavements across Oklahoma. Perform statistical sampling to estimate accuracy of the measured densities. Identify key factors affecting the performance of the IACA. Refine the implementation if necessary to account for variability in the field.
- Study the variability in the calibration between sites.
- Determine variation between minimum and maximum density achieved over 100 feet of construction with and without the use of IACA.
- Repeat step (d) at each construction site.
3.2 Identification of Probable Sites and Readiness Assessment
The project team will instrument two rollers with the IACA technology for exclusive use on the I-35 widening project starting in March 2009. During this construction, Interstate I-35 would be expanded from four lanes to six lanes (eight in some areas) from main street in Norman to Indian Hills road 3 miles north on Norman. (http://www.normantranscript.com/localnews/local_story_005165924.html). This will enable the project crew to map the complete project end-to-end. Negotiations are also underway with regional Departments of Transportation (DoTs) to independently test the IACA between the months of May and November 2009. The project team is working with Volvo Road Machinery to identify a contractor/site in Florida for testing the IACA during compaction of rubberized asphalt mixes. Further sites will be identified over the next several weeks.
A training seminar is planned for March/April 2009 to train roller operators on the use of the technology. VRM has already released funds for the purchase of 5 prototype units with the associated sensors, display units, and wiring harness. These units have already been procured and tested. The project team is currently working on fixtures for the display and mounting requirements for the IACA. The project team is also coordinating with VRM to identify production hardware and the tentative plans call for productization in early 2010.
4.0 Current and Cumulative Costs for Phase I (February 01 - December 31, 2008)
This phase of the project covers the work done between the months of February and December 2008. The cumulative cost for this period was $298, 733.59 and covers the salaries of the investigators, project staff and students ($236, 755.04), student tuition ($17,560.83), travel ($4, 378.53) and the cost of supplies and project materials ($40,039.19). Of this total cost, an amount equaling $196, 843.63 was provided by Volvo Road Machinery (formerly Ingersoll Rand Road Development) as cost share towards the project and $95,571.60 was provided by FHWA and the remaining ($6, 318.36) was provided as cost share by the University of Oklahoma. The detailed budget is shown in Tables 33-36.
5.0 Conclusions and Recommendations for Future Work
This report addressed the field evaluation of the Intelligent Asphalt Compaction Analyzer across several construction sites in Oklahoma. During these evaluations, the ease of calibrating the IACA and the accuracy of measurements were studied in comparison to densities measured from roadway cores extracted after compaction of each lift of the pavement. The conclusions of the Phase I of the study are summarized below.
- The calibration procedures developed1, 3, 6 are easy to use and the calibrated IACA can estimate the density of the asphalt mat in real-time with an accuracy suitable for quality control in the field. In all cases, the project team was able to install the IACA on the contractor's machine with minimal disruption to the daily schedule. While the IACA was operating in real-time, the roller operator did not have access to the data.
- Test results show that the density estimated by the IACA compares well with the density measured from roadway cores. Results from the Five (5) test sites indicate that the mean error between the IACA measurement and the actual density as measured form the core is less than 1 pcf (pound-per-cubic-feet) with a 95% confidence interval of less than 3 pcf.
- The Compaction Monitor (Figure 2) that was developed serves as a user interface and displays the GPS position of the roller, the estimated density, the temperature of the mat. The output of the IACA during compaction can be saved to a "data log" that can be used to determine density at specified locations on the road. In addition to this, the data in the log can be processed to generate as-built maps that can serve as a record of the quality of construction (Figures 4-6).
- The variation in density across the drum is shown in Tables 30-32. It is generally observed that the portion of the pavement closer to an unrestrained shoulder of the pavement has lower density compared to portions of the pavement closer to the center lane or a restraining edge. The IACA, however, estimates an average density typically between these two values. The variation is less pronounced if the pavement under construction has a restraining edge on both sides (milling and in-place overlay on I-35 in Oklahoma City, OK).
- Proper calibration is essential to the accuracy of the estimates generated by the IACA. If the control strip demonstrated low compaction, then calibration of the IACA with this data will limit the ability of the IACA to estimate higher levels of compaction.
- Several issues were identified during the evaluation of the IACA. The field use of the IACA should take into account all the intricacies and uncertainties of field work. These uncertainties could result due to variations in the subgrade (rehabilitation projects), seasonal variations in weather, or variability in the mix, etc.
- The IACA was rigorously evaluated at several construction sites involving overlay of base, intermediate, and surface courses, as well as the construction of full-depth asphalt pavements across the state of Oklahoma. In all these sites, the calibration parameters were found to be significantly different between each asphalt layer. Further, the calibration parameters are different from machine to machine. Thus, at this time, there is not easily portable set of calibration parameters that will work for all machines at all sites. Even for the same machine, attaining good compaction level during calibration is a key to getting accurate measurements by the IACA.
- The effect of undercompacted subgrade was investigated to a limited extent during the construction of SH-62 near Blanchard, OK. It was found that compaction over an undercompacted asphalt layer resulted in lower levels of compaction.
- Variations in the geomorphology over the project extant and the effect on the measurement accuracy have to be further investigated.
- The density measurements have been found to be dependent on the proper functioning of the compactor. In instances where the 'auto rotate' feature was malfunctioning, the density estimates during the backwards motion of the compactor was found to be significantly lower (typically 1.5%) than the density measured off the cores.
- The advantage of having real-time access to the density reading on the overall compaction quality has to be studied. Further, the impact of the technology on the productivity of the crew and the safety of the personnel also has to be studied. These will be the focus for Phase II of the project.
References
- Commuri, S., Mai, A.T., Zaman, M., (2009). "Calibration Procedures for the Intelligent Asphalt Compaction Analyzer, " Journal of Road Materials and Pavement Design, January 2009 (under review).
- Commuri, S., Mai, Anh T. , and Zaman, M., (2009). "Neural Network-based Intelligent Compaction Analyzer for Estimating Compaction Quality of Hot Asphalt Mixes, " ASCE Journal of Construction Engineering and Management, (to appear 2009). Also http://hotnsour.ou.edu/commuri/Intelligent_Compaction_files/ASCE2008.pdf
- Commuri, S., (2008). "Calibration Procedures for the Intelligent Asphalt Compaction Analyzer", invention disclosure 09NOR001, University of Oklahoma , Norman, OK, July 2008.
- Commuri, S., and Zaman, M., (2008). "Neural Network Based Compaction Analyzer for Density Measurement during the Construction of an Asphalt Pavement, " International Journal of Pavement Engineering, 9:3, pages 177-188, June 2008. http://hotnsour.ou.edu/commuri/Intelligent_Compaction_files/IJPE_Commuri_2006.pdf
- Commuri, S. and Zaman, M., (2007). "Final Report - Intelligent Asphalt Compaction Analyzer, " submitted to Oklahoma Center for the Advancement of Science and Technology (OCAST).
- Haskell Lemon Construction Company, (2008). "Phase 0 progress report for agreement DTFH61-08-G-0002, " submitted to Highways for LIFE Program Technology Partnerships Program, Federal Highway Administration, Washington , D.C.
- Haskell Lemon Construction Company, (2008). "Detailed work plan for assistance agreement DTFH61-08-G-0002, " submitted to Highways for LIFE Program Technology Partnerships Program, Federal Highway Administration, Washington , D.C.
- J1455 (2006). "Recommended Environmental Practices for Electronic Equipment Design in Heavy-Duty Vehicle Applications, " SAE International. http://www.sae.org/technical/standards/J1455_200606
List of Figures
| Figure 1. | Tentative schedule for the development of a commercial prototype of the IACA |
| Figure 2. | IACA setup showing the ECM, GPS receiver and display monitor |
| Figure 3. | Wiring schematic for the IACA |
| Figure 4. | Graphical User Interface for the calibration of the IACA and report generation |
| Figure 5. | As-built map generated by IACA application |
| Figure 6. | Final compacted density with core location nd density |
| Figure 7. | Test site location 1 on Highway US-62 in Blanchard, OK |
| Figure 8. | Cross section of the pavement (US-62) at Blanchard, OK |
| Figure 9 | Plan schematic of SH-62 project with the test locations marked |
| Figure 10. | Plan Schematic of SH-62 project with the test locations TS6, TS7, TS8. |
| Figure 11. | Selection of core locations after the final pass of the roller |
| Figure 12. | Comparison of the IACA estimated densities with measurements obtained from cores extracted from the pavement |
| Figure 13. | Analysis of the error between the core and estimated density |
| Figure 14. | Density variation in the vicinity of core S4 |
| Figure 15. | Test site location 2 on I-35 near Purcell, OK |
| Figure 16. | Cross section of the pavement at I-35 at Test site location 2 (Purcell) |
| Figure 17. | Test site location 3 on I-35 in Oklahoma City, OK |
| Figure 18. | Cross section of the pavement (I-35) in Oklahoma City, OK |
| Figure 19. | Plan schematic of I-35 OKC project with the test sites TS1, TS2, TS3, TS4 |
| Figure 20. | Test site location 4 on US-77 in Noble, OK |
| Figure 21. | Cross section of the pavement (US-77) in Noble, OK |
| Figure 22. | Test site location 5 (Tecumseh Road) in Norman, OK |
| Figure 23. | Cross section of the pavement (Tecumseh Road) in Norman, OK |
List of Tables
| Table 1. | Performance comparison of the Research Prototype and IDAN ECM: Task 1 – data logging only; Task 2 – data logging and IACA application |
| Table 2 | Engineering properties and soil classification (SH-62 in Blanchard, OK) |
| Table 3. | Test Site SH-62 |
| Table 4. | Gradation for Mix S3 (PG 64-22 OK) SH-62 |
| Table 5. | Gradation for Mix S3 (PG 76-28 OK) SH-62 |
| Table 6. | Gradation for Mix S4 (PG 76-28 OK) SH-62 |
| Table 7. | IACA Validation Results SH-62 Blanchard, OK (Base Layer) |
| Table 8. | IACA validation results SH-62 Blanchard, OK (Intermediate Layers) |
| Table 9. | IACA validation results SH-62 Blanchard, OK (Surface Course) |
| Table 10. | Effect of calibration on estimated densities |
| Table 11. | Engineering properties and soil classification (I-35, North of Purcell) |
| Table 12. | Test sites on I-35 at Purcell, OK |
| Table 13. | Gradation for mix S2 (PG 64-22 OK) I-35 Purcell |
| Table 14. | Gradation for mix S3 (PG 76-28 OK) I-35 Purcell, OK |
| Table 15. | Gradation for mix S4 (PG 76-28 OK) I-35 Purcell, OK |
| Table 16. | IACA validation results I-35 Purcell, OK (Base Layer) |
| Table 17. | IACA validation results I-35 Purcell, OK (Second Lift) |
| Table 18. | IACA validation results I-35 Purcell, OK (Third Lift) |
| Table 19 | IACA validation results I-35 Purcell, OK (Surface Course) |
| Table 20. | Engineering properties and soil classification (I-35 in OKC) |
| Table 21. | Gradation for mix S3 (PG 64-22 OK) used on I-35 in OKC |
| Table 22. | Gradation for mix S4 (PG 76-28 OK) used on I-35 in OKC |
| Table 23 | IACA estimated densities on the base layer on I-35 (OKC) |
| Table 24. | Estimated densities on the intermediate layer and top layer of I-35 (OKC) |
| Table 25. | Gradation for mix S5 (PG 70-28 OK) used at US-77 in Noble, OK |
| Table 26. | IACA estimated densities on the surface course of US-77 at Noble, OK |
| Table 27. | Engineering properties and soil classification at Tecumseh Road in Norman, OK |
| Table 28. | Gradation for mix S2 (PG 64-22 OK) used on Tecumseh Road in Norman, OK |
| Table 29. | IACA estimated densities during the construction of the base course (S2 PG 64-22 OK) on Tecumseh Road |
| Table 30. | Variation in density laterally across the pavement at a given location |
| Table 31. | Variation in density measured by nuclear gauge laterally across the pavement at a given location |
| Table 32. | Variation in density measured by a non-nuclear gauge laterally across the pavement at a given location |
| Table 33. | Itemized Budget For Q1-08 January 01, 2008 – March 31, 2008 |
| Table 34. | Itemized Budget For Q2-08 April 01, 2008 – June 30, 2008 |
| Table 35. | Itemized Budget For Q3-08 July 01, 2008 – September 30, 2008 |
| Table 36. | Itemized Budget For Q4-08 October 01, 2008 – December 31, 2008 |
Tables
| Research Prototype based on xPC Target Box | IACA Prototype based on IDAN from RTD Technologies | |
|---|---|---|
| CPU | Intel Pentium III 266 MHz | Intel Celeron 650 MHz |
| RAM | 128MB, 32 MB (Flash) | 256 MB |
| Hard Drive | None | 1 GB (Flash) |
| I/O Device | CAN, Ethernet, RS232 | CAN, Ethernet, RS232 |
| Analog Input | 16 single-ended, 8 differential channels | 16 single-ended, 8 differential channels |
| Analog Output | 4 channels | 2 channels |
| Digital I/O | 8-bit, 8 channels | 8-bit, 8 channels |
| AD Converter | 16-bit,5 microsecond, at 200 kHz | 12-bit, 2 microsecond, at 500 kHz |
| DA Converter | 12-bit | 12-bit |
| Execution Time - Task 1 | 8.848x10⁻⁶(s) at 1000Hz | 1.021x10⁻⁵(s) at 1000Hz |
| Execution Time - Task 2 | Cannot run at 1000Hz, and 3.188x10⁻⁴(s) at 100Hz |
6.881x10⁻⁵(s) at 1000Hz |
| Soil Name | Depth (in) | USDA Texture | Classification | Percentage Passing (Sieve No.) | Liquid Limit (%) | Plasticity Index (%) | ||||
|---|---|---|---|---|---|---|---|---|---|---|
| Unified | AASHTO | 4 | 10 | 40 | 200 | |||||
| Stephenville | 0-12 | Fine sandy loam | SM, SC, ML, CL | A-4 | 100 | 98-100 | 94-100 | 36-60 | < 30 | NP-10 |
| 12-36 | Fine sandy loam, sandy clay loam | SC, CL | A-4, A-6 | 100 | 98-100 | 90-100 | 36-65 | 25-37 | 7-16 | |
| 36-40 | Weathered bedrock | ---- | --- | ---- | --- | ---- | --- | ---- | --- | |
| Section | Bound | Lane | Layer |
|---|---|---|---|
| TS-1 | West HW 62 | Driving lane | Base |
| TS-2 | West HW 62 | Driving lane | Intermediate |
| TS-3 | West HW 62 | Driving lane | Base |
| TS-4 | West HW 62 | Passing lane | 2nd |
| TS-5 | West HW 62 | Passing lane | 3rd |
| TS-6 | West HW 62 | Side of HW 62 | 2nd |
| TS-7 | West HW 62 | Side of HW 62 | 3rd |
| TS-8 | West HW 62 | Side of HW 62 | Top |
| Sieve Size | Job Formula (% Passing) |
|---|---|
| 1" | 100 |
| 3/4" | 95 |
| 1/2" | 82 |
| 3/8" | 77 |
| No. 4 | 56 |
| No.8 | 38 |
| No.16 | 28 |
| No.30 | 22 |
| No.50 | 14 |
| No.100 | 7 |
| No.200 | 3.5 |
| Sieve Size | Job Formula (% Passing) |
|---|---|
| 1" | 100 |
| 3/4" | 97 |
| 1/2" | 87 |
| 3/8" | 79 |
| No. 4 | 58 |
| No.8 | 39 |
| No.16 | 28 |
| No.30 | 21 |
| No.50 | 15 |
| No.100 | 5 |
| No.200 | 2.7 |
| Sieve Size | Job Formula (% Passing) |
|---|---|
| 3/4" | 100 |
| 1/2" | 94 |
| 3/8" | 87 |
| No. 4 | 69 |
| No.8 | 46 |
| No.16 | 31 |
| No.30 | 24 |
| No.50 | 16 |
| No.100 | 6 |
| No.200 | 3.3 |
| F1 | F2 | F3 | F4 | F5 | F6 | F7 | F8 | F9 | F10 | F11 | F12 | |
|---|---|---|---|---|---|---|---|---|---|---|---|---|
| PQI Measurement | 92.1 | 92.7 | 93.4 | 93.2 | 92.9 | 92.1 | 92.8 | 93.2 | 93.5 | 93.4 | 93.4 | 93.8 |
| Core Density | 90.3 | 90.6 | 91.7 | 92.2 | 91.5 | 89.7 | 90.8 | 90.5 | 91.6 | 91.3 | 90.5 | 91.1 |
| IACA (Raw) | 91.3 | 92.3 | 92.5 | 91.2 | 92.5 | 92.4 | 92.5 | 93.2 | 92.8 | 92.8 | 92.6 | 92.6 |
| IACA (Core) | 90.2 | 90.9 | 91.0 | 90.1 | 91.0 | 91.0 | 91.0 | 91.5 | 91.2 | 91.2 | 91.1 | 91.1 |
| IACA(Raw) - Core | 1 | 1.7 | 0.8 | -1 | 1 | 2.7 | 1.7 | 2.7 | 1.2 | 1.5 | 2.1 | 1.5 |
| IACA (Core) - Core | -0.1 | 0.3 | -0.7 | -2.1 | -0.5 | 1.3 | 0.2 | 1.0 | -0.4 | -0.1 | 0.6 | 0.0 |
Mean error = -0.05%; 95% Confidence Interval = [-0.6,0.55] %
| Location | Core | IACA | PQI | IACA-CORE |
|---|---|---|---|---|
| C1 | 93.3 | 94.4 | 92.8 | 1.1 |
| C2 | 93.9 | 94.5 | 92.6 | 0.6 |
| C3 | 93.9 | 95.1 | 93.1 | 1.2 |
| V1 | 93.5 | 93.5 | 91.7 | 0 |
| V2 | 93.7 | 93.7 | 92.7 | 0 |
| V3 | 94.6 | 94.0 | 93.6 | 0.6 |
| V4 | 94.6 | 93.5 | 93.5 | 1.1 |
| V5 | 94.0 | 94.5 | 92.9 | -0.5 |
| V6 | 93.2 | 94.3 | 92.3 | -1.2 |
Mean error = 0.32%; 95% Confidence Interval = [-0.6,0.5] %
| Location | Core | IACA | PQI | IACA - Core |
|---|---|---|---|---|
| S1 | 90.6 | 92.0 | 92.5 | 1.4 |
| S2 | 91.4 | 91.9 | 93.5 | 0.5 |
| S3 | 91.4 | 92.6 | 92.9 | 1.2 |
| S4 | 92.4 | 90.7 | 93.6 | -1.7 |
| S5 | 91.9 | 90.4 | 93.5 | -1.5 |
| S6 | 91.6 | 90.6 | 93.9 | -1.0 |
| S7 | 91.3 | 90.8 | 93.6 | -0.5 |
| S8 | 90.6 | 90.9 | 93.4 | 0.3 |
| S9 | 92.0 | 91.2 | 93.2 | -0.8 |
Mean error = -0.2%; 95% Confidence Interval = [-1.0,0.5] %
| C1 | C2 | C3 | C4 | C5 | T1 | T2 | T3 | T4 | T5 | |
|---|---|---|---|---|---|---|---|---|---|---|
| Core Density | 92.0 | 90.9 | x | 93.6 | 92.3 | 93.8 | 93.8 | 93.3 | 93.2 | 94.0 |
| LACA (Core) | 91.0 | 91.2 | x | 92.6 | 92.9 | 92.7 | 92.9 | 92.5 | 93.2 | 93.9 |
| Error | -1.0 | 0.3 | x | -1.0 | 0.6 | -1.1 | -0.9 | -0.8 | 0.0 | -0.1 |
| Use Base 5/30/2008 | 89.5 | 89.3 | 89.5 | 89.9 | 90.5 | 90.5 | 90.2 | 91.3 | 90.7 | |
| Error | -2.5 | -1.6 | -4.1 | -2.4 | -3.3 | -3.3 | -3.1 | -1.9 | -3.3 |
| Soil Name | Depth (in) | USDA Texture | Classification | Percentage Passing (Sieve No.) | Liquid Limit (%) | Plasticity Index (%) | ||||
|---|---|---|---|---|---|---|---|---|---|---|
| Unified | AASHTO | 4 | 10 | 40 | 200 | |||||
| Grant | 0-10 | Silt loam | ML, CL, CL-ML | A-4, A-6 | 100 | 100 | 90-100 | 70-90 | 20-30 | 1-10 |
| 10-65 | Silt loam, Loam, Silty clay loam | ML-CL | A-4, A-6, A-7 | 100 | 100 | 90-100 | 70-90 | 30-43 | 8-20 | |
| 65-75 | Weathered bedrock | ---- | --- | ---- | --- | ---- | --- | ---- | --- | |
| Section | Bound | Lane | Layer |
|---|---|---|---|
| TS-1 | I-35 Purcell (Towards Purcell) | Driving lane | 2nd |
| TS-2 | I-35 Purcell (Towards Purcell) | Driving lane | 3rd (Intermediate) |
| TS-3 | I-35 Purcell (Towards Purcell) | Passing Lane | 3rd (Intermediate) |
| TS-4 | I-35 Purcell (Towards Purcell) | Passing lane | Base |
| TS-5 | I-35 Purcell (Towards Purcell) | Passing lane | Top |
| Sieve Size | Job Formula (% Passing) |
|---|---|
| 3/2" | 100 |
| 1" | 96 |
| 3/4" | 87 |
| 1/2" | 75 |
| 3/8" | 68 |
| No. 4 | 50 |
| No.8 | 33 |
| No.16 | 23 |
| No.30 | 18 |
| No.50 | 11 |
| No.100 | 5 |
| No.200 | 2.9 |
| Sieve Size | Job Formula (% Passing) |
|---|---|
| 3/4" | 100 |
| 1/2" | 98 |
| 3/8" | 87 |
| No. 4 | 64 |
| No.8 | 42 |
| No.16 | 28 |
| No.30 | 20 |
| No.50 | 12 |
| No.100 | 5 |
| No.200 | 2.9 |
| Sieve Size | Job Formula (% Passing) |
|---|---|
| 1" | 100 |
| 3/4" | 98 |
| 1/2" | 87 |
| 3/8" | 80 |
| No. 4 | 62 |
| No.8 | 40 |
| No.16 | 27 |
| No.30 | 20 |
| No.50 | 12 |
| No.100 | 5 |
| No.200 | 2.8 |
| Location | Core | IACA | PQI | Error (IACA- Core) |
|---|---|---|---|---|
| W1 | 94.4 | 93.7 | 94.6 | -0.7 |
| W2 | 94.3 | 94.6 | 95 | 0.3 |
| W3 | 94.0 | 94.2 | 95.5 | 0.2 |
| W4 | 92.5 | 93.0 | 93.9 | 0.5 |
| W5 | 92.1 | 92.7 | 93.8 | 0.6 |
| W6 | 93.3 | 94.0 | 94.5 | 0.7 |
| W7 | 93.3 | 93.8 | 94.3 | 0.5 |
| W8 | 93.8 | 93.6 | 95.0 | -0.2 |
| W9 | 95.2 | 94.0 | 95.3 | -1.2 |
Mean error = 0.1%; 95% Confidence Interval = [-0.31, 0.44] %
| Location | Core | IACA | PQI | Error (IACA - Core) |
|---|---|---|---|---|
| M1 | 91.7 | 91.6 | 93.2 | -0.1 |
| M2 | 91.8 | 90.6 | 94.8 | -1.2 |
| M3 | 91.9 | 92.2 | 94.2 | 0.3 |
| M4 | 92.1 | 92.0 | 94.4 | -0.1 |
| M5 | 91.7 | 92.4 | 93.9 | 0.7 |
| M6 | 91.4 | 91.0 | 94.2 | -0.4 |
| M7 | 91.4 | 92.0 | 94.5 | 0.6 |
Mean error = 0.0%; 95% Confidence Interval = [-0.46, 0.46] %
| Location | Core | IACA | PQI | Error (IACA - Core) |
|---|---|---|---|---|
| T1 | 92.9 | 92.8 | 93.9 | -0.1 |
| T2 | 92.8 | 92.7 | 93.0 | -0.1 |
| T3 | 92.2 | 92.5 | 93.7 | 0.3 |
| T4 | 92.1 | 92.8 | 92.7 | 0.7 |
| T5 | 92.7 | 92.8 | 93.3 | 0.1 |
| T6 | 92.4 | 92.7 | 92.8 | 0.3 |
| T7 | 92.7 | 92.8 | 92.8 | 0.1 |
| W1 | 89.1 | 90.2 | 94 | 1.1 |
| W2 | 90.1 | 89.4 | 94.9 | -0.7 |
| W3 | 90.8 | 90.3 | 94.1 | -0.5 |
| W4 | 90.9 | 89.4 | 94.9 | -1.5 |
| W5 | 90.8 | 89.3 | 94.8 | -1.5 |
| W6 | 90.6 | 90.0 | 93.2 | -0.6 |
Mean error = -0.2%; 95% Confidence Interval = [-0.6, 0.24] %
| Location | Core | IACA | PQI | Error (IACA - Core) |
|---|---|---|---|---|
| R1 | 91.9 | 92.5 | NA | 0.6 |
| R2 | 92.2 | 92.0 | NA | -0.2 |
| R3 | 92.0 | 91.9 | NA | -0.1 |
| R4 | 92.3 | 92.5 | NA | 0.2 |
| R5 | 93.1 | 92.1 | NA | -1.0 |
| R6 | 92.0 | 92.5 | NA | 0.5 |
| R7 | 92.3 | 92.6 | NA | 0.3 |
| R8 | 92.3 | 92.5 | NA | 0.2 |
| R9 | 91.9 | 91.5 | NA | -0.4 |
Mean error = 0.0%; 95% Confidence Interval = [-0.33, 0.33] %
| Soil Name | Depth (in) | USDA Texture | Classification | Percentage Passing (Sieve No.) | Liquid Limit (%) | Plasticity Index (%) | ||||
|---|---|---|---|---|---|---|---|---|---|---|
| Unified | AASHTO | 4 | 10 | 40 | 200 | |||||
| Ashport (AstA) | 0-10 | Silty loam | CL | A-6, A-4 | 100 | 100 | 96-100 | 70-97 | 22-37 | 2-13 |
| 10-24 | Silty clay loam, loam, silt loam | CL | A-6, A-7, A-4 | 100 | 100 | 96-100 | 75-98 | 30-43 | 8-20 | |
| 24-36 | Silty clay loam, loam, silt loam | CL | A-6, A-7, A-4 | 100 | 100 | 96-100 | 70-97 | 30-43 | 8-20 | |
| 48-64 | Silty clay loam, loam, silt loam | CL | A-6, A-7, A-4 | 100 | 100 | 96-100 | 70-97 | 30-43 | 8-20 | |
| Miller (MIIA) |
0-7 | Silty Clay | CH, CL | A-7 | 100 | 100 | 96-100 | 90-99 | 41-60 | 18-35 |
| 7-12 | Silty clay | CH, CL | A-7 | 100 | 100 | 96-100 | 90-99 | 41-60 | 18-35 | |
| 12-24 | Clay, silty clay, sitly clay loam | CH, CL | A-7 | 100 | 98-100 | 96-100 | 90-99 | 41-65 | 20-40 | |
| 24-70 | Clay, silty clay, sitly clay loam | CL, CH | A-6, A-7 | 100 | 98-100 | 96-100 | 80-99 | 35-60 | 15-35 | |
| 70-84 | Clay, silty clay, sitly clay loam | CL, CH | A-6, A-7 | 100 | 98-100 | 96-100 | 80-99 | 35-60 | 15-35 | |
| Sieve Size | Job Formula (% Passing) |
|---|---|
| 1" | 100 |
| 3/4" | 98 |
| 1/2" | 87 |
| 3/8" | 79 |
| No. 4 | 60 |
| No.8 | 43 |
| No.16 | 32 |
| No.30 | 23 |
| No.50 | 15 |
| No.100 | 7 |
| No.200 | 3.2 |
| Sieve Size | Job Formula (% Passing) |
|---|---|
| 3/4" | 100 |
| 1/2" | 98 |
| 3/8" | 90 |
| No. 4 | 63 |
| No.8 | 46 |
| No.16 | 31 |
| No.30 | 22 |
| No.50 | 14 |
| No.100 | 6 |
| No.200 | 3.1 |
| Location | Core | IACA | PQI | Nuclear | Error(IACA - |
|---|---|---|---|---|---|
| R2 | 94.2 | 93.7 | 92.4 | -0.5 | |
| R5 | 92.7 | 93.0 | 93.7 | 0.3 | |
| R8 | 94.7 | 92.2 | 93.4 | -2.5* |
* Estimated density in the vicinity ofthe core varies from 92.2 - 93.5
| First Lift | |||||
|---|---|---|---|---|---|
| Location | Core | IACA | PQI | Nuclear | Error(IACA - Core) |
| F1 | 93.4 | 93.5 | 93.5 | 0.1 | |
| F2 | 92.7 | 93.3 | 93.3 | 0.6 | |
| F3 | 93.9 | 93.3 | 93.7 | -0.6 | |
| F4 | 92.9 | 91.2 | 93.6 | -1.7 | |
| F5 | 93.3 | 92.5 | 93.9 | -0.8 | |
| Top Layer | |||||
|---|---|---|---|---|---|
| Location | Core | IACA | PQI | Nuclear | IACA-Nuclear |
| M4 | 94.9 | 96.0 | 95.7 | -0.8 | |
| M5 | 95.7 | 95.8 | 95.9 | -0.2 | |
| M6 | 95.4 | 95.7 | 94.7 | 0.7 | |
| Sieve Size | Job Formula (% Passing) |
|---|---|
| 1/2" | 100 |
| 3/8" | 95 |
| No. 4 | 23 |
| No.8 | 16 |
| No.16 | 3 |
| No.30 | 3 |
| No.50 | 2 |
| No.100 | 2 |
| No.200 | 1.9 |
| Location | Nuclear | IACA | PQI | Error (Nuclear-IACA) |
|---|---|---|---|---|
| 1 | 94.1 | 95.1 | 94.5 | -1.0 |
| 2 | 94.7 | 93.7 | 95.0 | 1.0 |
| 3 | 95.0 | 94.5 | 93.5 | 0.5 |
| 4 | 94.6 | 94.7 | 92.2 | -0.1 |
| 5 | 94.3 | 94.3 | 92.5 | 0.0 |
| 6 | 92.5 | 95.2 | 92.6 | -2.7 |
| 7 | 92.0 | 95.0 | 92.3 | -3.0 |
| 8 | 96.3 | 94.7 | 93.6 | 1.6 |
| 9 | 97.9 | 94.7 | 93.2 | 3.2 |
| 10 | 97.9 | 94.7 | 89.7 | 3.2 |
| 11 | 94.8 | 95.0 | 90.6 | -0.2 |
| 12 | 91.5 | 91.6 | 92.4 | -0.1 |
| 13 | 92.6 | 92.7 | 92.0 | -0.1 |
| 14 | 92.5 | 92.4 | 90.7 | 0.1 |
| Soil Name | Depth (in) | USDA Texture | Classification | Percentage Passing (Sieve No.) | Liquid Limit (%) | Plasticity Index (%) | ||||
|---|---|---|---|---|---|---|---|---|---|---|
| Unified | AASHTO | 4 | 10 | 40 | 200 | |||||
| Renfrow | 0-5 | Silty clay loam | CL | A-6, A-7 | 100 | 100 | 96-100 | 80-98 | 33-49 | 12-26 |
| 5-9 | Clay loam, silty clay loam | CL | A-6, A-7 | 100 | 100 | 96-100 | 80-98 | 37-49 | 15-26 | |
| 9-73 | Clay, silty clay, silty clay loam | CL, CH | A-6, A-7 | 100 | 100 | 96-100 | 80-99 | 37-70 | 15-38 | |
| Sieve Size | Job Formula (% Passing) |
|---|---|
| 3/2" | 100 |
| 1" | 88 |
| 3/4" | 58 |
| 1/2" | 20 |
| 3/8" | 8 |
| No. 4 | 2 |
| No.8 | 2 |
| No.16 | 2 |
| No.30 | 2 |
| No.50 | 2 |
| No.100 | 2 |
| No.200 | 1.5 |
| Location | Description | Calibration | Validation | |||||||||
|---|---|---|---|---|---|---|---|---|---|---|---|---|
| F1 | F2 | F3 | F4 | F5 | F6 | F7 | F8 | F9 | F10 | F11 | ||
| At the Core | PQI | 94.2 | 93.7 | 94.3 | 94.2 | 94.1 | 93 | 93.3 | 92.5 | 93.4 | 90.5 | 89.7 |
| Nuclear Density | 94.1 | 94.7 | 95.0 | 94.7 | 94.3 | 92.5 | 92.0 | 96.3 | 97.9 | 97.9 | 94.8 | |
| Core Density | 94.4 | 93.5 | 93.4 | 93.7 | 93.9 | 93.9 | 93.1 | 95.5 | 95.7 | 96 | 92.9 | |
| IACA | IACA (Raw) | 93.4 | 92.8 | 92.5 | 93.6 | 93.3 | 92.5 | 92.7 | 94 | 92.8 | 93.4 | 94 |
| IACA (PQI) | 94.3 | 93.7 | 93.4 | 94.5 | 94.2 | 93.4 | 93.6 | 94.9 | 93.7 | 94.3 | 94.9 | |
| IACA (Nuclear) | 94.7 | 94.1 | 93.9 | 94.9 | 94.6 | 93.9 | 94.0 | 95.3 | 94.1 | 94.7 | 95.3 | |
| IACA (Core) | 94.0 | 93.4 | 93.1 | 94.2 | 93.9 | 93.1 | 93.3 | 94.6 | 93.4 | 94.0 | 94.6 | |
| Error | IACA(Raw) - Core | -1 | -0.7 | -0.9 | -0.1 | -0.6 | -1.4 | -0.4 | -1.5 | -2.9 | -2.6 | 1.1 |
| IACA (PQI) - Core | -0.1 | 0.2 | 0.0 | 0.8 | 0.3 | -0.5 | 0.5 | -0.6 | -2.0 | -1.7 | 2.0 | |
| IACA (Nuclear) - Core | 0.3 | 0.6 | 0.5 | 1.2 | 0.7 | 0.0 | 0.9 | -0.2 | -1.6 | -1.3 | 2.4 | |
| IACA (Core) - Core | -0.4 | -0.1 | -0.3 | 0.5 | 0.0 | -0.8 | 0.2 | -0.9 | -2.3 | -2.0 | 1.7 | |
| PQI - Core | -0.2 | 0.2 | 0.9 | 0.5 | 0.2 | -0.9 | 0.2 | -3 | -2.3 | -5.5 | -3.2 | |
| Absolute Error | IACA(Raw) - Core | 1 | 0.7 | 0.9 | 0.1 | 0.6 | 1.4 | 0.4 | 1.5 | 2.9 | 2.6 | 1.1 |
| IACA (PQI) - Core | 0.1 | 0.2 | 0.0 | 0.8 | 0.3 | 0.5 | 0.5 | 0.6 | 2.0 | 1.7 | 2.0 | |
| IACA (Nuclear) - Core | 0.3 | 0.6 | 0.5 | 1.2 | 0.7 | 0.0 | 0.9 | 0.2 | 1.6 | 1.3 | 2.4 | |
| IACA (Core) - Core | 0.4 | 0.1 | 0.3 | 0.5 | 0.0 | 0.8 | 0.2 | 0.9 | 2.3 | 2.0 | 1.7 | |
| PQI - Core | 0.2 | 0.2 | 0.9 | 0.5 | 0.2 | 0.9 | 0.2 | 3.0 | 2.3 | 5.5 | 3.2 | |
| Site | Core Location | Density | IACA Estimate | |
|---|---|---|---|---|
| Left | Right | |||
| Blanchard | Base #1 | 90.9 | 92.0 | 91.1 |
| Blanchard | Base #2 | 92.3 | 93.6 | 92.7 |
| Blanchard | II Lift #1 | 90.6 | 91.6 | 90.9 |
| Blanchard | II Lift #2 | 92.3 | 90.5 | 91.8 |
| Blanchard | II Lift #3 | 91.7 | 91.8 | 91.5 |
| Blanchard | III Lift #1 | 92.3 | 92.2 | 92.4 |
| Blanchard | III Lift #2 | 91.6 | 90.2 | 92.0 |
| Blanchard | III Lift #3 | 92.2 | 92.5 | 92.4 |
| Blanchard | Surface #1 | 90.6 | 91.4 | 90.5 |
| Blanchard | Surface #2 | 91.4 | 92.4 | 91.9 |
| Blanchard | Surface #3 | 91.9 | 91.6 | 91.4 |
| Tecumseh Road | Base #1 | 93.9 | 93.7 | 94.0 |
| Tecumseh Road | Base #2 | 93.5 | 94.4 | 93.7 |
| Site | Location | Nuclear Gauge Density Readings | IACA Estimate | ||
|---|---|---|---|---|---|
| Left | Center | Right | |||
| OKC | Surface #1 | 95.4 | 95.7 | 95.6 | 95.3 |
| OKC | Surface #2 | 93.2 | 94.7 | 94.8 | 95.4 |
| Tecumseh Road | Base #1 | 94.7 | - | 94.1 | 93.7 (94.0) |
| Tecumseh Road | Base #2 | 94.3 | - | 94.7 | 94.0 (93.8) |
| Site | Location | PQI 301 Density | IACA Estimate (Core) | ||
|---|---|---|---|---|---|
| Left | Center | Right | |||
| Blanchard | Base #1 | 92.9 | - | 93.1 | 91.1 (91.5) |
| Blanchard | Base #2 | 92.5 | - | 93.2 | 92.7 (93.0) |
| Blanchard | II Lift #1 | 92.9 | - | 93.0 | 90.6 (91.1) |
| Blanchard | II Lift #2 | 93.5 | - | 93.3 | 92.5 (91.4) |
| Blanchard | II Lift #3 | 91.9 | - | 92.0 | 91.5 (91.8) |
| Blanchard | III Lift #1 | 94.9 | - | 94.7 | 92.4 (92.3) |
| Blanchard | III Lift #2 | 94.7 | - | 93.1 | 92.0 (90.9) |
| Blanchard | III Lift #3 | 92.2 | - | 92.5 | 91.2 (89.1) |
| Blanchard | Surface #1 | 92.5 | - | 93.5 | 90.2 (91.0) |
| Blanchard | Surface #2 | 93.4 | - | 93.6 | 91.6 (92.2) |
| Blanchard | Surface #3 | 93.5 | - | 93.9 | 91.0 (91.8) |
| OKC | Surface #1 | 96.0 | 96.0 | 95.3 | 95.3 |
| OKC | Surface #2 | 95.6 | 95.7 | 95.2 | 95.4 |
| Tecumseh Road | Base #1 | 93.7 | - | 94.2 | 93.7 (94.0) |
| Tecumseh Road | Base #2 | 94.1 | - | 94.2 | 94.0 (93.8) |
| Personnel | Rate | Hours | IDC | Cumulative Expense | Source of Cost Share | Total Cost Share | FHWA Request | |
|---|---|---|---|---|---|---|---|---|
| Volvo | OU | |||||||
| Haskell Lemon | ||||||||
| Project Manager | $30.00 | 400 | 100% | 0 | $0 | 0 | ||
| Administrative Assistant | $18.00 | 500 | 100% | 0 | $0 | 0 | ||
| Travel (FHWA, Washington, DC) | 0 | $0 | 0 | |||||
| EST Inc. | ||||||||
| Coring Services | 0 | $0 | 0 | |||||
| OU | ||||||||
| Sesh Commuri | $66.84 | 350 | 26% | 0 | ||||
| Musharraf Zaman | $93.67 | 150 | 26% | 0 | ||||
| Graduate Student 1 ($18k/year) | $18.83 | 1000 | 26% | $10,047.48 | $10,047.48 | $10,047.48 | 0 | |
| Graduate Student 2 ($18k/year) | $18.83 | 1000 | 26% | $10,047.48 | $10,047.48 | $10,047.48 | 0 | |
| UG Student 1 ($12k/year) | $12.14 | 1000 | 26% | $6, 477.76 | $6, 477.76 | $6, 477.76 | ||
| Tuition | $1875.92 | $1875.92 | $1875.92 | |||||
| Supplies | $1,064.01 | $1,064.01 | $1,064.01 | |||||
| Travel | $7, 800.00 | 26% | $63 | $63 | $63 | |||
| Publications | 0 | |||||||
| Total Costs | $29,575.65 | $29,575.65 | 0 | $29,575.65 | 0 | |||
| IDC - Indirect Cost Rate DUNS # 122592439 | ||||||||
| Personnel | Rate | Hours | IDC | Cumulative Expense | Source of Cost Share | Total Cost Share | FHWA Request | |
|---|---|---|---|---|---|---|---|---|
| Volvo | OU | |||||||
| Haskell Lemon | ||||||||
| Project Manager | $30.00 | 140 | 100% | $7, 920.00 | $7, 920.00 | |||
| Administrative Assistant | $18.00 | 220 | 100% | $8, 400.00 | $8, 400.00 | |||
| Coring Services | $3,000 | $3,000 | ||||||
| OU | ||||||||
| Salaries (Sesh Commuri, Musharraf Zaman, 2 Graduate Students) | $40, 678.66 | $14, 491.28 | $55, 170.94 | $55, 170.94 | $55, 170.94 | |||
| Graduate Student 1 ($18k/year) | $18.83 | 300 | 26% | $7, 119.00 | $0 | $7, 119.00 | ||
| Graduate Student 2 ($18k/year) | $18.83 | 300 | 26% | $7, 119.00 | $0 | $7, 119.00 | ||
| Tuition | $4, 242.93 | $4, 242.93 | $4, 242.93 | |||||
| Supplies | $14, 194.29 | $14, 194.29 | $14, 194.29 | |||||
| Travel | $861.69 | $861.69 | $861.69 | |||||
| Publications | ||||||||
| Total Costs | $108,027.85 | $74, 469.85 | $74, 469.85 | $33,558.00 | ||||
| IDC - Indirect Cost Rate DUNS # 122592439 | ||||||||
| Personnel | Rate | Hours | IDC | Cumulative Expense | Source of Cost Share | Total Cost Share | FHWA Request | |
|---|---|---|---|---|---|---|---|---|
| Volvo | OU | |||||||
| Haskell Lemon | ||||||||
| Project Manager | $30.00 | 148 | 100% | $8, 880.00 | $8, 880.00 | |||
| Administrative Assistant | $18.00 | 120 | 100% | $4, 200.00 | $4, 200.00 | |||
| Coring Services | $4,000.00 | $4,000.00 | ||||||
| OU | ||||||||
| Salaries (Sesh Commuri, Musharraf Zaman, 2 Graduate Students) | $33,017.88 | $4, 669.82 | $37, 687.70 | $37, 687.70 | $37, 687.70 | |||
| Graduate Student 1 ($18k/year) | $18.83 | 500 | 26% | $11, 861.64 | $0 | $11, 861.64 | ||
| Graduate Student 2 ($18k/year) | $18.83 | 500 | 26% | $11, 861.64 | $0 | $11, 861.64 | ||
| Tuition | $9, 431.98 | $1, 312.50 | $8, 119.48 | $9, 431.98 | ||||
| Supplies | $2, 692.32 | $2, 692.32 | $2, 692.32 | |||||
| Travel | $1,538.28 | $1,538.28 | $1,538.28 | |||||
| Publications | ||||||||
| Total Costs | $92, 153.56 | $43, 230.80 | $8, 119.48 | $51, 350.28 | $40, 803.28 | |||
| IDC - Indirect Cost Rate DUNS # 122592439 | ||||||||
| Personnel | Rate | Hours | IDC | Cumulative Expense | Source of Cost Share | Total Cost Share | FHWA Request | |
|---|---|---|---|---|---|---|---|---|
| Volvo | OU | |||||||
| Haskell Lemon | ||||||||
| Project Manager | $30.00 | 90 | 100% | $5, 400.00 | $5, 400.00 | |||
| Administrative Assistant | $18.00 | 120 | 100% | $4, 320.00 | $4, 320.00 | |||
| Coring Services | $2,000.00 | $2,000.00 | ||||||
| OU | ||||||||
| Salaries (Sesh Commuri, Musharraf Zaman, 2 Graduate Students) | $16,512.00 | $14, 241.08 | $30, 753.08 | $30, 753.08 | $30, 753.08 | |||
| Graduate Student 1 ($18k/year) | $18.83 | 200 | 26% | $4, 745.16 | $0 | $4, 745.16 | ||
| Graduate Student 2 ($18k/year) | $18.83 | 200 | 26% | $4, 745.16 | $0 | $4, 745.16 | ||
| Tuition | $2,010.00 | $2,010.00 | $0.00 | $2,010.00 | ||||
| Supplies | $36, 282.86 | $36, 282.86 | $36, 282.86 | |||||
| Travel | $1, 978.56 | $1, 978.56 | $1, 978.56 | |||||
| Publications | ||||||||
| Total Costs | $92, 234.82 | $71,024.50 | $0 | $71,024.50 | $21, 210.32 | |||
| IDC - Indirect Cost Rate DUNS # 122592439 | ||||||||
Figures
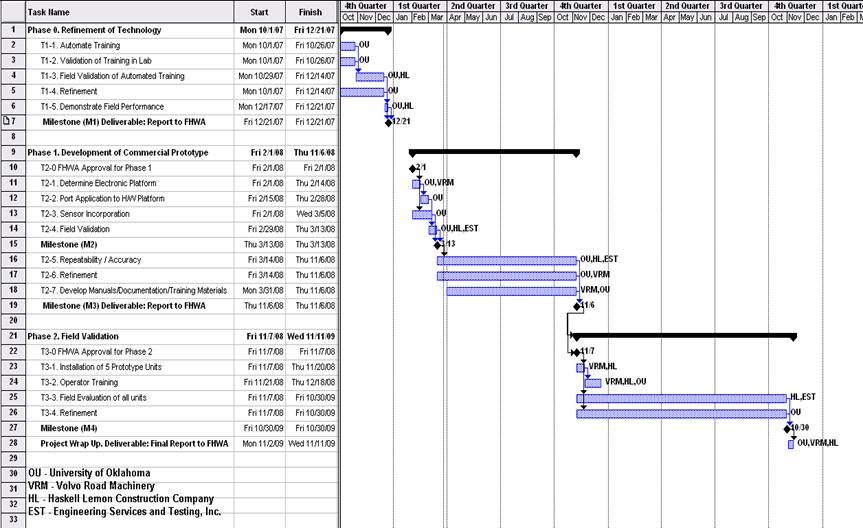
Figure 1. Tentative schedule for the development of a commercial prototype of the IACA
Figure 2. IACA setup showing the ECM, GPS receiver and display monitor

Figure 3. Wiring schematic for the IACA
Figure 4. Graphical User Interface for the calibration of the IACA and report generation
Figure 5. As-built map generated by IACA application
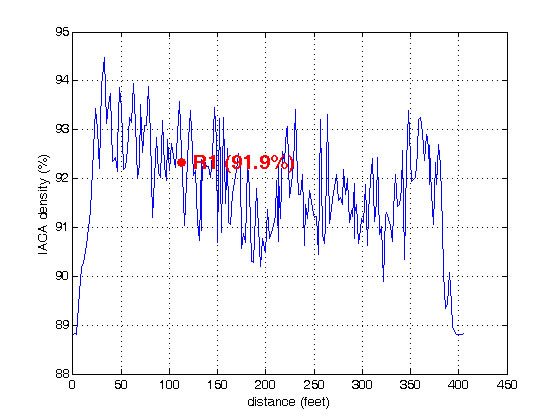
Figure 6. Final compacted density with core location and density
Figure 7. Test site location 1 on Highway US-62 in Blanchard, OK
Figure 8. Cross section of the pavement (US-62) at Blanchard, OK
Figure 9. Plan schematic of SH-62 project with the test locations marked
TS1, TS2, TS3, TS4, TS5
Figure 10. Plan Schematic of SH-62 project with the test locations TS6, TS7, TS8.
Figure 11. Selection of core locations after the final pass of the roller
Figure 12. Comparison of the IACA estimated densities with measurements obtained from cores extracted from the pavement
Figure 13. Analysis of the error between the core and estimated density
Figure 14. Density variation in the vicinity of core S4
Figure 15. Test site location 2 on I-35 near Purcell, OK
Figure 16. Cross section of the pavement at I-35 at Test site location 2 (Purcell))
Figure 17. Test site location 3 on I-35 in Oklahoma City, OK
Figure 18. Cross section of the pavement (I-35) in Oklahoma City, OK
Figure 19. Plan schematic of I-35 OKC project with the test sites TS1, TS2, TS3, TS4
Figure 20. Test site location 4 on US-77 in Noble, OK
Figure 21. Cross section of the pavement (US-77) in Noble, OK
Figure 22. Test site location 5 ( Tecumseh Road) in Norman, OK
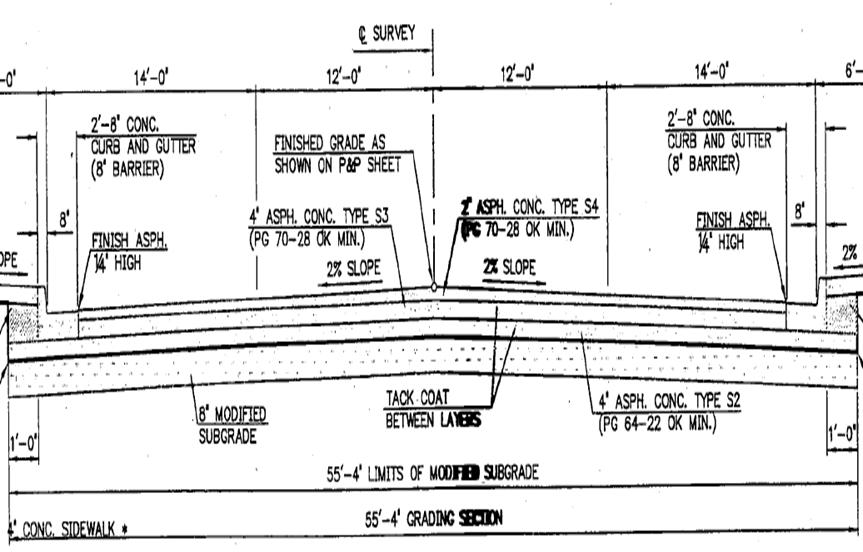
Figure 23. Cross section of the pavement (Tecumseh Road) in Norman, OK