

Evaluation of The TAPCO Sequential Dynamic Curve Warning System
SPEED ANALYSIS
This chapter describes the speed metrics used to assess the effectiveness of the SDCWS. Since data were collected at three locations per curve, results for individual sites are summarized.
Speed Metrics
The change in speed from the before period was compared to each after period. A negative result indicates that speeds were reduced from the before period to the after period. A positive value indicates that speed increased from the before period to the after period. Mean and 85th percentile speeds are shown sing a trend line. This is shown for graphical purposes only and should not be interpreted to indicate that speeds can be interpolated between data collection periods.
The change in mean and 85th percentile speed from the before period speed to specific after period speed are shown in miles per hour (mph). The percentage change in the fraction of vehicles exceeding the posted or advisory speed is also presented. A number of speed metrics were calculated for the direction of travel towards the signs. They include average speed, standard deviation (SD) of speed, 50th percentile speed, 85th percentile speed, and number of vehicles traveling 5, 10, 15, or 20 mph over the posted or advisory speed limit. For simplicity in setting up the pneumatic road tubes, the traffic counters were set up to record both directions of traffic on the two-way roadway. Results were reduced by lane and are only presented for traffic traveling in the direction of the SDCWS.
Results to Date
This interim report does not provide a commentary on the results to date. Tables 5 and 6 provide a summary of speed statistics across all sites at both PC and CC. The table shows the changes from before to 1 month after, with a negative sign showing a reduction in speed or percentage. Appendix contains the full data set collected before installation and 1 month after installation, in both tabular and graphic formats. The schedule of the data collection for each State is provided in table 7. This shows both data that have been collected and what will be collected in the future.
State |
IA |
MO |
TX |
WA |
WI |
||||||||
|---|---|---|---|---|---|---|---|---|---|---|---|---|---|
Road |
Hwy 144 |
Hwy 221 |
FM 109 |
FM 407 |
FM 530 |
FM 1488 |
SR 7 |
SR 9 |
SR 203 |
Hwy 20 |
Hwy 67 |
Hwy 213 |
|
Posted Speed |
55 |
55 |
60 |
55 |
60 |
55 |
50 |
55 |
55 |
55 |
55 |
55 |
|
Curve Advisory Speed |
45 |
40 |
35 |
40 |
-0.9 |
40 |
20 |
40 |
None |
30 |
25 |
50 |
|
Change in mean speed (mph) |
-1.5 |
-1.5 |
-0.8 |
-1.8 |
-2 |
-2.4 |
-2.8 |
-1.4 |
-2 |
-1.8 |
-1.6 |
-0.7 |
|
Change in 85th percentile speed(mph) |
-1 |
-1 |
-1 |
-2 |
-2.6 |
-3 |
-3 |
-1 |
-2 |
-2 |
-1 |
0 |
|
| Change in Fraction of vehicles exceeding posted or advisory speed by | 5 mph |
-19.7% |
-6.4% |
-2.2% |
-6.7% |
-20.3% |
-8.5% |
-7.3% |
-30.4% |
-2.1% |
-9.1% |
0.0% |
-9.5% |
| 10 mph | -33.3% | -17.1% | -8.8% | -20.9% | -36.4% | -27.1% | -30.0% | -50.0% | -14.5% | -19.0% | -3.1% | -25.0% | |
| 15 mph | 0.0% | -32.0% | -23.3% | -41.9% | -63.6% | -53.6% | -51.4% | -100.0% | -46.5% | -40.7% | -8.0% | 0.0% | |
| 20 mph | 0.0% | -50.0% | 0.0% | 0.0% | 0.0% | 0.0% | -77.8% | 0.0% | -62.5% | -57.1% | -21.5% | 0.0% | |
State |
IA |
MO |
TX |
WA |
WI |
||||||||
|---|---|---|---|---|---|---|---|---|---|---|---|---|---|
Road |
Hwy 144 |
Hwy 221 |
FM 109 |
FM 407 |
FM 530 |
FM 1488 |
SR 7 |
SR 9 |
SR 203 |
Hwy 20 |
Hwy 67 |
Hwy 213 |
|
Posted Speed |
55 |
55 |
60 |
55 |
60 |
55 |
50 |
55 |
55 |
55 |
55 |
55 |
|
Curve Advisory Speed |
45 |
40 |
35 |
40 |
35 |
40 |
20 |
40 |
None |
30 |
25 |
50 |
|
Change in mean speed (mph) |
-2.1 |
0.3 |
-1.4 |
-1.1 |
-2 |
-0.1 |
-1.4 |
-0.9 |
-0.1 |
-1.8 |
-1.8 |
-1 |
|
Change in 85th percentile speed (mph) |
-2 |
0 |
-2 |
-2 |
-2.6 |
0 |
-1 |
-1 |
0 |
-2 |
-2 |
-1 |
|
Change in fraction of vehicles exceeding posted or advisory speed by |
5 mph |
-38.1% |
0.0% |
-5.7% |
-8.2% |
-20.3% |
-4.8% |
-19.0% |
-26.3% |
0.0% |
-18.2% |
-2.1% |
-11.9% |
10 mph |
-58.3% |
10.5% |
-27.7% |
-29.7% |
-36.4% |
2.5% |
-45.0% |
-33.3% |
-2.8% |
-45.5% |
-11.6% |
-20.0% |
|
15 mph |
0.0% |
28.6% |
-51.4% |
-60.0% |
-63.6% |
0.0% |
0.0% |
0.0% |
-4.0% |
-66.7% |
-28.3% |
50.0% |
|
20 mph |
0.0% |
0.0% |
0.0% |
0.0% |
0.0% |
0.0% |
0.0% |
0.0% |
0.0% |
-100.0% |
-46.7% |
0.0% |
|
| Activity Description | Schedule (Week) | Status |
|---|---|---|
| Before data collection | Complete | |
| Washington | 7/17/2012 | |
| Wisconsin | 5/21 2012 | |
| Missouri | 6/13 2012 | |
| Texas | 6/25 and 7/9 2012 | |
| Iowa | 8/29 2013 | |
| Installation | Complete | |
| Washington | 8/1/2012 | |
| Wisconsin | 6/11 2012 | |
| Missouri | 6/25 2012 | |
| Texas | 7/16/2012 | |
| Iowa | 9/10 2012 | |
| 1-month after data collection | Complete | |
| Washington | 9/12/2012 | |
| Wisconsin | 7/9 2012 | |
| Missouri | 8/1 2012 | |
| Texas | 9/3, 9/10,/9/24 2012 | |
| Iowa | 10/10 2012 | |
| 12-month after data collection | ||
| Washington | August 2013 | |
| Wisconsin | June 2013 | |
| Missouri | July 2013 | |
| Texas | June/July 2013 | |
| Iowa | September 2013 | |
| 18-month after data collection | ||
| Washington | February 2014 | |
| Wisconsin | December 2013 | |
| Missouri | January 2014 | |
| Texas | December 2013/January 2014 | |
| Iowa | March 2014 | |
| Before Crash data collection | ||
| Washington | April 2013 | |
| Wisconsin | May 2013 | |
| Missouri | February 2013 | |
| Texas | TBD | |
| Iowa | February 2013 | |
| After Crash data collection | ||
| Washington | April 2014 | |
| Wisconsin | May 2014 | |
| Missouri | September 2013 | |
| Texas | TBD | |
| Iowa | February 2014 | |
| First Year Evaluation | 12/31/2013 | |
| Final Report | 8/31/2014 |
Appendix A. Baseline Data For each Test Section
Hwy 144(IA) - Eastbound Before
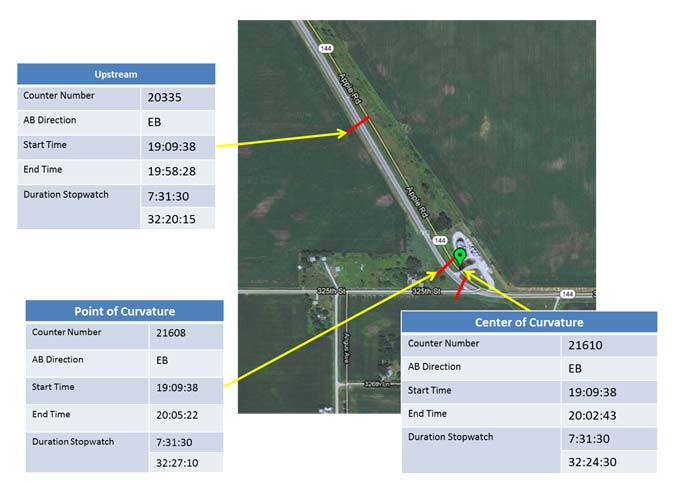
Figure 16. Photo. Iowa Highway 144 before data collection.
Hwy 144(IA) - Eastbound 1 Month After
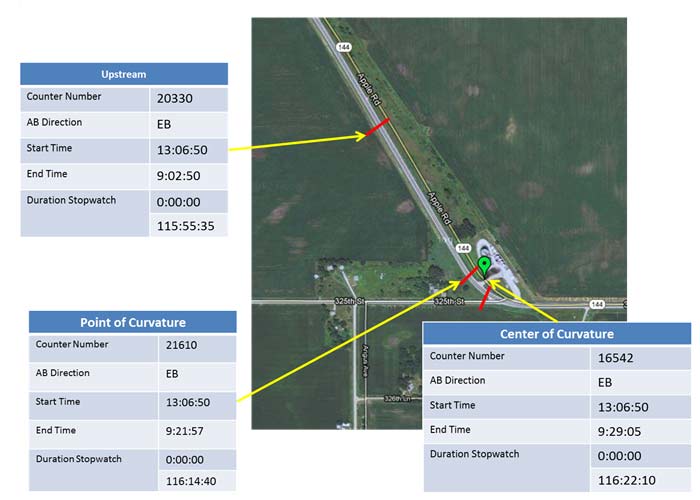
Figure 17. Photo. Iowa Highway 144 1 month after data collection.
Hwy 144(IA) - Eastbound
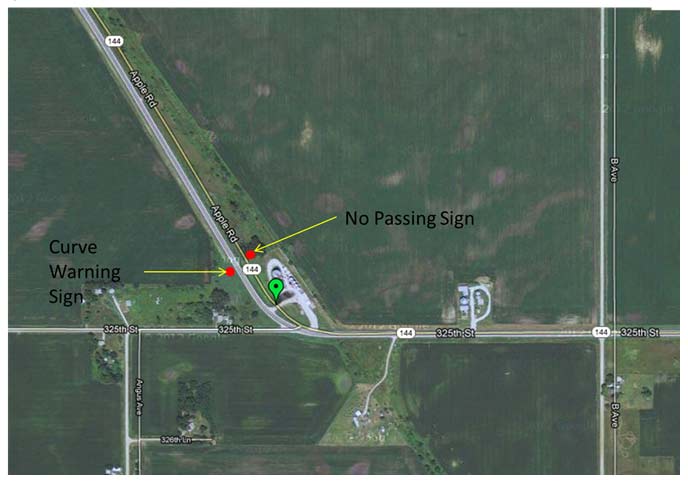
Figure 18. Photo. Iowa Highway 144 site layout.
location (gps at center of curve) |
|
2-12' lanes |
# lanes and width |
Left |
curve direction (left or right) |
Gravel 4' |
shoulder type and width |
45 |
posted speed of curve in each direction |
55 |
tangent speed in each direction |
55 |
advisory speed in each direction |
See below |
grade (average of 3 readings and list if positive or negative) |
See below |
super elevation |
See Layout |
location and type of signing before and in the |
Asphalt |
pavement type and condition |
None |
presence and location of street lighting |
Grade |
Begin S-N |
Center W-E |
End W-E |
|||||||||
|---|---|---|---|---|---|---|---|---|---|---|---|---|
EB |
Center |
WB |
Average |
EB |
Center |
WB |
Average |
EB |
Center |
WB |
Average |
|
-.4 |
-.1 |
-.2 |
-.23 |
-0 |
-.9 |
-.4 |
-.43 |
-.6 |
-.5 |
-.8 |
-.63 |
|
Super Elevation |
Begin W-E |
Center S-N |
End S-N |
|||||||||
|---|---|---|---|---|---|---|---|---|---|---|---|---|
EB |
Center |
WB |
Average |
EB |
Center |
WB |
Average |
EB |
Center |
WB |
Average |
|
-5.3 |
-3.7 |
-4.9 |
-4.63 |
-8.5 |
-7.1 |
-7.4 |
-7.67 |
-1.2 |
+1 |
-1.4 |
-.53 |
|
Figure 19. Chart. Iowa Highway 144 site information.
Hwy 221 (MO) - Northbound Before
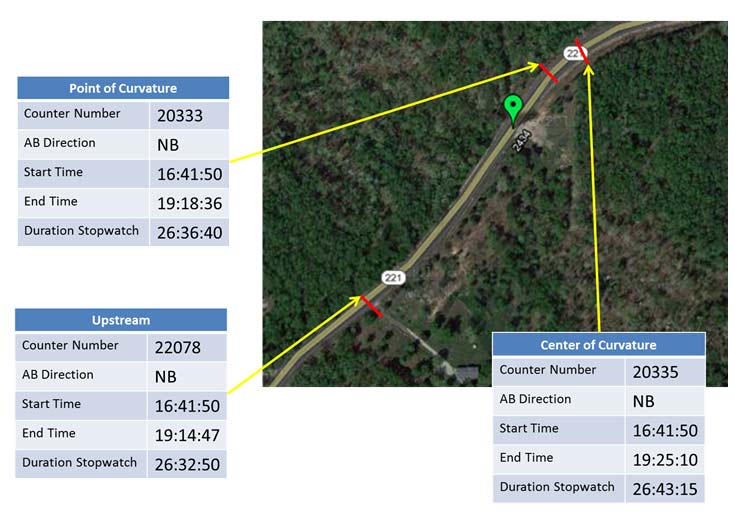
Figure 20. Photo. Missouri Highway 221 before data collection.
Hwy 221 (MO) - Northbound 1 Month After
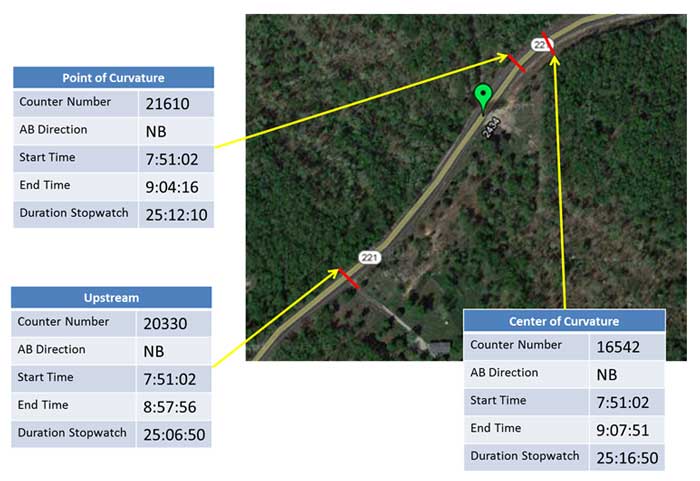
Figure 21. Photo. Missouri Highway 221 1 month after data collection.
Hwy 221 (MO) - Northbound
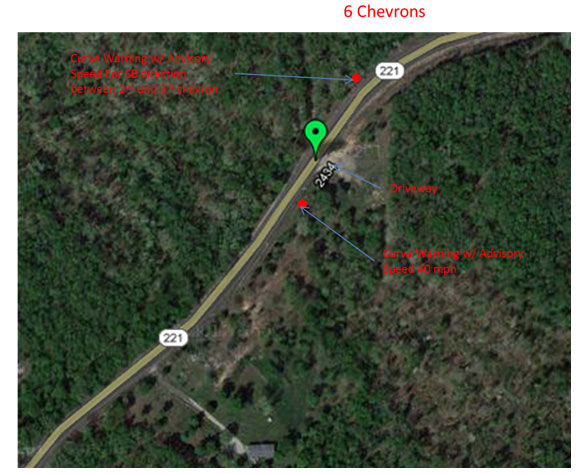
Figure 22. Photo. Missouri Highway 221 site layout.
Missouri 221
Date: 6/13-6/1/2012
Period: Before
N42°31.432' W088°58.944' |
location (gps at center of curve) |
2 Lanes, 22' Asphalt |
# lanes and width |
Right |
curve direction (left or right) |
4' Asphalt Right 4' +3' Asphalt Left sharp drop |
shoulder type and width |
55 |
posted speed of curve in each direction |
55 |
tangent speed in each direction |
40 |
advisory speed in each direction |
See Below |
grade (average of 3 readings and list if positive or negative) |
See Below |
super elevation |
See Layout |
location and type of signing before and in the |
Asphalt, Good |
pavement type and condition |
None |
presence and location of street lighting |
| Grade |
Begin S-N |
Center S-N |
End W-E |
|||||||||
|---|---|---|---|---|---|---|---|---|---|---|---|---|
NB |
Center |
SB |
Average |
NB |
Center |
SB |
Average |
NB |
Center |
SB |
Average |
|
-3.6 |
-3.3 |
-2.9 |
-3.27 |
-4.5 |
-4.4 |
-4.7 |
-4.53 |
-8.8 |
-9.1 |
-9.8 |
-9.23 |
|
Super Elevation |
Begin W-E |
Center S-N |
End S-N |
|||||||||
|---|---|---|---|---|---|---|---|---|---|---|---|---|
NB |
Center |
SB |
Average |
NB |
Center |
SB |
Average |
NB |
Center |
SB |
Average |
|
-4.2 |
-2.6 |
-1.2 |
-2.67 |
-8.6 |
-8.0 |
-6.0 |
-7.53 |
2.0 |
-0.7 |
-1.4 |
-.03 |
|
Figure 23. Chart. Missouri Highway 221 site information.
Washington SR9
Date 7/17 - 7/18, 2012
Period: Before
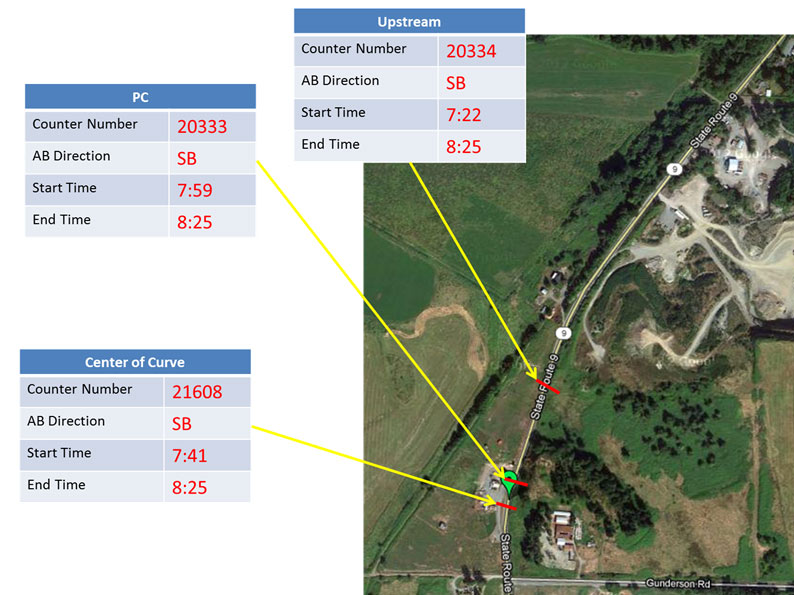
Figure 24. Map. Washington State Route 9 before data collection
Washington SR9
Date 9/12 - 9/13, 2012
Period: 1 Month After

Figure 25. Map. Washington State Route 9 1 month after data collection.
location (gps at center of curve) |
|
2 Lanes, 10' Each |
# lanes and width |
Left |
curve direction (left or right) |
2' Asphalt Shoulder Both |
shoulder type and width |
50 |
posted speed of curve in each direction |
50 |
tangent speed in each direction |
40 |
advisory speed in each direction |
See Below |
grade (average of 3 readings and list if positive or negative) |
See Below |
super elevation |
See Layout |
location and type of signing before and in the |
Asphalt |
pavement type and condition |
None |
presence and location of street lighting |
Figure 26. Chart. Washington State Route 9 site information.
Washington SR9
Date 7/17 - 7/18, 2012
Period: Before

Figure 27. Map. Washington State Route 203 before data collection.
Washington SR203
Date 9/12 - 9/13, 2012
Period: 1 Month After

Figure 28. Map. Washington State Route 203 1 month after data collection
location (gps at center of curve) |
|
2 lanes with 12" CL Rumble, 11' NB Lane; |
# lanes and width |
Left |
curve direction (left or right) |
NB-4.5' Asphalt Shld SB-8' Asphalt w/ 12" Rumble |
shoulder type and width |
55 |
posted speed of curve in each direction |
55 |
tangent speed in each direction |
None |
advisory speed in each direction |
See Below |
grade (avg. of 3 readings and list if positive or negative) |
See Below |
super elevation |
See Layout |
location and type of signing before and in the |
Asphalt |
pavement type and condition |
None |
presence and location of street lighting |
Figure 29. Chart. Washington State Route 203 site information
Washington SR7
Date 7/17 - 7/18, 2012
Period: Before
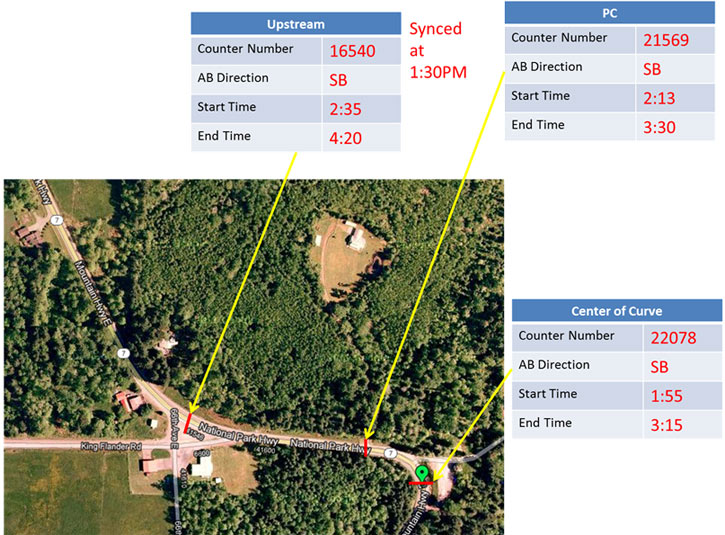
Figure 30. Map. Washington State Route 7 before data collection.
Washington SR7
Date 9/12 - 9/13, 2012
Period: 1 Month After
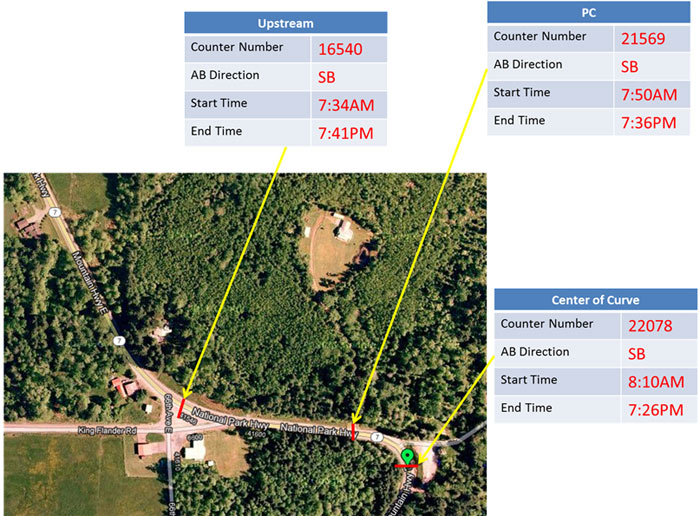
Figure 31. Photo. Washington State Route 7 1 month after data collection.
location (gps at center of curve) |
|
2 Lane with 12" Rumble NB 11' Lane; SB 10' Lane |
# lanes and width |
Right |
curve direction (left or right) |
Paved |
shoulder type and width |
50 |
posted speed of curve in each direction |
50 |
tangent speed in each direction |
20 |
advisory speed in each direction |
See Below |
grade (average of 3 readings and list if positive or negative) |
See Below |
super elevation |
See Layout |
location and type of signing before and in the |
Asphalt, Good |
pavement type and condition |
| None | presence and location of street lighting |
Figure 32. Chart. Washington State Route 7 site information.
Wisconsin 213
Date 5/21 - 5/22, 2012
Period: Before
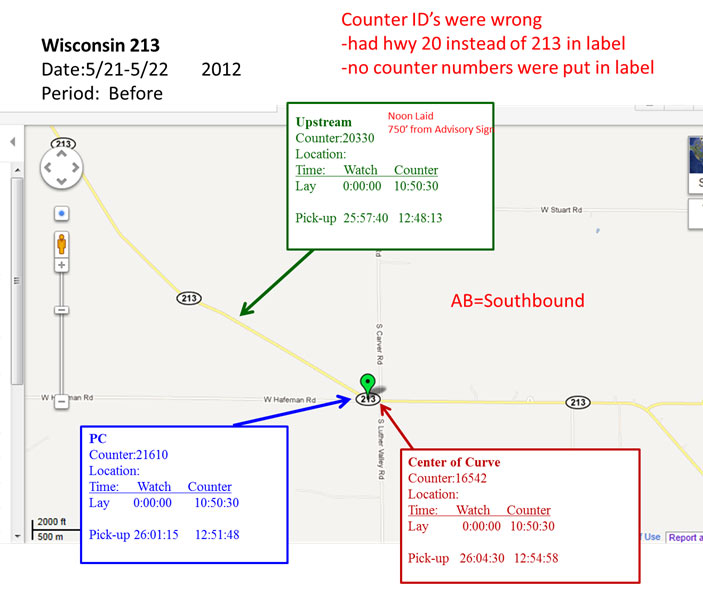
Figure 33. Map. Wisconsin Highway 213 before data collection.
Wisconsin 213
Date 5/21 - 5/22, 2012
Period: Before
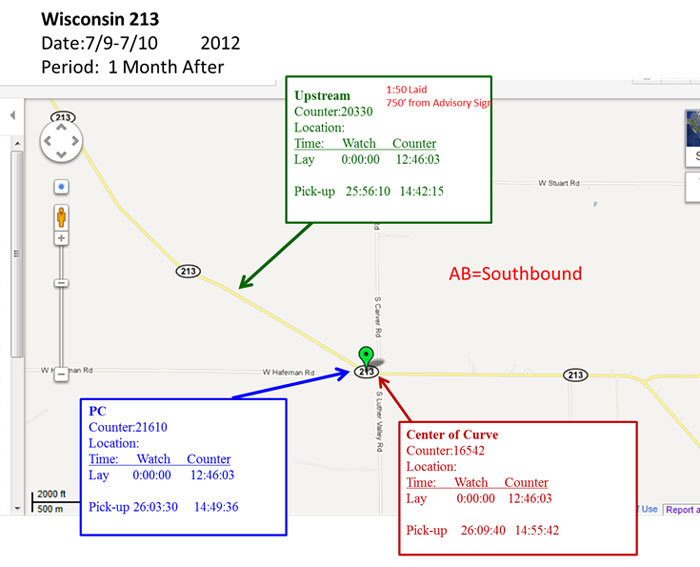
Figure 34. Map. Wisconsin Highway 213 1 month after data collection.
Wisconsin 213
Date 5/21 - 5/22, 2012
Period: Before
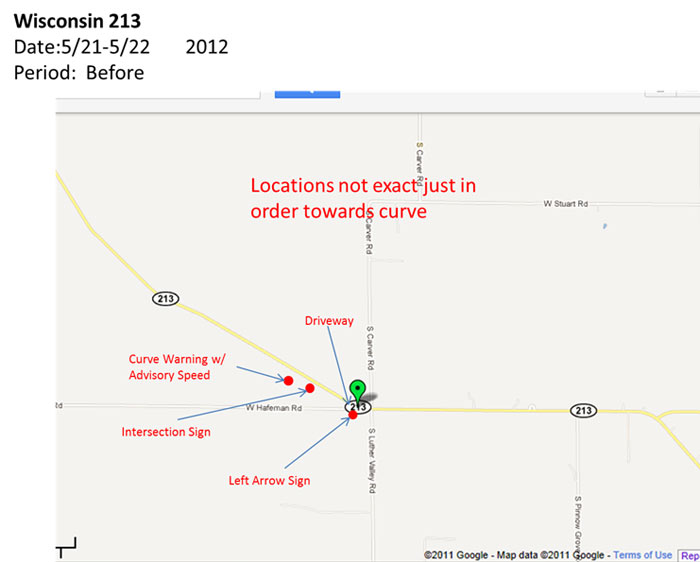
Figure 35. Map. Wisconsin Highway 213 site layout.
Wisconsin 213
Date: 5/21-5/22/2012
Period: Before
N42°35.977' W089°12.570' |
location (gps at center of curve) |
2 Lanes, 24' |
# lanes and width |
Left |
curve direction (left or right) |
3' Asphalt with varying gravel edge |
shoulder type and width |
55 |
posted speed of curve in each direction |
55 |
tangent speed in each direction |
50 |
advisory speed in each direction |
Below |
grade (average of 3 readings and list if positive or negative) |
Below |
super elevation |
Previous Slide (5 Chevrons) |
location and type of signing before and in the |
Asphalt, Good |
pavement type and condition |
None |
presence and location of street lighting |
| Grade | Begin W-E |
Center W-E |
End W-E |
|||||||||
|---|---|---|---|---|---|---|---|---|---|---|---|---|
SB |
Center |
NB |
Average |
SB |
Center |
NB |
Average |
SB |
Center |
NB |
Average |
|
-4.9 |
-4.9 |
-4.8 |
-4.87 |
-5.6 |
-5.4 |
-5.7 |
-5.57 |
-3.8 |
-3.2 |
-3.1 |
-3.37 |
|
Super Elevation |
Begin S-N |
Center S-N |
End S-N |
|||||||||
|---|---|---|---|---|---|---|---|---|---|---|---|---|
SB |
Center |
NB |
Average |
SB |
Center |
NB |
Average |
SB |
Center |
NB |
Average |
|
-3.8 |
-3.5 |
-4.7 |
-4.00 |
-6.5 |
-7.1 |
-8.6 |
-7.40 |
-4.6 |
-4.8 |
-5.4 |
-4.93 |
|
Figure 36. Chart. Wisconsin Highway 213 site information.
Wisconsin 20
Date 5/21 - 5/22, 2012
Period: Before
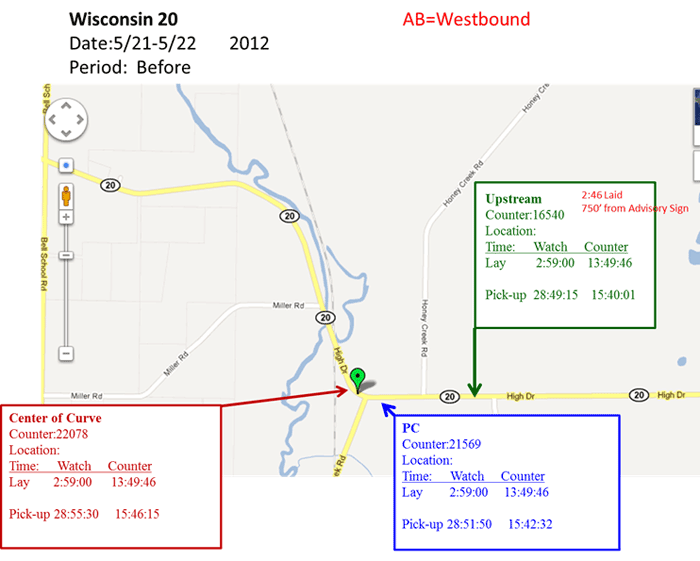
Figure 37. Map. Wisconsin Highway 20 before data collection.
Wisconsin 20
Date 7/9 - 7/10, 2012
Period: 1 Month After
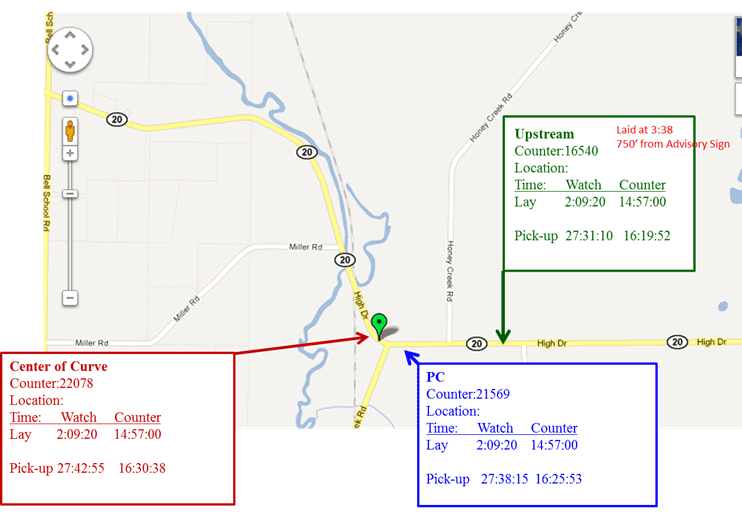
Figure 38. Map. Wisconsin Highway 20 1 month after data collection.
Wisconsin 20
Date 5/21 - 5/22, 2012
Period: Before
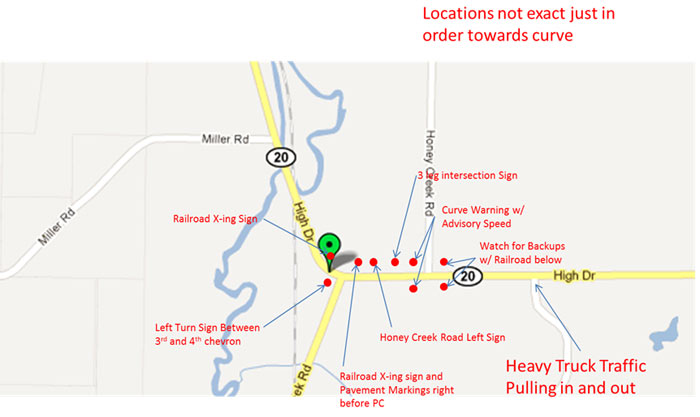
Figure 39. Map. Wisconsin Highway 20 site layout.
Wisconsin 20
Date: 5/21-5/22/2012
Period: Before
N42o46.212' W088o18.078' |
location (gps at center of curve) |
2 Lanes, 25' |
# lanes and width |
Right |
curve direction (left or right) |
South (2' Asphalt, 6' gravel) North(14' Asphalt w/Drainage |
shoulder type and width |
55 |
posted speed of curve in each direction |
55 |
tangent speed in each direction |
30 |
advisory speed in each direction |
See Below |
grade (average of 3 readings and list if positive or negative) |
See Below |
super elevation |
See Layout (9 Chevrons) |
location and type of signing before and in the curve |
Asphalt, Good |
pavement type and condition |
None |
presence and location of street lighting |
Grade |
Begin W-E |
Center W-E |
End S-N |
|||||||||
|---|---|---|---|---|---|---|---|---|---|---|---|---|
SB |
Center |
NB |
Average |
SB |
Center |
NB |
Average |
SB |
Center |
NB |
Average |
|
3 |
3 |
2.5 |
2.83 |
7.3 |
7 |
7.2 |
7.17 |
-5.9 |
-6.4 |
-6.5 |
-6.27 |
|
Super Elevation |
Begin S-N |
Center S-N |
End W-E |
|||||||||
|---|---|---|---|---|---|---|---|---|---|---|---|---|
SB |
Center |
NB |
Average |
SB |
Center |
NB |
Average |
SB |
Center |
NB |
Average |
|
-4 |
-5.3 |
-3 |
-4.10 |
-7.7 |
-8.3 |
-8.2 |
-8.07 |
-3.4 |
-5.6 |
-4 |
-4.33 |
|
Figure 40. Chart. Wisconsin Highway 20 site information.
Wisconsin 67
Date 5/21 - 5/22, 2012
Period: Before
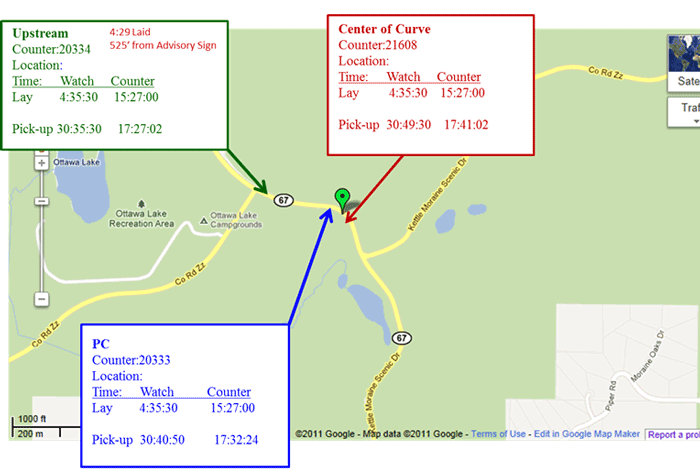
Figure 41. Map. Wisconsin Highway 67 before data collection.
Wisconsin 67
Date 7/9-7/10 2012
Period: 1 Month After
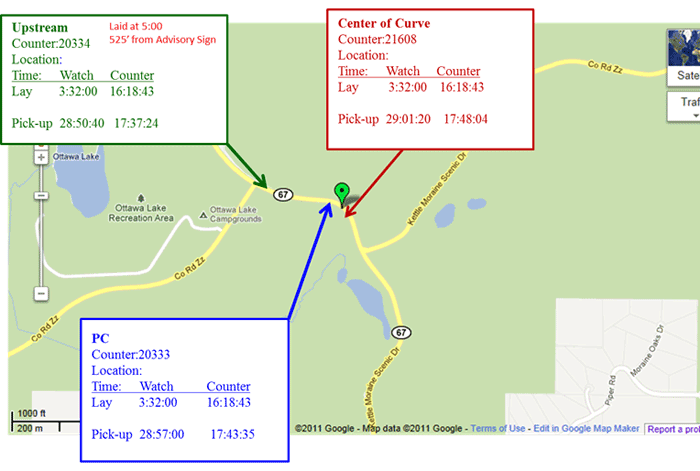
Figure 42. Map. Wisconsin Highway 67 1 month after data collection.
Wisconsin 67
Date 5/21-5/22 2012
Period: Before
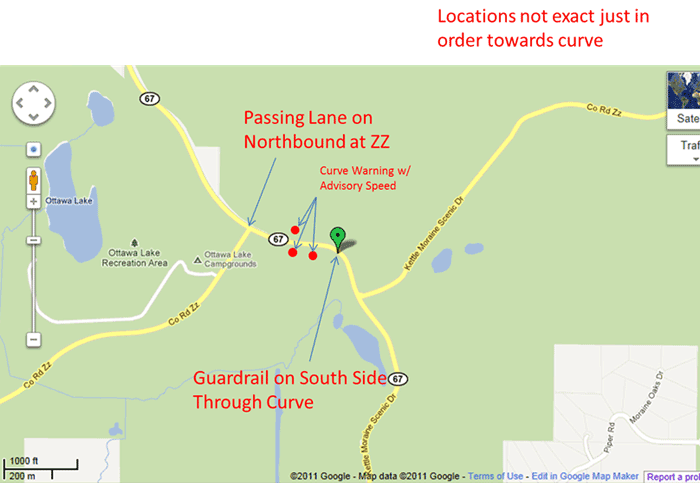
Figure 43. Map Wisconsin Highway 67 site layout.
Wisconsin 67
Date: 5/21-5/22/2012
Period: Before
N42o56.244' W088o28.056' |
location (gps at center of curve) |
2 Lanes, 24' |
# lanes and width |
Right |
curve direction (left or right) |
South (3.5' asphalt w/4' Gravel then guardrail through curve) North (1.5' asphalt w/ 3' gravel) |
shoulder type and width |
55 |
posted speed of curve in each direction |
55 |
tangent speed in each direction |
25 |
advisory speed in each direction |
See Below |
grade (average of 3 readings and list if positive or negative) |
See Below |
super elevation |
See Layout(5 Chevrons) |
location and type of signing before and in the curve |
Asphalt, good |
pavement type and condition |
None |
presence and location of street lighting |
Grade |
Begin W-E |
Center W-E |
End S-N |
|||||||||
|---|---|---|---|---|---|---|---|---|---|---|---|---|
SB |
Center |
NB |
Average |
SB |
Center |
NB |
Average |
SB |
Center |
NB |
Average |
|
-1.6 |
-1.7 |
-1.9 |
-1.73 |
-0.1 |
-0.12 |
-0.2 |
-0.14 |
0.7 |
0.6 |
1 |
0.77 |
|
Super Elevation |
Begin S-N |
Center S-N |
End W-E |
|||||||||
|---|---|---|---|---|---|---|---|---|---|---|---|---|
SB |
Center |
NB |
Average |
SB |
Center |
NB |
Average |
SB |
Center |
NB |
Average |
|
2 |
1.1 |
-0.4 |
0.90 |
5.8 |
5.2 |
5.1 |
5.37 |
3.6 |
3.2 |
3.1 |
3.30 |
|
Figure 44. Chart. Wisconsin Highway 67 site information.