

Evaluation of The TAPCO Sequential Dynamic Curve Warning System
APPENDIX B. SITE DATA TABLES AND FIGURES
In this appendix are the data tables and figures for each site. Each curve has three tables and two figures representing the data collected during the "before" and "1 month after" periods. The first two tables are the speed statistics collected at the PC and CC. The statistics compare the before data to 1 month after, with a negative change representing a reduction. The fraction of vehicles exceeding the speed limit change shows a percentage change in the vehicles exceeding the speed limit between the data collection periods. Also in those tables are speed statistics using the tracking methodology described in the literature review. The third table contains the statistics collected from the tracking methodology and shows the speed reductions that occurred from upstream to the respective point in the curve.
The figures are graphical representations of the data shown in the tables. One figure shows the vehicles mean and 85th percentile speeds at the data collection points, while the other figure shows the change in vehicles exceeding the speed limit at the data collection points.
Iowa Highway 144
| Before | 1 Month | Change | |
|---|---|---|---|
| ADT | 1435 | 1408 | -27 |
| Sample | 717 | 708 | |
| Upstream Mean Speed | 60.0 | 58.9 | -1.1 |
| Mean Speed | 50.7 | 49.2 | -1.5 |
| Standard Deviation | 5.2 | 5.8 | |
| 85th Percentile Speed | 56 | 55 | -1 |
| Fraction of vehicles exceeding advisory speed | |||
| Percentage of Vehicles 5+ Over Limit | 0.61 | 0.49 | -19.7% |
| Percentage of Vehicles 10+ Over Limit | 0.24 | 0.16 | -33.3% |
| Percentage of Vehicles 15+ Over Limit | 0.04 | 0.04 | 0.0% |
| Percentage of Vehicles 20+ Over Limit | 0.00 | 0.01 | 0.0% |
| Tracking Data | |||
| Sample | 705 | 700 | |
| Upstream Mean Speed | 60.0 | 59.1 | -0.9 |
| Mean Speed | 50.7 | 49.3 | -1.4 |
| Standard Deviation | 5.2 | 5.5 | |
| 85th Percentile Speed | 56 | 55 | -1 |
| Before | 1 Month | Change | |
|---|---|---|---|
| ADT | 1468 | 1428 | -40 |
| Sample | 718 | 713 | |
| Upstream Mean Speed | 60.0 | 58.9 | -1.1 |
| Mean Speed | 48 | 45.9 | -2.1 |
| Standard Deviation | 6.2 | 6.3 | |
| 85th Percentile Speed | 53 | 51 | -2 |
| Fraction of vehicles exceeding advisory speed | |||
| Percentage of Vehicles 5+ Over Limit | 0.42 | 0.26 | -38.1% |
| Percentage of Vehicles 10+ Over Limit | 0.12 | 0.05 | -58.3% |
| Percentage of Vehicles 15+ Over Limit | 0.01 | 0.01 | 0.0% |
| Percentage of Vehicles 20+ Over Limit | 0.00 | 0.00 | 0.0% |
| Tracking Data | |||
| Sample | 705 | 700 | |
| Upstream Mean Speed | 60.0 | 59.1 | -0.9 |
| Mean Speed | 48.3 | 46.0 | -2.3 |
| Standard Deviation | 5.6 | 6 | |
| 85th Percentile Speed | 53 | 51 | -2 |
| Before | 1 Month | Change | |
|---|---|---|---|
| Mean Speed Reduction Upstream to PC | 9 | 9.7 | 0.5 |
| Mean Speed Reduction Upstream to CC | 11.7 | 13.0 | 1.3 |
| Mean Speed Reduction PC to CC | 2.5 | 3.3 | 0.8 |
| 85th Percentile Speed Reduction Upstream to PC | 14 | 15 | 1 |
| 85th Percentile Speed Reduction Upstream to CC | 17 | 18 | 1 |
| 85th Percentile Speed Reduction PC to CC | 5 | 5 | 0 |
Iowa (Hwy 144)
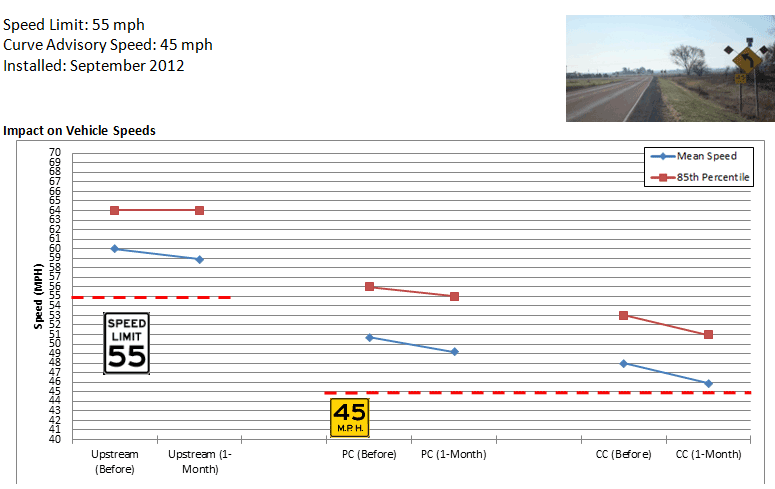
Figure 45. Graph. Impact on vehicle speed – Iowa Hwy 144.
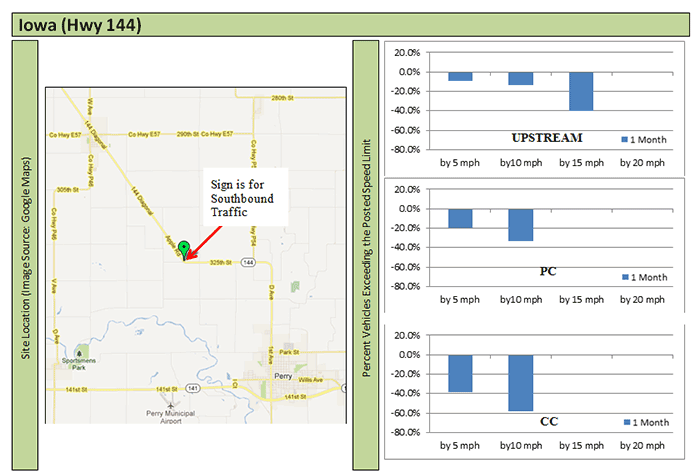
Figure 46. Map and graphs. Location and change in percentile vehicle speed – Iowa Hwy 144.
Missouri Highway 221
| Before | 1 Month | Change | |
|---|---|---|---|
| ADT | 5277 | 5158 | -119 |
| Sample | 2566 | 2523 | |
| Upstream Mean Speed | 52.2 | 52.8 | 0.6 |
| Mean Speed | 51.7 | 50.2 | -1.5 |
| Standard Deviation | 4.7 | 4.8 | |
| 85th Percentile Speed | 56 | 55 | -1 |
| Fraction of vehicles exceeding advisory speed | |||
| Percentage of Vehicles 5+ Over Limit | 0.94 | 0.88 | -6.4% |
| Percentage of Vehicles 10+ Over Limit | 0.70 | 0.58 | -17.1% |
| Percentage of Vehicles 15+ Over Limit | 0.25 | 0.17 | -32.0% |
| Percentage of Vehicles 20+ Over Limit | 0.04 | 0.02 | -50.0% |
| Tracking Data | |||
| Sample | 2501 | 2459 | |
| Upstream Mean Speed | 52.2 | 52.8 | 0.6 |
| Mean Speed | 51.7 | 50.2 | -1.5 |
| Standard Deviation | 4.7 | 4.8 | |
| 85th Percentile Speed | 57 | 55 | -2 |
| Before | 1 Month | Change | |
|---|---|---|---|
| ADT | 5274 | 5169 | -105 |
| Sample | 2559 | 2522 | |
| Upstream Mean Speed | 52.2 | 52.8 | 0.6 |
| Mean Speed | 48.3 | 48.6 | 0.3 |
| Standard Deviation | 4.4 | 4.6 | |
| 85th Percentile Speed | 53 | 53 | 0 |
| Fraction of vehicles exceeding advisory speed | |||
| Percentage of Vehicles 5+ Over Limit | 0.82 | 0.82 | 0.0% |
| Percentage of Vehicles 10+ Over Limit | 0.38 | 0.42 | 10.5% |
| Percentage of Vehicles 15+ Over Limit | 0.07 | 0.09 | 28.6% |
| Percentage of Vehicles 20+ Over Limit | 0.01 | 0.01 | 0.0% |
| Tracking Data | |||
| Sample | 2501 | 2459 | |
| Upstream Mean Speed | 52.2 | 52.8 | 0.6 |
| Mean Speed | 48.3 | 48.6 | 0.3 |
| Standard Deviation | 4.4 | 4.6 | |
| 85th Percentile Speed | 53 | 53 | 0 |
| Before | 1 Month | Change | |
|---|---|---|---|
| Mean Speed Reduction Upstream to PC | 0.6 |
2.6 |
2 |
| Mean Speed Reduction Upstream to CC | 3.9 |
4.3 |
0.4 |
| Mean Speed Reduction PC to CC | 3.4 |
1.7 |
-1.7 |
| 85th Percentile Speed Reduction Upstream to PC | 3 |
6 |
3 |
| 85th Percentile Speed Reduction Upstream to CC | 7 |
8 |
1 |
| 85th Percentile Speed Reduction PC to CC | 5 |
3 |
-2 |
Missouri (Hwy 221)
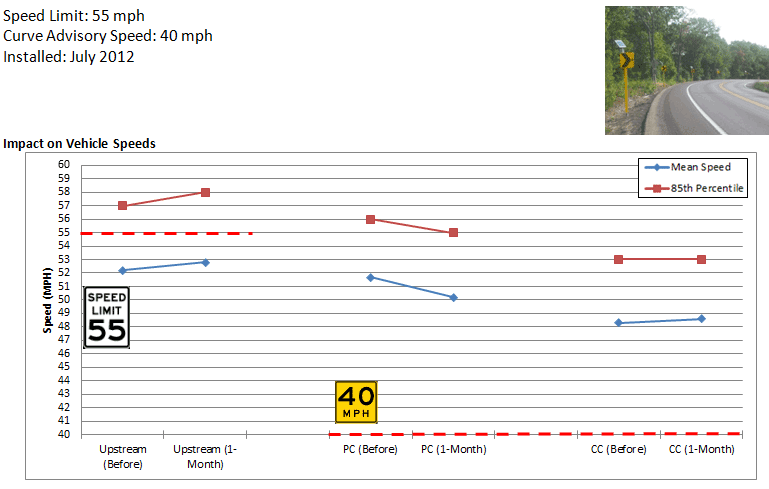
Figure 47. Graph. Impact on vehicle speed – Missouri Hwy 221.
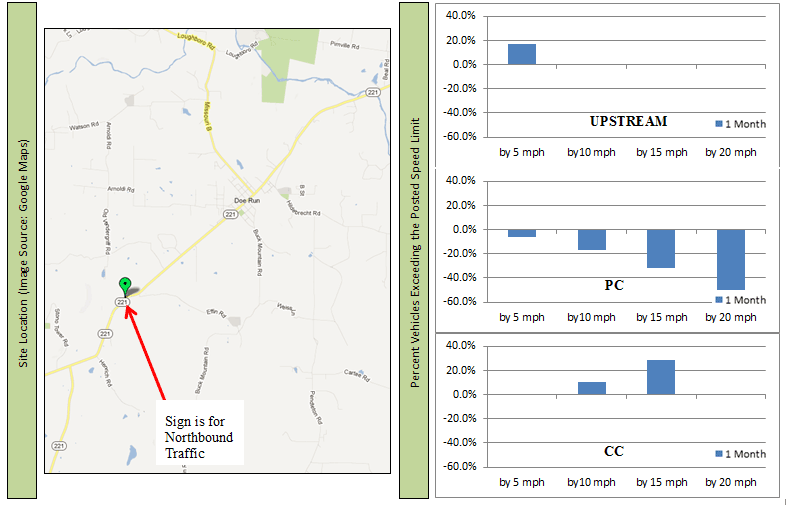
Figure 48. Map and graphs. Location and change in percentile vehicle speed – Missouri Hwy 221.
Washington SR 7
| Before | 1 Month | Change | |
|---|---|---|---|
| ADT | 1408 | 1413 | 5 |
| Sample | 763 | 766 | |
| Upstream Mean Speed | 42.5 | 40.5 | -2.0 |
| Mean Speed | 33.1 | 30.3 | -2.8 |
| Standard Deviation | 4.7 | 4.6 | |
| 85th Percentile Speed | 33 | 30 | -3 |
| Fraction of vehicles exceeding advisory speed | |||
| Percentage of Vehicles 5+ Over Limit | 0.96 | 0.89 | -7.3% |
| Percentage of Vehicles 10+ Over Limit | 0.80 | 0.56 | -30.0% |
| Percentage of Vehicles 15+ Over Limit | 0.37 | 0.18 | -51.4% |
| Percentage of Vehicles 20+ Over Limit | 0.09 | 0.02 | -77.8% |
| Sample | 716 | 733 | |
| Tracking Data | |||
| Upstream Mean Speed | 42.6 | 40.8 | -1.8 |
| Mean Speed | 33.3 | 30.5 | -2.8 |
| Standard Deviation | 4.6 | 4.4 | |
| 85th Percentile Speed | 38 | 35 | -3 |
| Before | 1 Month | Change | |
|---|---|---|---|
| ADT | 1420 | 1444 | 24 |
| Sample | 750 | 770 | |
| Upstream Mean Speed | 42.5 | 40.5 | -2.0 |
| Mean Speed | 27.2 | 25.8 | -1.4 |
| Standard Deviation | 2.9 | 3.3 | |
| 85th Percentile Speed | 30 | 29 | -1 |
| Fraction of vehicles exceeding advisory speed | |||
| Percentage of Vehicles 5+ Over Limit | 0.84 | 0.68 | -19.0% |
| Percentage of Vehicles 10+ Over Limit | 0.20 | 0.11 | -45.0% |
| Percentage of Vehicles 15+ Over Limit | 0.01 | 0.01 | 0.0% |
| Percentage of Vehicles 20+ Over Limit | 0.00 | 0.00 | 0.0% |
| Tracking Data | |||
| Sample | 716 | 733 | |
| Upstream Mean Speed | 42.6 | 40.8 | -1.8 |
| Mean Speed | 27.2 | 26.0 | -1.2 |
| Standard Deviation | 2.8 | 3.1 | |
| 85th Percentile Speed | 30 | 29 | -1 |
| Before | 1 Month | Change | |
|---|---|---|---|
Mean Speed Reduction Upstream to PC |
9.3 | 10.3 | 1 |
| Mean Speed Reduction Upstream to CC | 15.4 | 14.8 | -0.6 |
| Mean Speed Reduction PC to CC | 6.1 | 4.5 | -1.6 |
| 85th Percentile Speed Reduction Upstream to PC | 14 | 15.2 | 1.2 |
| 85th Percentile Speed Reduction Upstream to CC | 20 | 21 | 1 |
| 85th Percentile Speed Reduction PC to CC | 9 | 7 | -2 |
Washington (SR 7)
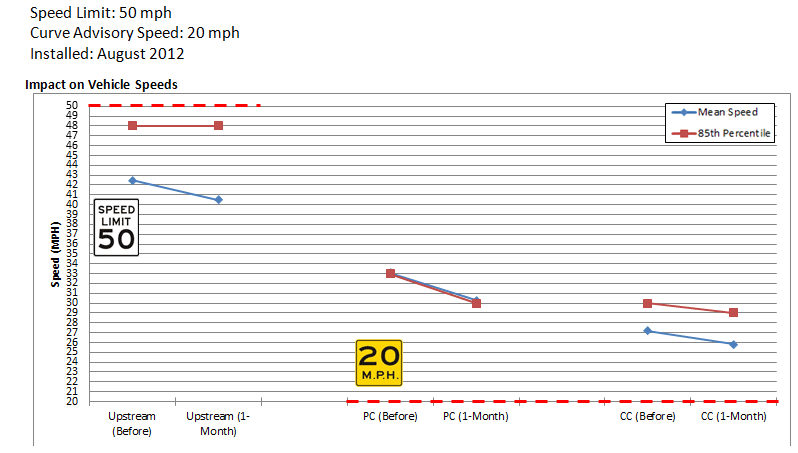
Figure 49. Graph. Impact on vehicle speed – Washington SR 7.
Washington (SR 7)
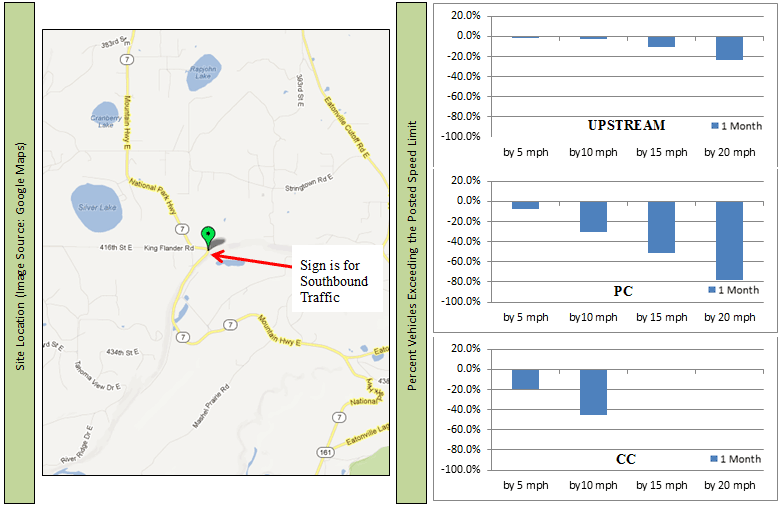
Figure 50. Map and graphs. Location and change in percentile vehicle speed – Washington SR 7.
Washington SR 9
| Before | 1 Month | Change | |
|---|---|---|---|
| ADT | 5533 | 6212 | 679 |
| Sample | 2702 | 3062 | |
| Upstream Mean Speed | 46.9 | 48.7 | 1.8 |
| Mean Speed | 41 | 39.6 | -1.4 |
| Standard Deviation | 5.0 | 5.0 | |
| 85th Percentile Speed | 46 | 45.0 | -1 |
| Fraction of vehicles exceeding advisory speed | |||
| Percentage of Vehicles 5+ Over Limit | 0.23 | 0.16 | -30.4% |
| Percentage of Vehicles 10+ Over Limit | 0.04 | 0.02 | -50.0% |
| Percentage of Vehicles 15+ Over Limit | 0.01 | 0.00 | -100.0% |
| Percentage of Vehicles 20+ Over Limit | 0.00 | 0.00 | 0.0% |
| Tracking Data | |||
| Sample | 2598 | 2957 | |
| Upstream Mean Speed | 47.1 | 48.8 | 1.7 |
| Mean Speed | 41.1 | 39.7 | -1.4 |
| Standard Deviation | 4.9 | 4.9 | |
| 85th Percentile Speed | 46 | 44 | -2 |
| Before | 1 Month | Change | |
|---|---|---|---|
| ADT | 5523 | 6227 | 704 |
| Sample | 2688 | 3081 | |
| Upstream Mean Speed | 46.9 | 48.7 | 1.8 |
| Mean Speed | 40.2 | 39.3 | -0.9 |
| Standard Deviation | 5.0 | 5.0 | |
| 85th Percentile Speed | 45 | 44 | -1 |
| Fraction of vehicles exceeding advisory speed | |||
| Percentage of Vehicles 5+ Over Limit | 0.19 | 0.14 | -26.3% |
| Percentage of Vehicles 10+ Over Limit | 0.03 | 0.02 | -33.3% |
| Percentage of Vehicles 15+ Over Limit | 0.00 | 0.00 | 0.0% |
| Percentage of Vehicles 20+ Over Limit | 0.00 | 0.00 | 0.0% |
| Tracking Data | |||
| Sample | 2598 | 2957 | |
| Upstream Mean Speed | 47.1 | 48.8 | 1.7 |
| Mean Speed | 40.3 | 39.3 | -1 |
| Standard Deviation | 5.0 | 4.9 | |
| 85th Percentile Speed | 45 | 44 | -1 |
| Before | 1 Month | Change | |
|---|---|---|---|
| Mean Speed Reduction Upstream to PC | 6.0 | 9.1 | 3.1 |
| Mean Speed Reduction Upstream to CC | 6.8 | 9.5 | 2.7 |
| Mean Speed Reduction PC to CC | 0.8 | 0.4 | -0.4 |
| 85th Percentile Speed Reduction Upstream to PC | 9 | 13 | 4 |
| 85th Percentile Speed Reduction Upstream to CC | 10 | 13 | 3 |
| 85th Percentile Speed Reduction PC to CC | 2 | 1 | -1 |
Washington (SR 9)
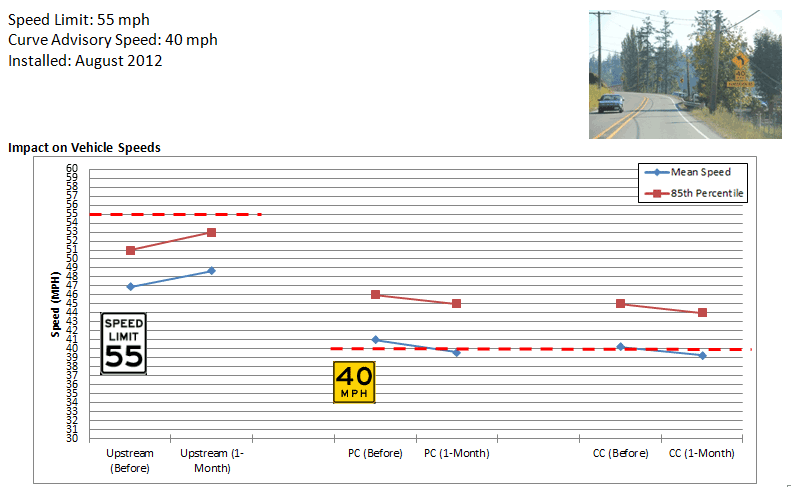
Figure 51. Graph. Impact on vehicle speed – Washington SR 9
Washington (SR 9)
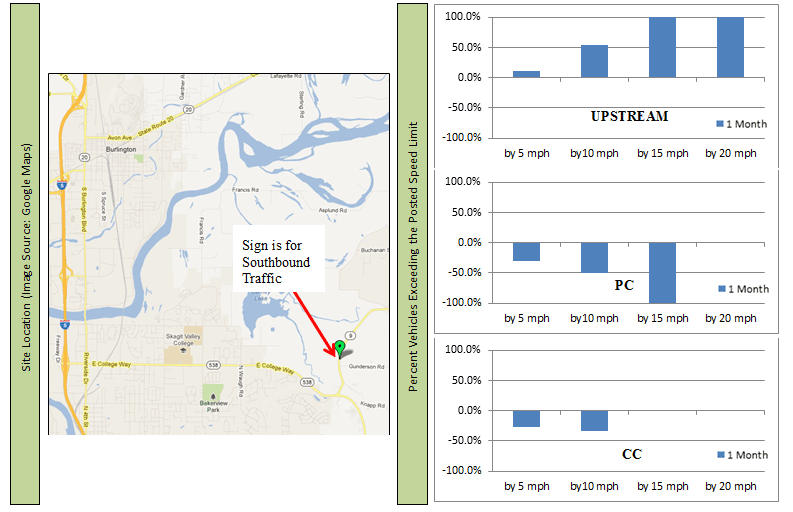
Figure 52. Map and graphs. Location and change in percentile vehicle speed – Washington SR 9.
Washington SR 203
| Before | 1 Month | Change | |
|---|---|---|---|
| ADT | 10088 | 10761 | 673 |
| Sample | 4901 | 5190 | |
| Upstream Mean Speed | 53.8 | 54.2 | 0.4 |
| Mean Speed | 53.5 | 51.5 | -2.0 |
| Standard Deviation | 5.0 | 4.5 | |
| 85th Percentile Speed | 58 | 56 | -2 |
| Fraction of vehicles exceeding advisory speed | |||
| Percentage of Vehicles 5+ Over Limit | 0.96 | 0.94 | -2.1% |
| Percentage of Vehicles 10+ Over Limit | 0.83 | 0.71 | -14.5% |
| Percentage of Vehicles 15+ Over Limit | 0.43 | 0.23 | -46.5% |
| Percentage of Vehicles 20+ Over Limit | 0.08 | 0.03 | -62.5% |
| Tracking Data | |||
| Sample | 4637 | 4902 | |
| Upstream Mean Speed | 54.1 | 54.4 | 0.3 |
| Mean Speed | 53.6 | 51.6 | -2 |
| Standard Deviation | 4.7 | 4.5 | |
| 85th Percentile Speed | 58 | 56 | -2 |
| Before | 1 Month | Change | |
|---|---|---|---|
| ADT | 10120 | 10756 | 636 |
| Sample | 4921 | 5148 | |
| Upstream Mean Speed | 53.8 | 54.2 | 0.4 |
| Mean Speed | 51.6 | 51.5 | -0.1 |
| Standard Deviation | 4.6 | 4.6 | |
| 85th Percentile Speed | 56 | 56 | 0 |
| Fraction of vehicles exceeding advisory speed | |||
| Percentage of Vehicles 5+ Over Limit | 0.94 | 0.94 | 0.0% |
| Percentage of Vehicles 10+ Over Limit | 0.72 | 0.70 | -2.8% |
| Percentage of Vehicles 15+ Over Limit | 0.25 | 0.24 | -4.0% |
| Percentage of Vehicles 20+ Over Limit | 0.03 | 0.03 | 0.0% |
| Tracking Data | |||
| Sample | 4637 | 4902 | |
| Upstream Mean Speed | 54.1 | 54.4 | 0.3 |
| Mean Speed | 51.8 | 51.6 | -0.2 |
| Standard Deviation | 4.5 | 4.6 | |
| 85th Percentile Speed | 56 | 56 | 0 |
| Before | 1 Month | Change | |
|---|---|---|---|
| Mean Speed Reduction Upstream to PC | 0.5 | 2.8 | 2.3 |
| Mean Speed Reduction Upstream to CC | 2.4 | 2.8 | 0.4 |
| Mean Speed Reduction PC to CC | 1.8 | 0 | -1.8 |
| 85th Percentile Speed Reduction Upstream to PC | 3 | 6 | 3 |
| 85th Percentile Speed Reduction Upstream to CC | 6 | 7 | 1 |
| 85th Percentile Speed Reduction PC to CC | 3 | 2 | -1 |
Washington (SR 203)
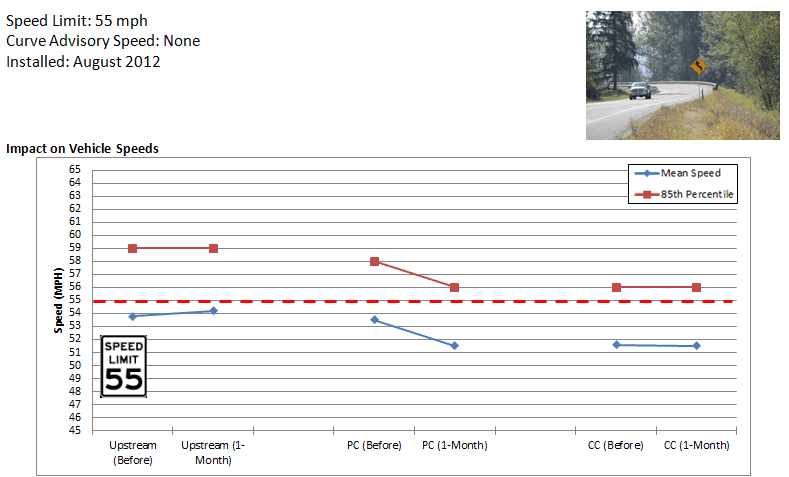
Figure 53. Graph Impact on vehicle speed – Washington SR 203.
Washington (SR 203)
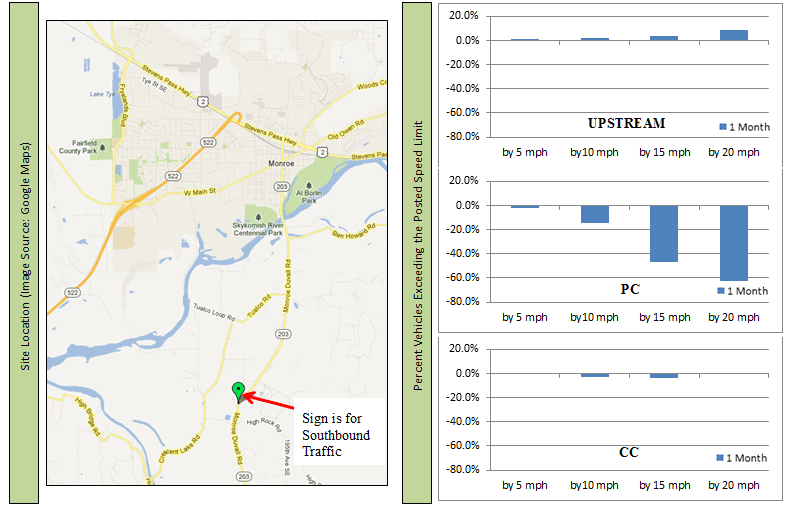
Figure 54. Map and graphs. Location and change in percentile vehicle speed – Washington SR 203.
Wisconsin Highway 20
| Before | 1 Month | Change | |
|---|---|---|---|
| ADT | 3583 | 3250 | -333 |
| Sample | 1692 | 1556 | |
| Upstream Mean Speed | 53.7 | 55.2 | 1.5 |
| Mean Speed | 39.6 | 37.8 | -1.8 |
| Standard Deviation | 7.6 | 7.1 | |
| 85th Percentile Speed | 47 | 45 | -2 |
| Fraction of vehicles exceeding advisory speed | |||
| Percentage of Vehicles 5+ Over Limit | 0.77 | 0.70 | -9.1% |
| Percentage of Vehicles 10+ Over Limit | 0.58 | 0.47 | -19.0% |
| Percentage of Vehicles 15+ Over Limit | 0.27 | 0.16 | -40.7% |
| Percentage of Vehicles 20+ Over Limit | 0.07 | 0.03 | -57.1% |
| Tracking Data | |||
| Sample | 1318 | 1251 | |
| Upstream Mean Speed | 54.1 | 55.7 | 1.6 |
| Mean Speed | 42.1 | 40.1 | -2 |
| Standard Deviation | 5.7 | 5.4 | |
| 85th Percentile Speed | 48 | 45 | -3 |
| Before | 1 Month | Change | |
| ADT | 3128 | 2823 | -305 |
| Sample | 1456 | 1350 | |
| Upstream Mean Speed | 53.7 | 55.2 | 1.5 |
| Mean Speed | 37.4 | 35.6 | -1.8 |
| Standard Deviation | 4.8 | 4.6 | |
| 85th Percentile Speed | 42 | 40 | -2 |
| Fraction of vehicles exceeding advisory speed | |||
| Percentage of Vehicles 5+ Over Limit | 0.77 | 0.63 | -18.2% |
| Percentage of Vehicles 10+ Over Limit | 0.33 | 0.18 | -45.5% |
| Percentage of Vehicles 15+ Over Limit | 0.06 | 0.02 | -66.7% |
| Percentage of Vehicles 20+ Over Limit | 0.01 | 0.00 | -100.0% |
| Tracking Data | |||
| Sample | 1318 | 1251 | |
| Upstream Mean Speed | 54.1 | 55.7 | 1.6 |
| Mean Speed | 37.8 | 36.1 | -1.7 |
| Standard Deviation | 4.4 | 4.1 | |
| 85th Percentile Speed | 42 | 40 | -2 |
| Before | 1 Month | Change | |
|---|---|---|---|
| Mean Speed Reduction Upstream to PC | 12.0 | 15.6 | 3.6 |
| Mean Speed Reduction Upstream to CC | 16.2 | 19.5 | 3.3 |
| Mean Speed Reduction PC to CC | 4.3 | 4.0 | -0.3 |
| 85th Percentile Speed Reduction Upstream to PC | 18 | 20 | 2 |
| 85th Percentile Speed Reduction Upstream to CC | 23 | 25 | 2 |
| 85th Percentile Speed Reduction PC to CC | 8 | 7 | -1 |
Wisconsin (Hwy 20)
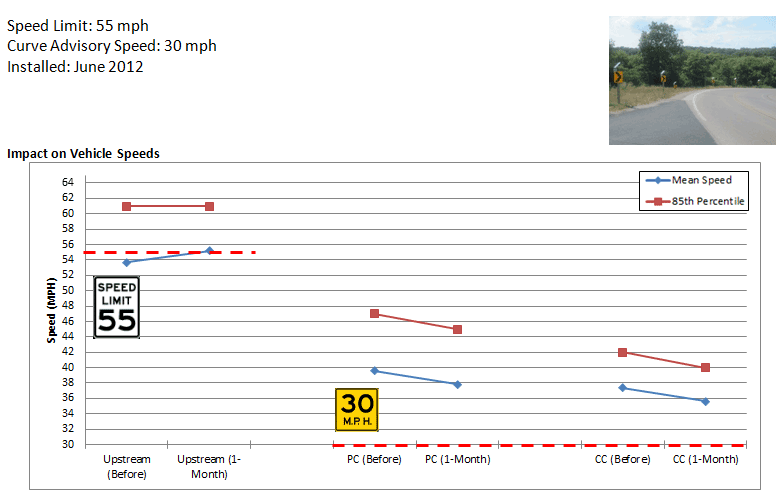
Figure 55. Graph. Impact on vehicle speed – Wisconsin Hwy 20.
Wisconsin (Hwy 20)
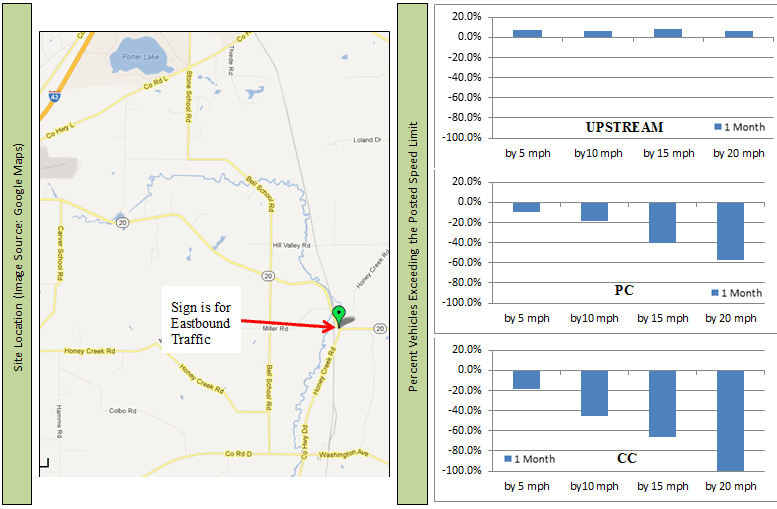
Figure 56. Map and graphs. Location and change in percentile vehicle speed – Wisconsin Hwy 20.
Wisconsin Highway 67
| Before | 1 Month | Change | |
|---|---|---|---|
| ADT | 3494 | 4018 | 524 |
| Sample | 1726 | 1992 | |
| Upstream Mean Speed | 50.0 | 48.9 | -1.1 |
| Mean Speed | 46.1 | 44.5 | -1.6 |
| Standard Deviation | 5.9 | 6 | |
| 85th Percentile Speed | 52 | 51 | -1 |
| Fraction of vehicles exceeding advisory speed | |||
| Percentage of Vehicles 5+ Over Limit | 0.99 | 0.99 | 0.0% |
| Percentage of Vehicles 10+ Over Limit | 0.97 | 0.94 | -3.1% |
| Percentage of Vehicles 15+ Over Limit | 0.87 | 0.80 | -8.0% |
| Percentage of Vehicles 20+ Over Limit | 0.65 | 0.51 | -21.5% |
| Tracking Data | |||
| Sample | 1668 | 1931 | |
| Upstream Mean Speed | 50.0 | 48.9 | -1.1 |
| Mean Speed | 46.1 | 44.5 | -1.6 |
| Standard Deviation | 5.8 | 6.0 | |
| 85th Percentile Speed | 52 | 51 | -1 |
| Before | 1 Month | Change | |
|---|---|---|---|
| ADT | 3496 | 4004 | 508 |
| Sample | 1713 | 1979 | |
| Upstream Mean Speed | 50.0 | 48.9 | -1.1 |
| Mean Speed | 39.7 | 37.9 | -1.8 |
| Standard Deviation | 5.0 | 5.0 | |
| 85th Percentile Speed | 45 | 43 | -2 |
| Fraction of vehicles exceeding advisory speed | |||
| Percentage of Vehicles 5+ Over Limit | 0.97 | 0.95 | -2.1% |
| Percentage of Vehicles 10+ Over Limit | 0.86 | 0.76 | -11.6% |
| Percentage of Vehicles 15+ Over Limit | 0.53 | 0.38 | -28.3% |
| Percentage of Vehicles 20+ Over Limit | 0.15 | 0.08 | -46.7% |
| Tracking Data | |||
| Sample | 1668 | 1931 | |
| Upstream Mean Speed | 50.0 | 48.9 | -1.1 |
| Mean Speed | 39.7 | 37.9 | -1.8 |
| Standard Deviation | 5.0 | 5.0 | |
| 85th Percentile Speed | 45 | 43 | -2 |
| Before | 1 Month | Change | |
|---|---|---|---|
| Mean Speed Reduction Upstream to PC | 3.9 | 4.40 | 0.5 |
| Mean Speed Reduction Upstream to CC | 10.2 | 11.0 | 0.8 |
| Mean Speed Reduction PC to CC | 6.4 | 6.6 | 0.2 |
| 85th Percentile Speed Reduction Upstream to PC | 11 | 13 | 2 |
| 85th Percentile Speed Reduction Upstream to CC | 19 | 20 | 1 |
| 85th Percentile Speed Reduction PC to CC | 9 | 9 | 0 |
Wisconsin (Hwy 67)
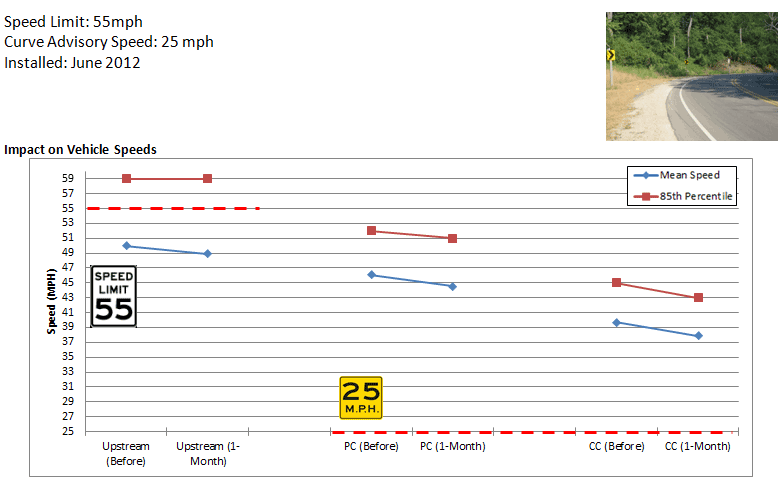
Figure 57. Graph. Impact on vehicle speed – Wisconsin Hwy 67
Wisconsin (Hwy 67)
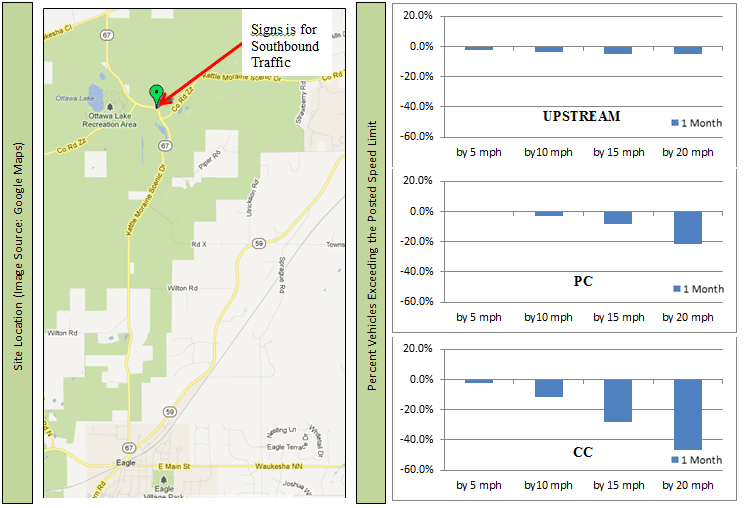
Figure 58. Map and graphs. Location and change in percentile vehicle speed - Wisconsin.
Wisconsin Highway 213
| Before | 1 Month | Change | |
|---|---|---|---|
| ADT | 2369 | 2249 | -120 |
| Sample | 1156 | 1119 | |
| Upstream Mean Speed | 58.8 | 59.8 | 1.0 |
| Mean Speed | 55.3 | 54.6 | -0.7 |
| Standard Deviation | 7 | 6.6 | |
| 85th Percentile Speed | 61 | 61 | 0 |
| Fraction of vehicles exceeding advisory speed | |||
| Percentage of Vehicles 5+ Over Limit | 0.63 | 0.57 | -9.5% |
| Percentage of Vehicles 10+ Over Limit | 0.28 | 0.21 | -25.0% |
| Percentage of Vehicles 15+ Over Limit | 0.03 | 0.03 | 0.0% |
| Percentage of Vehicles 20+ Over Limit | 0.00 | 0.00 | 0.0% |
| Tracking Data | |||
| Sample | 1134 | 1098 | |
| Upstream Mean Speed | 58.9 | 59.9 | 1 |
| Mean Speed | 55.5 | 54.8 | -0.7 |
| Standard Deviation | 6.5 | 6.2 | |
| 85th Percentile Speed | 61 | 61 | 0 |
| Before | 1 Month | Change | |
|---|---|---|---|
| ADT | 2552 | 2428 | -124 |
| Sample | 1220 | 1193 | |
| Upstream Mean Speed | 58.8 | 59.8 | 1.0 |
| Mean Speed | 53.2 | 52.2 | -1.0 |
| Standard Deviation | 9.7 | 9.8 | |
| 85th Percentile Speed | 61 | 60 | -1 |
| Fraction of vehicles exceeding advisory speed | |||
| Percentage of Vehicles 5+ Over Limit | 0.59 | 0.52 | -11.9% |
| Percentage of Vehicles 10+ Over Limit | 0.25 | 0.20 | -20.0% |
| Percentage of Vehicles 15+ Over Limit | 0.02 | 0.03 | 50.0% |
| Percentage of Vehicles 20+ Over Limit | 0.00 | 0.00 | 0.0% |
| Tracking Data | |||
| Sample | 1134 | 1098 | |
| Upstream Mean Speed | 58.9 | 59.9 | 1 |
| Mean Speed | 54.7 | 54.0 | -0.7 |
| Standard Deviation | 7.7 | 7.5 | |
| 85th Percentile Speed | 61 | 61 | 0 |
| Before | 1 Month | Change | |
|---|---|---|---|
| Mean Speed Reduction Upstream to PC | 3.4 | 5.1 | 1.7 |
| Mean Speed Reduction Upstream to CC | 4.2 | 5.9 | 1.7 |
| Mean Speed Reduction PC to CC | 0.8 | 0.8 | 0 |
| 85th Percentile Speed Reduction Upstream to PC | 9 | 10 | 1 |
| 85th Percentile Speed Reduction Upstream to CC | 10 | 11.5 | 1.5 |
| 85th Percentile Speed Reduction PC to CC | 2 | 2 | 0 |
Wisconsin (Hwy 213)
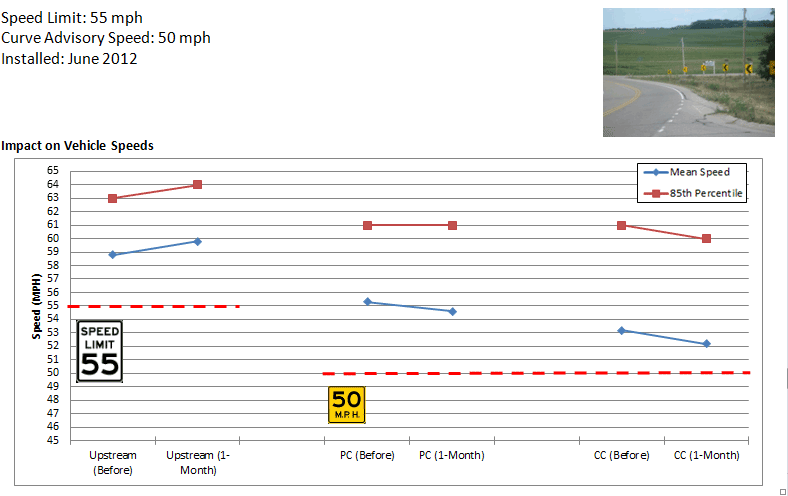
Figure 59. Graph. Impact on vehicle speed – Wisconsin Hwy 213.
Wisconsin (Hwy 213)
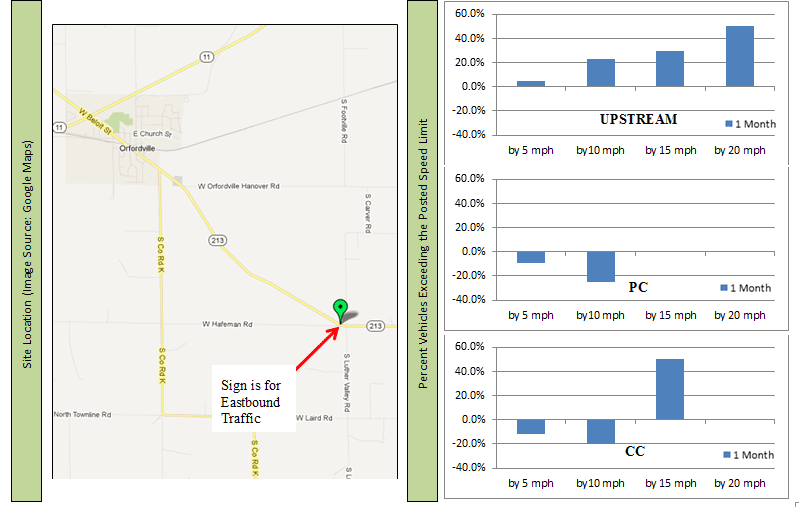
Figure 60. Map and graphs. Location and change in percentile vehicle speed – Wisconsin Hwy 213.
Texas FM 109
| Before | 1 Month | Change | |
|---|---|---|---|
| ADT | 2187 | 2031 | -156 |
| Sample | 1036 | 954 | |
| Upstream Mean Speed | 58.2 | 59.6 | 1.4 |
| Mean Speed | 46.6 | 45.8 | -0.8 |
| Standard Deviation | 5.7 | 5.4 | |
| 85th Percentile Speed | 52 | 51 | -1 |
| Fraction of vehicles exceeding advisory speed | |||
| Percentage of Vehicles 5+ Over Limit | 0.92 | 0.90 | -2.2% |
| Percentage of Vehicles 10+ Over Limit | 0.68 | 0.62 | -8.8% |
| Percentage of Vehicles 15+ Over Limit | 0.30 | 0.23 | -23.3% |
| Percentage of Vehicles 20+ Over Limit | 0.07 | 0.04 | 0.0% |
| Before | 1 Month | Change | |
|---|---|---|---|
| ADT | 2129 | 1991 | -138 |
| Sample | 1017 | 938 | |
| Upstream Mean Speed | 58.2 | 59.6 | 1.4 |
| Mean Speed | 45.2 | 43.8 | -1.4 |
| Standard Deviation | 5.2 | 4.7 | |
| 85th Percentile Speed | 50 | 48 | -2 |
| Fraction of vehicles exceeding advisory speed | |||
| Percentage of Vehicles 5+ Over Limit | 0.90 | 0.85 | -5.7% |
| Percentage of Vehicles 10+ Over Limit | 0.60 | 0.43 | -27.7% |
| Percentage of Vehicles 15+ Over Limit | 0.18 | 0.09 | -51.4% |
| Percentage of Vehicles 20+ Over Limit | 0.02 | 0.01 | 0.0% |
Texas (FM 109)
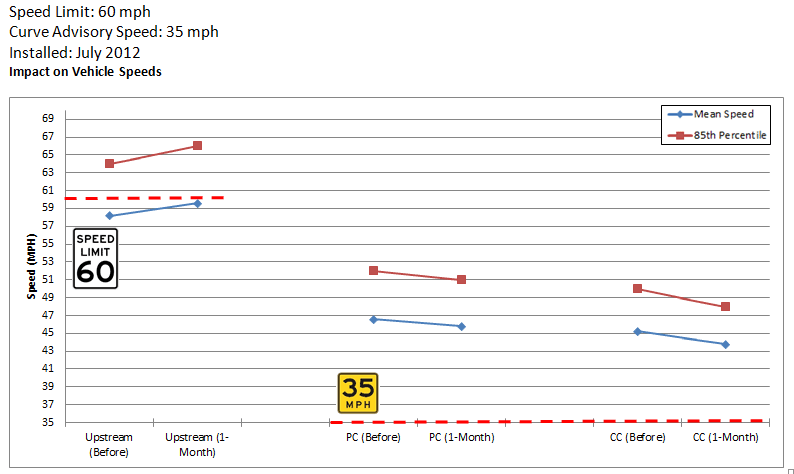
Figure 61. Graph. Impact on vehicle speed – Texas FM 109
Texas (FM 109)
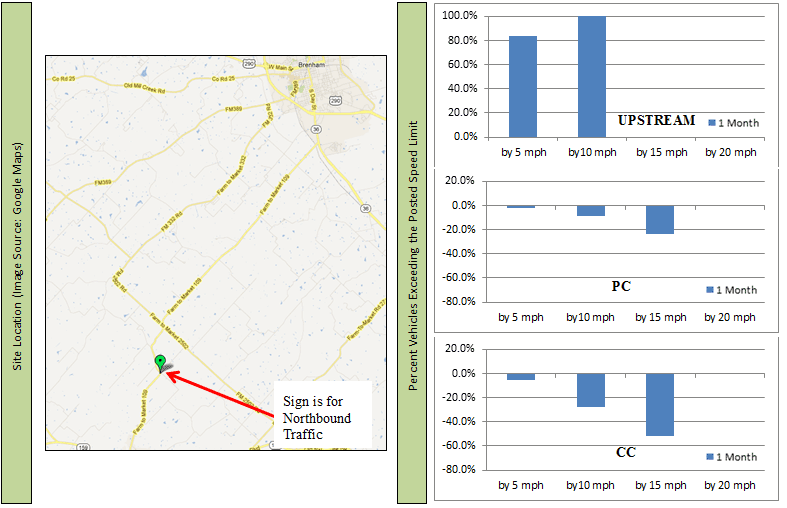
Figure 62. Map and graphs. Location and change in percentile vehicle speed – Texas FM 109.
Texas FM 407
| Before | 1 Month | Change | |
|---|---|---|---|
| ADT | 2480 | 2883 | 403 |
| Sample | 856 | 1443 | |
| Upstream Mean Speed | 61.3 | 60.1 | -1.2 |
| Mean Speed | 51.5 | 49.7 | -1.8 |
| Standard Deviation | 5.6 | 5.3 | |
| 85th Percentile Speed | 57 | 55 | -2 |
| Fraction of vehicles exceeding advisory speed | |||
| Percentage of Vehicles 5+ Over Limit | 0.89 | 0.83 | -6.7% |
| Percentage of Vehicles 10+ Over Limit | 0.67 | 0.53 | -20.9% |
| Percentage of Vehicles 15+ Over Limit | 0.31 | 0.18 | -41.9% |
| Percentage of Vehicles 20+ Over Limit | 0.06 | 0.03 | 0.0% |
| *Note: Only 18 hours of data collected because of puncture in the tube | |||
| Before | 1 Month | Change | |
|---|---|---|---|
| ADT | 2238 | 2885 | 647 |
| Sample | 579 | 1446 | |
| Upstream Mean Speed | 61.3 | 60.1 | -1.2 |
| Mean Speed | 47.3 | 46.2 | -1.1 |
| Standard Deviation | 6.3 | 5.6 | |
| 85th Percentile Speed | 53 | 51 | -2 |
| Fraction of vehicles exceeding advisory speed | |||
| Percentage of Vehicles 5+ Over Limit | 0.73 | 0.67 | -8.2% |
| Percentage of Vehicles 10+ Over Limit | 0.37 | 0.26 | -29.7% |
| Percentage of Vehicles 15+ Over Limit | 0.10 | 0.04 | -60.0% |
| Percentage of Vehicles 20+ Over Limit | 0.01 | 0.01 | 0.0% |
| *Note: Only 16 hours of data collected because of puncture in the tube | |||
Texas (FM 407)
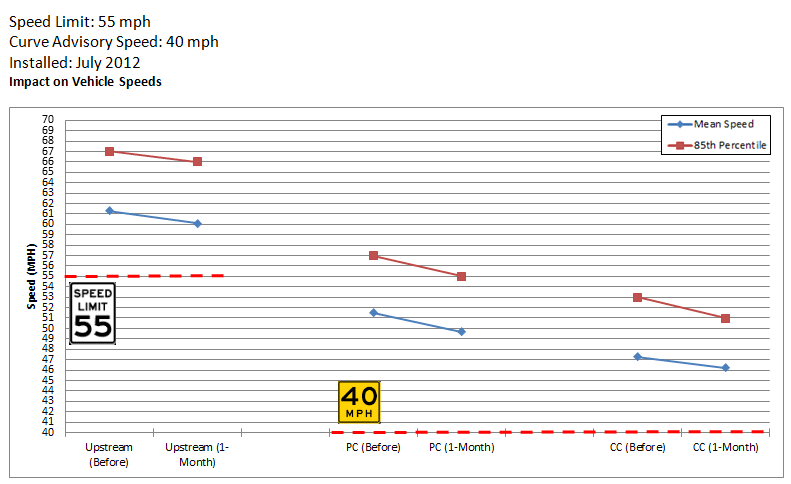
Figure 63. Graph. Impact on vehicle speed – Texas FM 407.
Texas (FM 407)
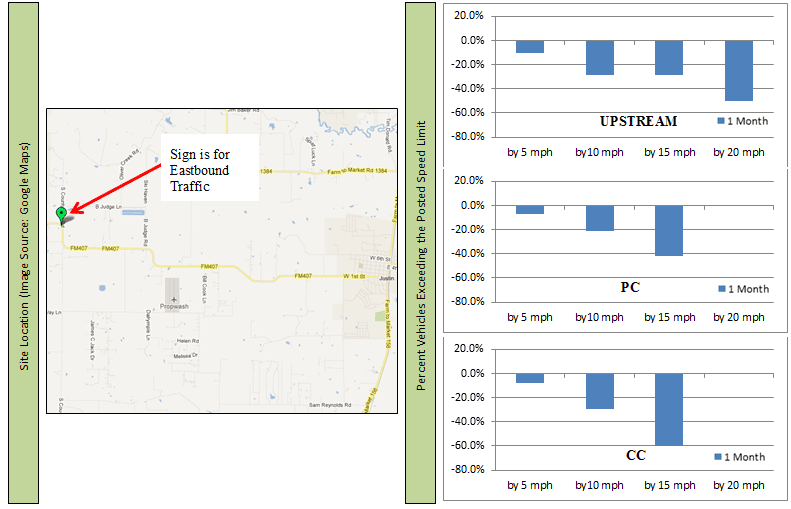
Figure 64. Map and graphs. Location and change in percentile vehicle speed – Texas FM 407.
Texas FM 530
| Before | 1 Month | Change | |
|---|---|---|---|
| ADT | 675 | 418 | -257 |
| Sample | 71 | 200 | |
| Upstream Mean Speed | 62.1 | 60.0 | -2.1 |
| Mean Speed | 47.1 | 46.2 | -0.9 |
| Standard Deviation | 9.3 | 6.3 | |
| 85th Percentile Speed | 55 | 53 | -2 |
| Fraction of vehicles exceeding advisory speed | |||
| Percentage of Vehicles 5+ Over Limit | 0.86 | 0.88 | 2.3% |
| Percentage of Vehicles 10+ Over Limit | 0.77 | 0.62 | -19.5% |
| Percentage of Vehicles 15+ Over Limit | 0.38 | 0.33 | -13.2% |
| Percentage of Vehicles 20+ Over Limit | 0.20 | 0.09 | 0.0% |
| *Note: The “before” count had many unknown counts, leading to fewer counts for the 24-hour period | |||
| Before | 1 Month | Change | |
|---|---|---|---|
| ADT | 488 | 430 | -58 |
| Sample | 237 | 204 | |
| Upstream Mean Speed | 62.1 | 60.0 | -2.1 |
| Mean Speed | 43.2 | 41.2 | -2.0 |
| Standard Deviation | 6.1 | 5.2 | |
| 85th Percentile Speed | 48.6 | 46 | -2.6 |
| Fraction of vehicles exceeding advisory speed | |||
| Percentage of Vehicles 5+ Over Limit | 0.79 | 0.63 | -20.3% |
| Percentage of Vehicles 10+ Over Limit | 0.44 | 0.28 | -36.4% |
| Percentage of Vehicles 15+ Over Limit | 0.11 | 0.04 | -63.6% |
| Percentage of Vehicles 20+ Over Limit | 0.02 | 0.00 | 0.0% |
Texas (FM 530)
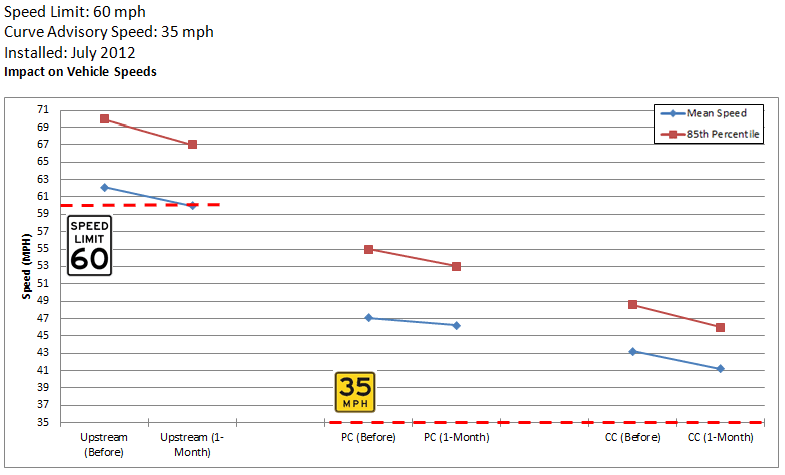
Figure 65. Graph. Impact on vehicle speed – Texas FM 530
Texas (FM 530)
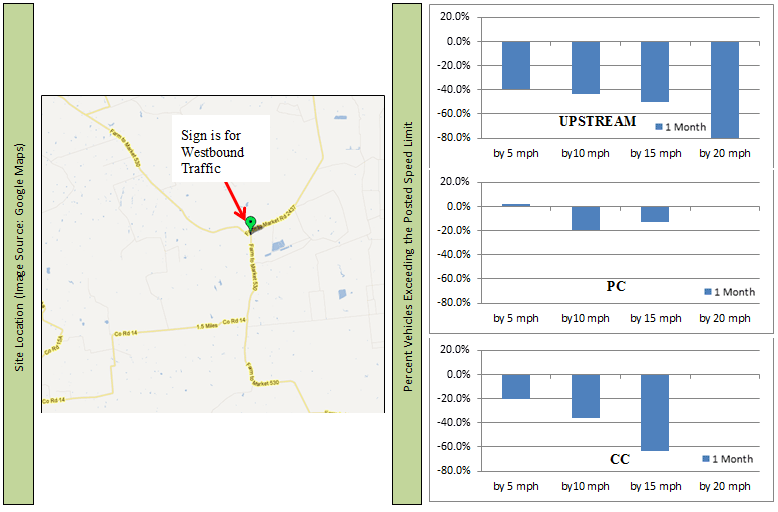
Figure 66. Map and graphs. Location and change in percentile vehicle speed – Texas FM 530.
Texas FM 1148
| Before | 1 Month | Change | |
|---|---|---|---|
| ADT | 3549 | 3742 | 193 |
| Sample | 1746 | 1832 | |
| Upstream Mean Speed | 59.3 | 58.9 | -0.4 |
| Mean Speed | 51.9 | 49.5 | -2.4 |
| Standard Deviation | 5 | 4.8 | |
| 85th Percentile Speed | 57 | 54 | -3 |
| Fraction of vehicles exceeding advisory speed | |||
| Percentage of Vehicles 5+ Over Limit | 0.94 | 0.86 | -8.5% |
| Percentage of Vehicles 10+ Over Limit | 0.70 | 0.51 | -27.1% |
| Percentage of Vehicles 15+ Over Limit | 0.28 | 0.13 | -53.6% |
| Percentage of Vehicles 20+ Over Limit | 0.06 | 0.02 | 0.0% |
| Before | 1 Month | Change | |
|---|---|---|---|
| ADT | 3538 | 3708 | 170 |
| Sample | 1748 | 1831 | |
| Upstream Mean Speed | 59.3 | 58.9 | -0.4 |
| Mean Speed | 48.5 | 48.4 | -0.1 |
| Standard Deviation | 4.5 | 4.9 | |
| 85th Percentile Speed | 53 | 53 | 0 |
| Fraction of vehicles exceeding advisory speed | |||
| Percentage of Vehicles 5+ Over Limit | 0.83 | 0.79 | -4.8% |
| Percentage of Vehicles 10+ Over Limit | 0.40 | 0.41 | 2.5% |
| Percentage of Vehicles 15+ Over Limit | 0.08 | 0.08 | 0.0% |
| Percentage of Vehicles 20+ Over Limit | 0.01 | 0.01 | 0.0% |
Texas (FM 1148)
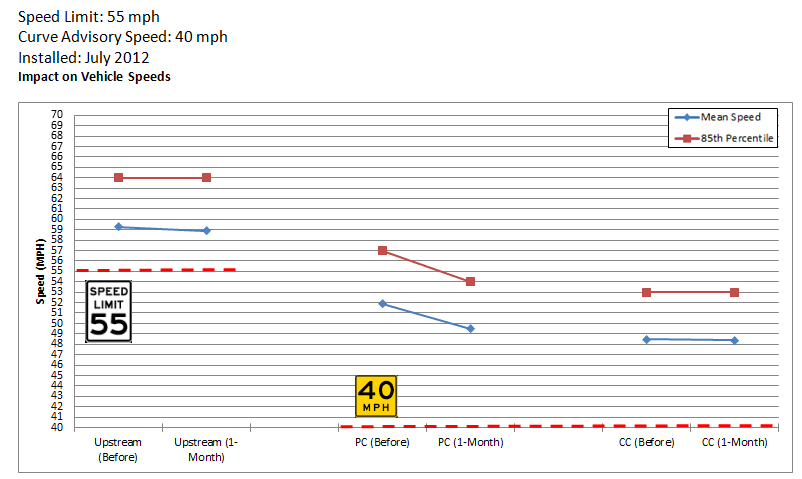
Figure 67. Graph. Impact on vehicle speed – Texas FM 1148
Texas (FM 1148)
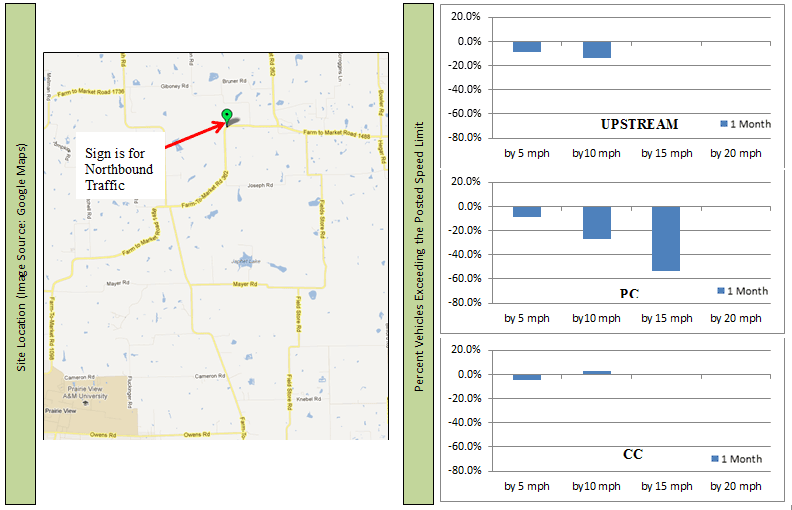
Figure 68. Map and graphs. Location and change in percentile vehicle speed – Texas FM 1148