The Implementation of Full Depth UHCP Waffle Bridge Deck Panels
APPENDIX A: EXPERIMENTAL INVESTIGATION
This section discusses the test setup, instrumentation and loading protocols used for the experimental investigation of the UHPC waffle deck system as well as the test observations and results.
Test Setup
A schematic of the test setup used for the UHPC waffle deck system is shown in Figure 7, which was established to closely replicate the critical regions of the field structure in the laboratory. As noted earlier, the setup represented an end section of the prototype bridge encompassing two adjacent girders including a portion of an exterior girder. The UHPC deck panels were supported on two 24-ft long prestressed concrete girders having cross sections of girder type LXA 42, which were simply supported at the ends on concrete foundation blocks as shown in Figure 7.
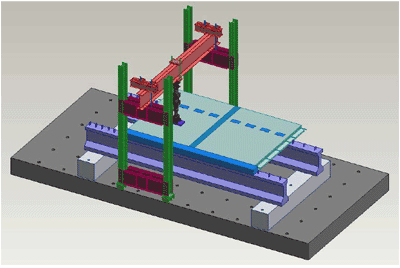
Figure 7: Schematic of the test setup used for testing of the UHPC Waffle deck panel system.
The foundation blocks were post-tensioned to the strong floor of the laboratory using a total of four one-inch diameter high strength threaded rod to prevent them from experiencing any lateral movement during testing. The girders were established by cutting a 48-ft long LXA 42 prestressed concrete girder, which was used by Iowa DOT as a standard girder in the past. The girders were placed on the foundation blocks at a center-to-center distance of 7ft and 4 inches between them. They were supported on rollers at one end and pined at the other end. After the girders were set in place, the waffle deck panels were placed on the girders with specified bearing length (1.25 inches) on each girder.
To establish a positive moment connection between the waffle deck and the interior girder, 12 in. long Grade 60, No.6 (db = 0.75 in, where db is diameter of the bar) mild steel dowel bars were embedded at the left end face of the panels using high strength epoxy (see Figure 8b). In addition, two No.6 bars were placed and tied to the dowel bars along the girder length to represent the effect of the continuous slab over the inner girder, which is expected in the prototype bridge. Two No.6 bars were provided in the panel-to-panel joint (transverse joint) as the main reinforcement to resist the bending moment about the longitudinal axis (see Figure 8a). The connection between the exterior girder and the waffle deck was established using a shear pocket (see Figure 8c). Every shear pocket contained at least one shear hook extending from the girder.
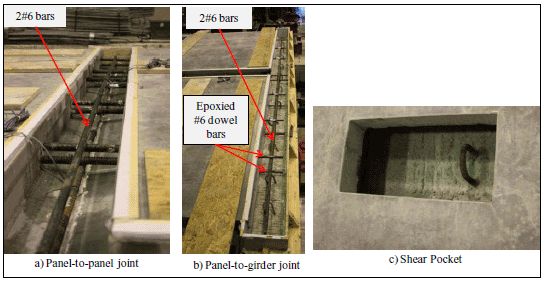
Figure 8: Details of the reinforcement provided in various joints.
The joint between the two deck panels as well as those between the panels and the girders were cast using UHPC mixed in the laboratory at ISU. UHPC required for the joint fill was prepared in total of five batches using two Imer Mortarman 750 mixers. Every batch used nine bags of Ductal® premix and produced 5.3 ft3 of UHPC mix. Standard cylinders (3in. x 6 in.) were cast for every batch to establish the strength gain of the joint fill with time. A standard flow table was used to measure the flowability of every batch of UHPC and measured values are presented in Table 2. UHPC was poured from one end of the longitudinal joint (panel-to-girder joint) and it travelled along the entire length of the joints (see Figure 9). After casting, all UHPC joints were covered with form plywood to minimize any moisture loss. The test cylinders were also subjected to the same curing conditions as the joints. They were tested at ISU in regular intervals to monitor the strength gain with time. Table 3 shows the details of the UHPC strength gain with time.
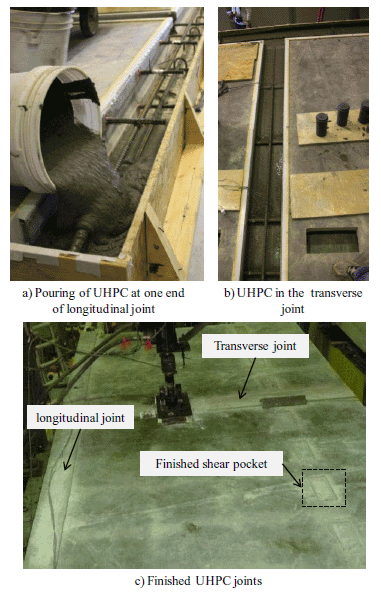
Figure 9: UHPC joint pour
| Batch number | Mix temperature (C0°) | Flow | Comments | |
|---|---|---|---|---|
| Static (in.) | Dynamic (in.) | |||
| 1 | 30 | 8.5 | 9.75 | longitudinal joint |
| 2 | 29 | 9 | 10.125 | longitudinal joint |
| 3 | 30 | 8.75 | 9.75 | transverse joint |
| 4 | 26 | 9.5 | Off Table | Shear pockets |
| 5 | 27 | 8.5 | 9.75 | Shear pockets |
| Time (days) | Strength (psi) |
|---|---|
| 1 | 11591 |
| 14 | 15201 |
| 28 | 18831 |
The test preparation work began immediately upon completion of the joints. The plywood was removed after 3 days and the testing got underway 34 days after casting of the UHPC joints. A ± 55kip capacity fatigue hydraulic actuator, mounted to a steel reaction frame as shown in Figure 7, was used to apply the load to the test unit. The frame was post-tensioned to the strong floor of the laboratory using four 1 1/4 in.-diameter high strength bars. A 10 in. by 20 in. steel plate was used at the loading end of the actuator to simulate a truck wheel load on the panel for all testing described in this report.
Instrumentation
This section presents the details of instrumentation used to monitor the performance of the waffle deck system during testing. Several different types of instruments were used for this study, including linear variable differential transducers (LVDTs), string potentiometers and strain gauges. String potentiometers were used to measure the vertical displacements of the deck panels as well as the bridge girders. The locations and identifications used for these string potentiometers are shown in Figure 10a and Figure 10b.
LVDTs were placed along the panel-to-panel joint region to capture any possible gap opening along the transverse joint during testing. LVDTs were also used down the depth of the panels to measure average strains and neutral axis depth during loading (see Figure 10c). Also, the width of the flexural cracks along the transverse ribs was monitored during testing using LVDTs. A number of embedded strain gauges were used to measure the strain demands in the reinforcement along the transverse and longitudinal ribs of the panels and in the reinforcement placed within the joints. The No.6 (db = 0.75 in., where db is diameter of the bar) dowel bars epoxied into the side face of the deck panels were also gauged to monitor the strain demands in these bars during testing. Figure 11 and Figure 12 show the locations of the strain gauges on the bottom and top deck reinforcement, respectively. During the test, the data from all gauges and displacement devices were recorded using a computer based data acquisition system.
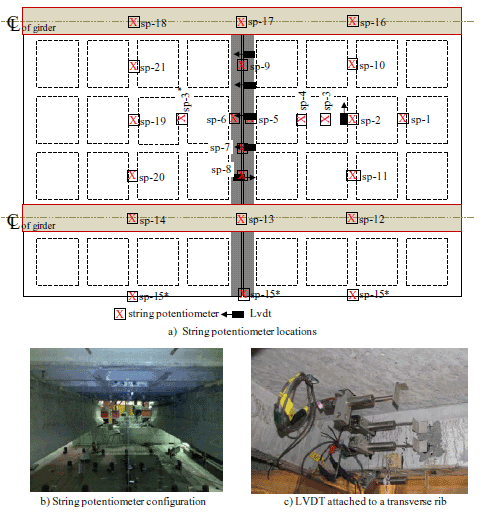
Figure 10: Schematic of the displacement transducers mounted to the test unit.
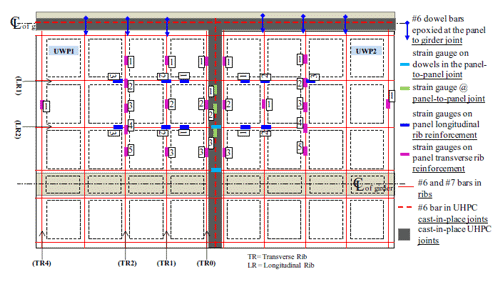
Figure 11: Location of strain gauges used on the bottom deck reinforcing bars.
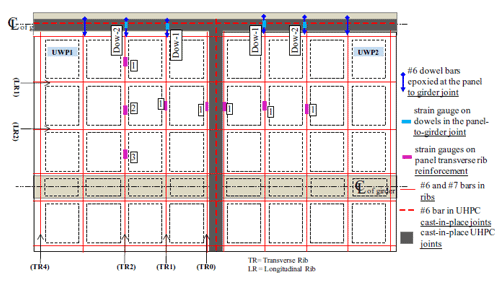
Figure 12: Location of strain gauges on the top deck reinforcing bars and dowel bars.
Load Protocols
The performance of UHPC waffle deck system, including the UHPC joints, was examined using six different tests and a single wheel truck load. Two different locations were chosen to apply the load along the centerline between the two girders: one was at the center of the deck panel and the other was at the center of the transverse joint between the deck panels. The critical locations for the tests were determined using a 3D finite element analysis model of the test specimen in ABAQUS software (ABAQUS, 2009). For each test location, a service load test, a fatigue test and an ultimate load test were conducted. The service and ultimate load tests were performed using monotonic increments of loads and these tests were paused during loading to the target values for visual inspection of any damage to the test system, including formation of cracks. For the fatigue test, the system was subjected to one million cycles at a constant frequency of 2 Hz. This test was paused twice during the tests and the same maximum load was applied in a quasi-static manner to examine any progressive damage to the system.
The specimen was load tested in the following order: 1) service load test of deck panel UWP2, 2) service load test of the panel-to-panel joint (transverse joint), 3) fatigue test of the panel-to-panel joint, 4) ultimate load test of the panel-to-panel joint, 5) fatigue test of panel UWP1, and 6) ultimate load test of panel UWP1. More details of each test and expected damage established from the finite element analysis are summarized in Table 4.
| Test Number | Test Description | Location | Maximum Load | Expected Damage |
|---|---|---|---|---|
| 1 | Service load test panel-2 | Center of the panel | 1.33a x 16kips = 21.3 kips | Micro cracking in ribs |
| 2 | Service load test on transverse joint | Center of the joint | 1.75b x 16 kips = 28 kips | Micro cracking in joint |
| 3 | Fatigue test on the transverse Joint | Center of the joint | 28 kips (1 million cycles) | No prediction was made |
| 4 | Ultimate load test of transverse joint | Center of the joint | 48 kips | Visible flexural cracks (more than one) along the joint and transverse ribs |
| 5 | Fatigue test on the panel-1 | Center of the joint | 21.3 kips (1 million cycles) | No prediction was made |
| 6 | Ultimate load test of the panel | Center of the joint | 40 kips | Several visible flexural cracks along transverse ribs |
a, b – dynamic load allowance factors from AASHTO Table 3.6.2.1-1
Panel Service Load Test (Test 1)
As noted earlier, a 10 in. x 20 in. plate represented the dimensions of a wheel, and a maximum load of 21.3 kips was applied at the center of panel UWP2 to simulate the service load condition. This load was established using the AASHTO service truck wheel load of 16 kips with a 1.33 factor to account for the 33% load increase suggested to account for the wheel load impact from the moving loads. The 3D finite element analysis of the test setup using ABAQUS confirmed the most critical location being one wheel at the center of the panel than placing two wheels at off-centered positions. To ensure no strength or stiffness degradation would take place due to repeated loading, the panel was subjected to three load cycles at this load level. The load-deflection curve established at the center of the panel for this test is shown in Figure 13a. For this test, a nearly linear relationship was observed between the load and deflection, with the maximum recorded deflection during the first cycle being 0.02 inches. This deflection corresponds to L/4400 (L = the span length between the girder), which is significantly less than the specified AASHTO limit of L/800 recommended for the serviceability condition (Section 9.5.2) of continuous span bridges with pedestrian traffic. The AASHTO allowable serviceability displacement of L/800 would lead to 0.11 inches for the tested system.
As noted earlier, a 10 in. x 20 in. plate represented the dimensions of a wheel, and a maximum load of 21.3 kips was applied at the center of panel UWP2 to simulate the service load condition. This load was established using the AASHTO service truck wheel load of 16 kips with a 1.33 factor to account for the 33% load increase suggested to account for the wheel load impact from the moving loads. The 3D finite element analysis of the test setup using ABAQUS confirmed the most critical location being one wheel at the center of the panel than placing two wheels at off-centered positions. To ensure no strength or stiffness degradation would take place due to repeated loading, the panel was subjected to three load cycles at this load level. The load-deflection curve established at the center of the panel for this test is shown in Figure 13a. For this test, a nearly linear relationship was observed between the load and deflection, with the maximum recorded deflection during the first cycle being 0.02 inches. This deflection corresponds to L/4400 (L = the span length between the girder), which is significantly less than the specified AASHTO limit of L/800 recommended for the serviceability condition (Section 9.5.2) of continuous span bridges with pedestrian traffic. The AASHTO allowable serviceability displacement of L/800 would lead to 0.11 inches for the tested system.
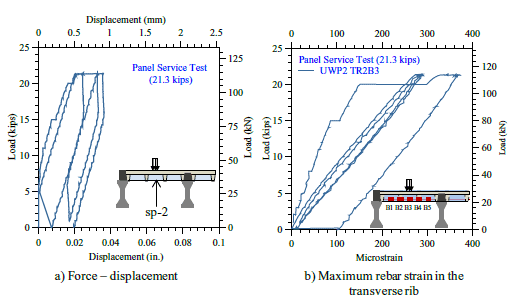
Figure 13: Measured force-displacement response and peak rebar strain from gauge B3 at the center of the transverse rib TR2 of panel UWP2.
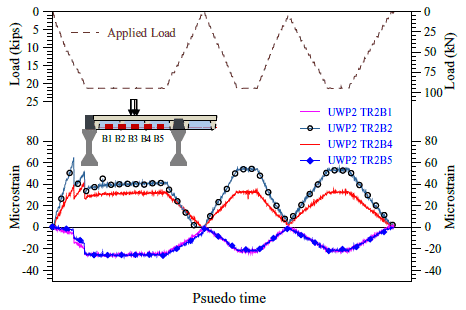
Figure 14: Measured strains along the bottom reinforcement of the transverse rib TR2 of panel UWP2.
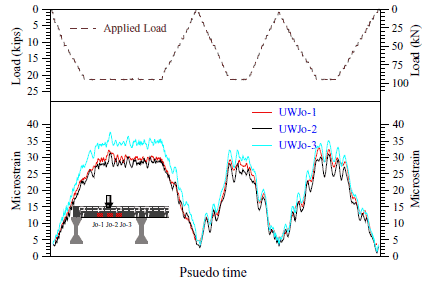
Figure 15: Measured strains along a bottom reinforcement of the panel-to-panel joint.
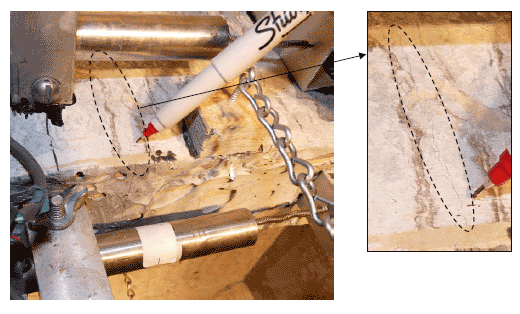
Figure 16: A hairline crack in the UWP2 panel transverse rib TR2 at 21.3 kips.
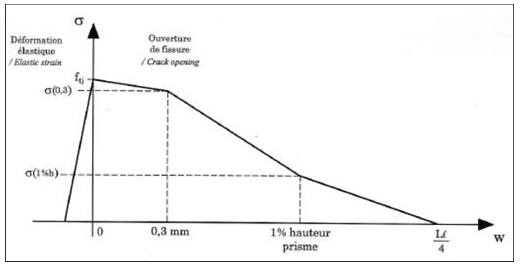
Figure 17: A relationship proposed for the UHPC tensile strength variation as a function of crack width (AFGC 2002).
Joint Service Load Test (Test 2)
Similar to the panel service load test, the transverse panel-to-panel joint test was then conducted under the service loading condition. In this case, the maximum load of 28 kips was used, which represented the AASHTO service load of 16 kips for one wheel times 1.75 factor, which accounted for 75% increase in load to account for the wheel load impact on joints due to moving loads. Similar to the previous service load test, the critical location of the load was determined from the finite element analysis and the load was repeated three times to ensure the stability of the force-displacement response of the system. The applied load vs. the measured deflection at the center of the joint is shown in Figure 18a. Again, a linear response was obtained with a maximum deflection reaching only 0.022 in. during the first load cycle. This deflection corresponds to L/4000, which is 20% of the specified AASHTO limit of L/800 (Section 9.5.2 in AASHTO (2007) for continuous spans with pedestrian traffic under the serviceability condition.
The load vs. strain plot for the gauge recorded the maximum strains and the strain variation along a bottom reinforcement in the joint are shown in Figure 18b and Figure 19, respectively. The peak recorded strain in the joint bottom reinforcement was 170 με, indicating significant reserve capacity of the joint. The strain variations obtained for the bottom reinforcement in the transverse rib TR2 of panels UWP2 and UWP1 are shown in Figure 20 and Figure 21, respectively. Both figures show comparable strain demands, indicating that the applied joint load was evenly distributed to both panels. Figure 22 shows the variation of strains at the center of the rib across the transverse ribs of panel-1, indicating their relative contribution. No cracking was observed at 21.3 kips load. However at the peak load of 28 kips, a single hairline crack having width less than 0.002 in. was observed on the transverse ribs forming the joint (see Figure 23). Given that this crack is significantly smaller than 0.0118 in. (0.3 mm) (see Figure 17) corresponding to initiation of fiber pull out and strength degradation of UHPC in tension, it s concluded that the overall behavior of the transverse joint subjected to service load was outstanding. The test results also indicated that the system performance satisfied the deflection and crack width requirements recommended for the serviceability condition by AASHTO (AASHTO, 2007).
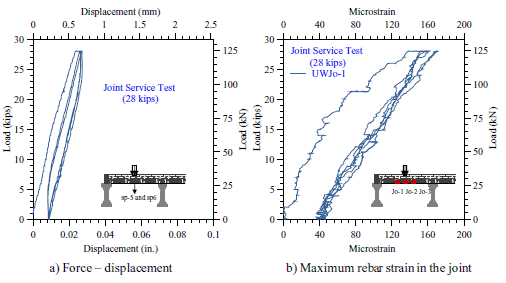
Figure 18: Measured force-displacement response and peak rebar strain at the center of the joint at the service load.
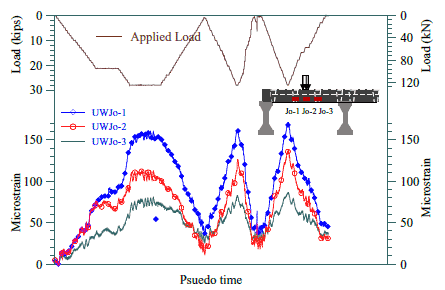
Figure 19: Measured strains along the bottom reinforcement of the joint during the service load test.
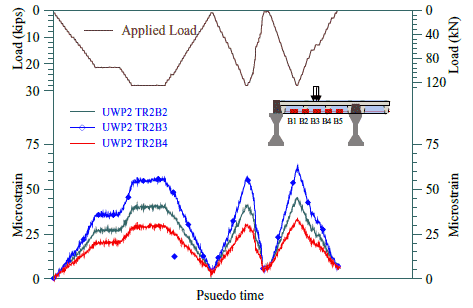
Figure 20: Measured strains in the bottom reinforcement of the transverse rib (TR2) along the length of panel UWP2 at service load.
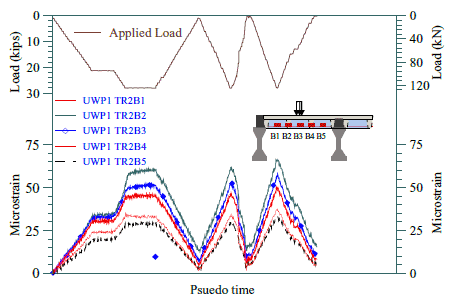
Figure 21: Measured strains in the bottom reinforcement of the transverse rib (TR2) along the length of panel UWP1 at service load.
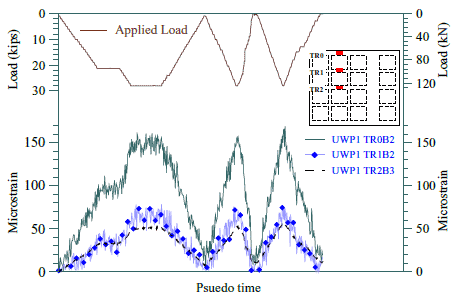
Figure 22: Measured strains at the center of the panel across the transverse ribs of UWP1 at service load.
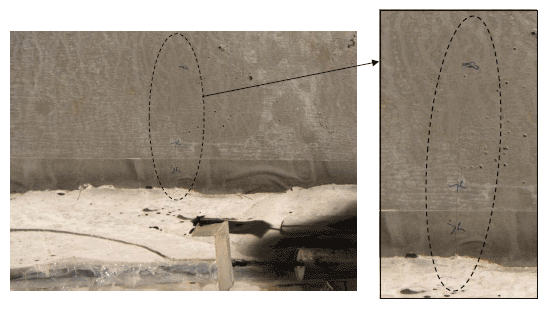
Figure 23: A hairline crack formed at the center of underside of the transverse joint at 28 kips.
Joint Fatigue Load Test (Test 3)
The transverse joint between the waffle deck panels was subjected to one million cycles to test the joint for potential low amplitude fatigue damage. The load variation was computer controlled in a sinusoidal manner between 1 kip and 28 kips at a frequency of 2 Hz. In other words, the peak load of 28 kips was reached twice within a one-second interval. During the test that lasted for several days as well as at the end of fatigue test, the deck panels and the joint were monitored for formation of any new cracks. Except for those formed during the joint service load test, no further cracks developed during the joint fatigue test. The load, displacements and strain data obtained from selected gauges from the test were recorded continuously for 5 seconds at 20 Hz frequency at the end of every 1800 cycles (i.e., at every 15 min.). In addition, the fatigue test was paused and static joint load tests were conducted at the end of 168,000, 333,875 and 1 million cycles to determine the influence of fatigue damage on the joint and system behavior.
Based on the recorded data, the displacements recorded at the center of the joint at 28 kip and 1 kip are plotted as a function of the load cycle during the fatigue loading in Figure 24. It is apparent that that the gauge data experienced drift due to ambient condition and other reasons during the test. However, when the displacement corresponding to the load increment of 27 kips (i.e., 28 kips – 1 kip) was examined, it is clear that this displacement remained almost constant throughout the test and the change in the displacement reading is largely due to noise observed at 1 kip. With the variation of the displacement being very small and limitations with the sensitivity of the string potentiometers, it is concluded that the UHPC did not experience any fatigue damage.
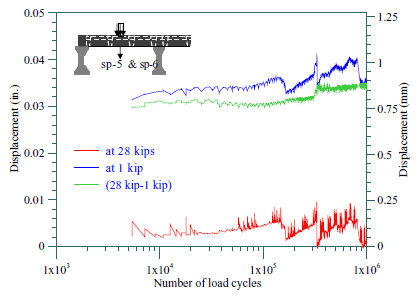
Figure 24: The variation of the peak displacement at the center of the joint during the joint fatigue test.
Figure 25 shows the strains recorded by the gauge mounted to the joint transverse reinforcement located at the center of the joint as a function of the load cycle. Although the drifts in measured data are apparent, the change in strain remained almost constant at a value of 135 με as the load increased from 1 to 28 kips. This variation is comparable to the peak strain of 170 με recorded during the service load test. Except for the noise in the data, the crack width in the transverse joint was nearly constant over the entire fatigue test and is shown in Figure 26.
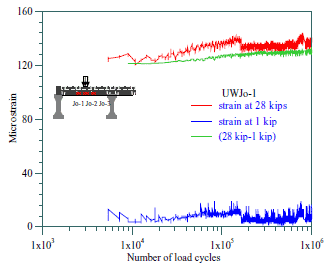
Figure 25: The variation of the peak strain in the bottom joint transverse reinforcement during the joint fatigue test.
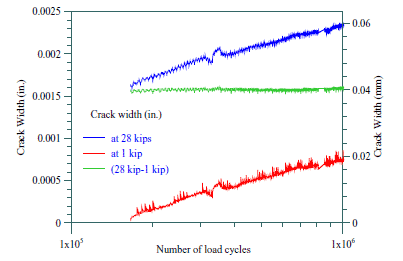
Figure 26: The variation of the crack width in the transverse joint with number of load cycles.
For the static load tests performed at the end of 168,000, 333,875 and 1 million cycles, the load-displacement, peak strain in the bottom reinforcement in the joint, and the crack width in transverse ribs forming the joint during the intermediate static load tests are presented in Figure 27. The initial secant stiffness at the peak load of panel-to-panel joint at the end of 168,000, 333,875 and 1 million cycles of loading is 1166.7 kip/in, 1135.6 kip/in and 1139.2 kip/in respectively, which compares closely with each other and shows variations of less than 3%. It can be seen from these figures that the joint or the UHPC waffle deck system did not experience any significant fatigue damage after subjected to one million cycles of amplified serviced load.
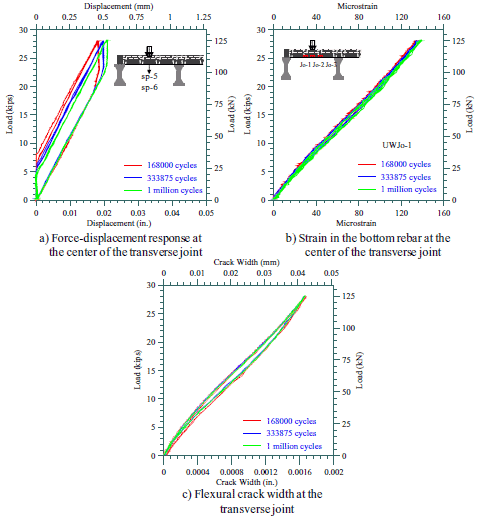
Figure 27: Measured responses of the waffle deck system from the static service load tests conducted during the joint fatigue test.
Joint Ultimate Load Test (Test4)
The ultimate load test was carried out to investigate the adequacy of the transverse joint at the ultimate limit state. The load corresponding to this limit state was defined as a factor of the service wheel load of 16 kips without causing any significant damaging the joint so that the waffle deck system could be used to conduct the fatigue and ultimate load tests at the center of a panel. Using a load factor of three, the maximum load suitable for conducting the ultimate load test was defined as 48 kips. Similar to the service load test, the joint was subjected to three load cycles at this load level to ensure the stability of the force-displacement response of the system. The load-deflection curve established at the center of the joint for this test is shown in Figure 28a. The transverse joint exhibited a linear force-displacement response even for this test, with insignificant damage and a maximum deflection of 0.05 inches. This deflection corresponds to L/1760, which is 46% of the AASHTO serviceability limit of L/800 (Section 9.5.2 in AASHTO 2007) for continuous span bridges with pedestrian traffic.
The strain variations along the bottom reinforcement in the joint as a function of the applied load are shown in Figure 28b. The peak strain in the joint region bottom reinforcement was 330 με, which is only about 15% of the yield strain of the reinforcement. The strain variations in the bottom reinforcement in the transverse rib TR2 of the panels UWP2 and UWP1 are shown in Figure 29 and Figure 30, respectively. Figure 31 shows the variation of the strain at the center of the rib across the transverse ribs of panel UWP1, indicating their relative participation in resisting the load. A series of hairline cracks were observed in the central region of the joint and are shown in Figure 32. The maximum crack width measured along the transverse ribs forming the joint was 0.003 inches, which can be seen in Figure 33.
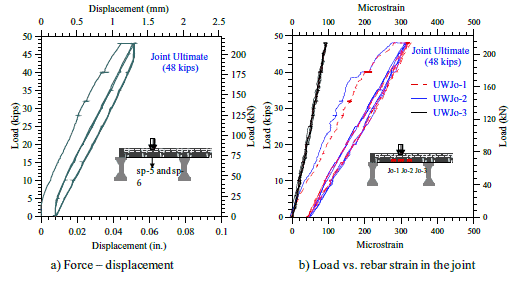
Figure 28: Measured force-displacement response and peak rebar strain at the center of the joint at the ultimate load of 48 kips.
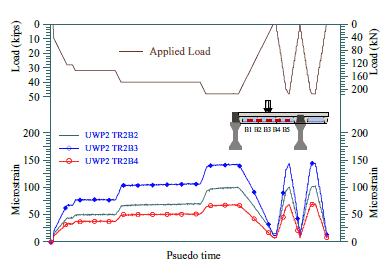
Figure 29: Measured strains in the bottom reinforcement of transverse rib TR2 along the length of Panel UWP2 at the ultimate load.
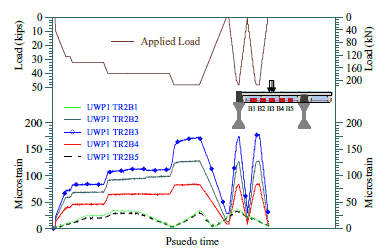
Figure 30: Measured strains in the bottom reinforcement of transverse rib TR2 along the length of Panel UWP1 at the ultimate load.
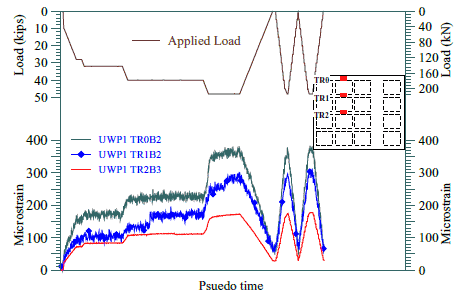
Figure 31: Measured strains at the center of the panel across the transverse ribs of panel UWP1at joint ultimate load.
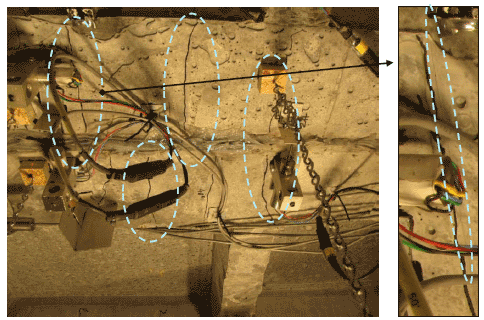
Figure 32: Hairline cracks formed at the center of underside of the transverse joint at the ultimate load of 48 kips.
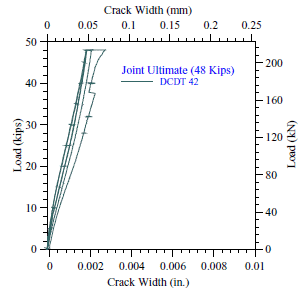
Figure 33: The variation in the width of the most critical crack in the ribs forming the transverse joint.
Panel Fatigue Load Test (Test 5)
As with the joint test, the waffle deck panel UWP1 was subjected to one million cycles to test this panel for potential low amplitude fatigue damage. The load variation was again computer controlled in a sinusoidal manner between 2 kip and 21.3 kips at a frequency of 2 Hz. During the test, the deck panels and the joint were examined periodically for formation of any new cracks. During the test, the load, displacements and strain data from selected gauges were recorded continuously for 5 seconds at 20 Hz frequency at the end of every 1800 cycles (i.e., at every 15 min.). In addition, the fatigue test was paused and static load tests were conducted at the end of 135000, 670000 and 1 million cycles with a maximum load of 21.3 kips to determine the influence of any fatigue damage on the panel and system behavior.
Based on the recorded data, the displacements recorded at the center of the panel UWP1 at 21.3 kips and 2 kips are plotted as a function of the load cycle during in Figure 34. It is apparent that the gauges experienced drifts due to ambient variations and that the data was influenced by high frequency noise. However, when the displacement corresponding to the load increment of 19.3 kips (i.e., 21.3 kips – 2 kips) was examined, it is clear that this displacement remained nearly constant throughout the test. Based on these observations, it is concluded that the UHPC panel did not experience any fatigue damage.
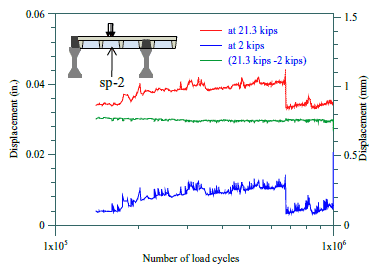
Figure 34: The peak displacement variation at the center of Panel UWP1 during the joint fatigue test.
Figure 35a shows the strains recorded by the gauge mounted to the transverse rib reinforcement located at the center of the rib TR2 of panel UWP1 as a function of the load cycle. Although the drifts in measured data are apparent, the change in strain remained almost constant at a value of 360με as the load increased from 2 to 21.3 kips. This variation is comparable to a strain of 375με recorded during the service load test of panel UWP2. Figure 35b shows the strains recorded by the gauge mounted to the joint transverse reinforcement located at the center of the joint as a function of the load cycle.
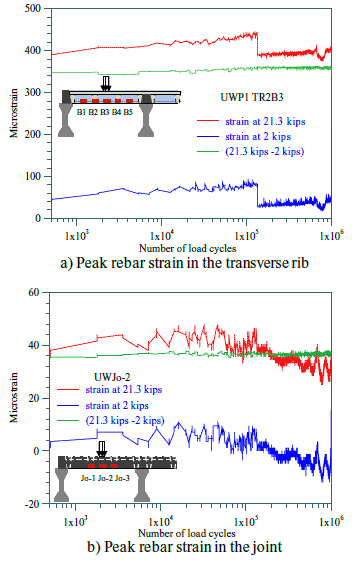
Figure 35: The peak strain variation in bottom deck reinforcement in the transverse rib of UWP1and the joint during panel fatigue test.
During the fatigue test, no additional cracking in the panel was observed besides those formed during the service load test. The crack width at the bottom of the transverse rib was nearly constant over the entire fatigue test and is shown in Figure 36. This data varied between 0.0018 in. and 0.0023 in. or within a range of 0.0005 inches, which is close to the sensitivity of the LVDTs used to measure the crack width. For the static load tests performed at the end of 135000, 670000 and 1 million cycles, the load-displacement, peak strain in the bottom reinforcement in the transverse joint, and the crack width in transverse rib TR2 of panel UWP1 during the intermediate static load tests are presented in Figure 37. The initial stiffness of the panel at the end of 135000, 670000 and 1 million cycles of loading was 667.71 kip/in., 637.72 kip/in., and 653.34 kip/in., respectively. These values compare closely with each other and show variations within 5%. From these observations and Figure 37, it is clear that the joint or the UHPC waffle deck system did not experience any significant fatigue damage even after subjected to one million cycles at an amplified level of the service load.q
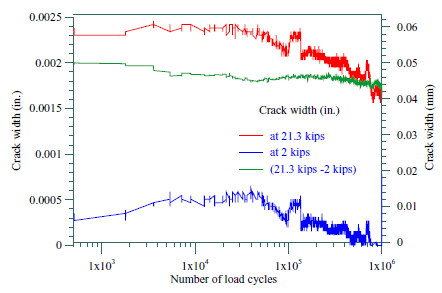
Figure 36: The crack width variation in transverse rib TR2 of panel UWP1 during panel fatigue test.
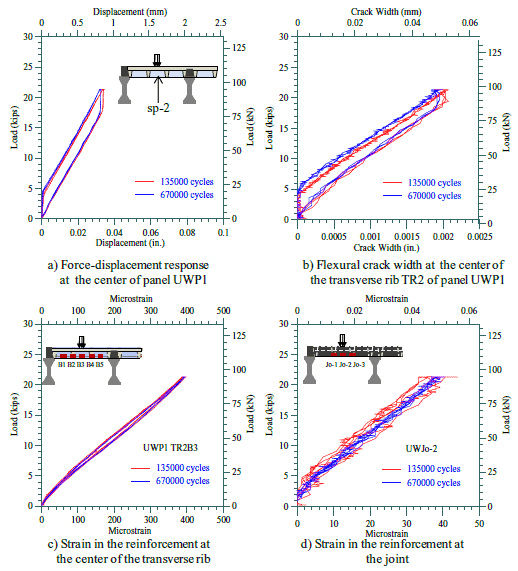
Figure 37: Measured responses of the waffle deck system for static service load tests conducted during the panel fatigue test.
Panel Ultimate Load Test (Test6)
The ultimate load test was carried out to investigate the adequacy of the waffle deck panel at the ultimate limit state. Similar to the joint ultimate load test, this limit state was defined as a factor of the service wheel load of 16 kips without causing any significant damage to the panel UWP1. A maximum load of 40 kips; equivalent to 2.5 times the service wheel load of 16 kips was applied at the center of panel UWP1.
Similar to the previous service load tests, three load cycles at this load level were conducted to ensure the stability of the force-displacement response of the system. The load-deflection curve established at the center of panel UWP1 for this test is shown in Figure 38a. The panel exhibited a linear force-displacement behavior response with insignificant damage. A maximum deflection of 0.08 in. was measured at the center of panel UWP1. This deflection corresponds to L/1100, which is 73% of the AASHTO specified serviceability limit of L/800 for continuous spans with pedestrian traffic.
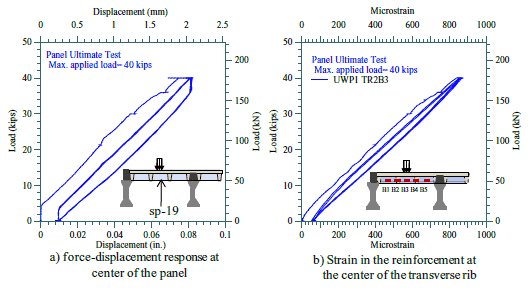
Figure 38: Measured force-displacement response and peak rebar strain at the center of the transverse rib of UWP1 at the ultimate load of 40 kips.
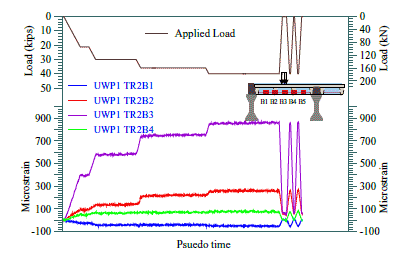
Figure 39: Measured strains in the bottom reinforcement of the transverse rib along the length of UWP1 at during the ultimate load test.
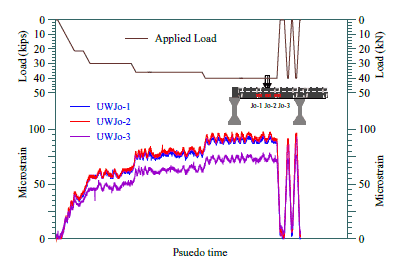
Figure 40: Measured strains in the bottom reinforcement of the joint along the joint length during the ultimate load test.
The variation of the most critical strain in the bottom reinforcement of the transverse rib TR2 of panel UWP1 as a function of the applied load is shown in Figure 38b. The peak strain in the bottom reinforcement of transverse rib TR2 was only 880 με, which is only about 43% of the yield strain of the reinforcement. The strain variations in the bottom reinforcement placed in the transverse rib TR2 of panel UWP1 and the joint are shown in Figure 39 and Figure 40, respectively. Three to four hairline cracks were observed on both transverse ribs (TR1, TR2 and TR3) and longitudinal ribs (LR1 and LR2) of panel UWP1 (see Figure 41). A hairline crack was seen on the bottom surface of UWP1 (between ribs TR2 and TR3) at the peak load (see Figure 41a). The maximum crack width measured along the transverse rib TR2 in UWP1 was 0.008 inches and its variation with the applied load is shown in Figure 42. Figure 43 shows the strain demand on the dowel bar in the panel-to-girder joint during the panel ultimate load test. It is clear that the dowel bars were engaged in load transfer when 35 kips load was applied at the center of the panel.
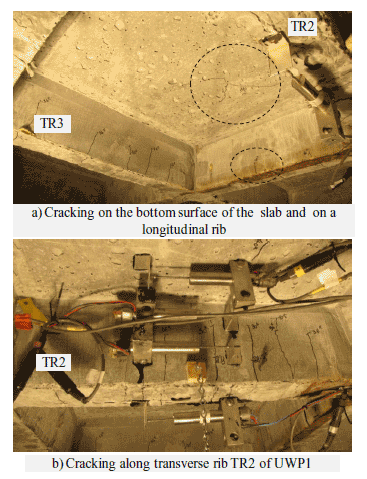
Figure 41: Hairline cracks developed on panel UWP1 at an ultimate load of 40 kips
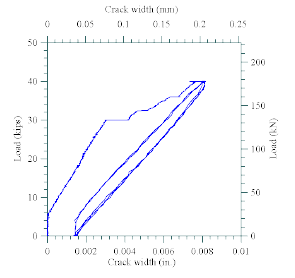
Figure 42: Measured crack width in transverse rib TR2 of UWP1 at during the ultimate load test.
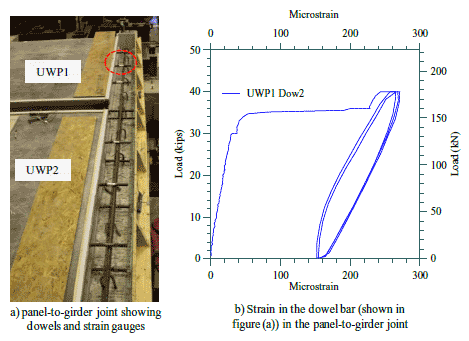
Figure 43: Strain variations in a dowel bar placed in the panel-to-girder joint during the panel ultimate load test.

