U.S. Department of Transportation
Federal Highway Administration
1200 New Jersey Avenue, SE
Washington, DC 20590
202-366-4000
Federal Highway Administration Research and Technology
Coordinating, Developing, and Delivering Highway Transportation Innovations
| PRESENTATION |
| This presentation is an archived publication and may contain dated technical, contact, and link information |
|
| Publication Number: N/A Date: January 2014 |
Publication Date: January 2014
|
PDF files can be viewed with the Acrobat® Reader®
|
Robert Zobel, Ph.D., P.E |
Sue Lane, P.E. |
|
Hamid Ghasemi, Ph.D |
Tom Saad, P.E. |
Based on input from stakeholders and considering current resources of the program, the following key topics are addressed:
| CATEGORY | ISSUE |
Decks |
Untreated Concrete Bridge Decks |
Decks |
Treated Concrete Bridge Decks |
Joints & Bearings |
Bridge Deck Joints |
Steel Bridges |
Coatings for Steel Superstructure Elements |
Concrete Bridges |
Embedded or Ducted Strands or Tendons |
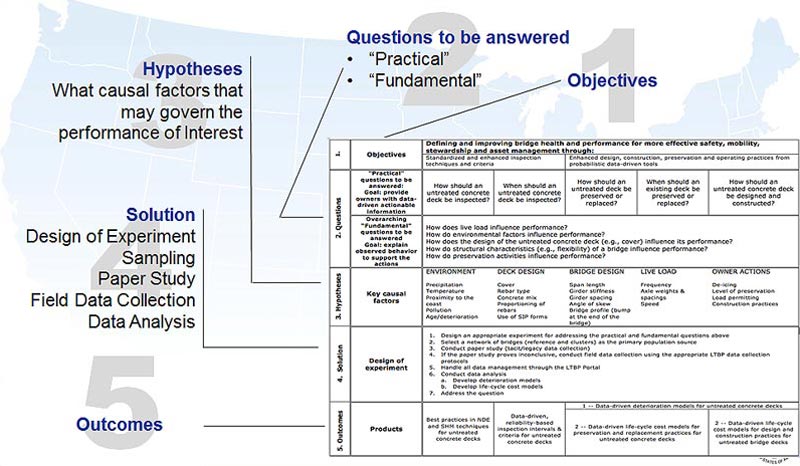
It is high level generic framework or roadmap outlining the LTBP research process that can be applied to ANY identified high priority performance topic.
It is NOT intended to provide detail on what data to collect nor how to analyze or interpret it. This information is found in a corresponding Operational Matrix which is currently under development (but we’ll take a sneak peak at it!)
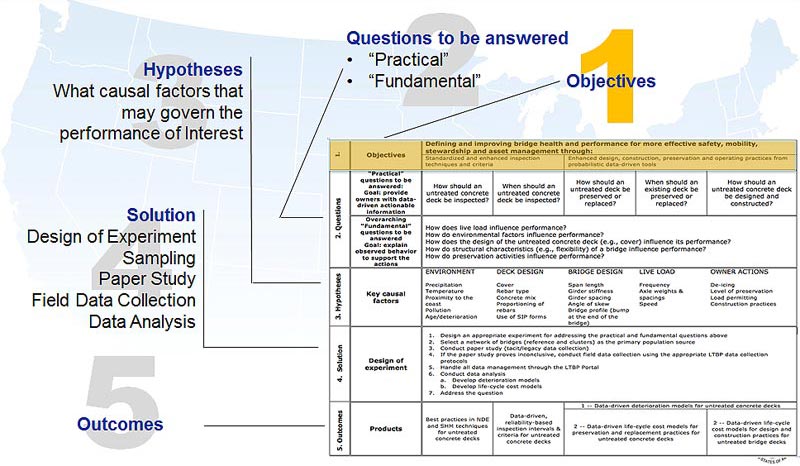
| 1. | Objectives | Defining and improving bridge health and performance for more effective safety, mobility, stewardship and asset management through: | ||||||||||||||
| Standardized and enhanced Inspection techniques and criteria | Enhanced design, construction, preservation and operating practices from probabilistic data-driven tools | |||||||||||||||
| 2. Questions |
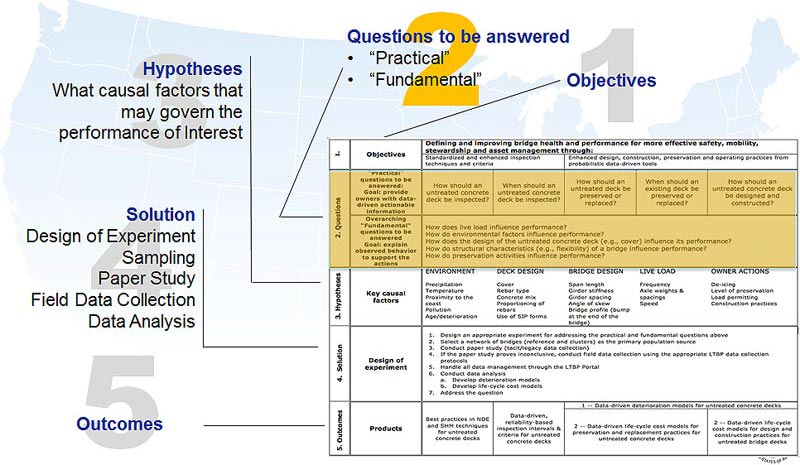
"Practical" questions to be answered: Goal: provide owners with data- driven actionable information |
How should an untreated concrete deck be inspected? |
When should an untreated concrete deck be inspected? |
How should an untreated deck be preserved or replaced? |
When should an existing deck be preserved or replaced? |
How should an untreated concrete deck be designed and constructed? |
||||||||||
| Overarching "Fundamental" questions to be answered Goal: explain observed behavior to support the actions |
How does live load influence performance? How do environmental factors influence performance? How does the design of the untreated concrete deck (e.g., cover) influence its performance? How do structural characteristics (e.g., flexibility) of a bridge influence performance? How do preservation activities influence performance? |
|||||||||||||||
| 3. Hypotheses |
Key causal factors |
|
||||||||||||||
| 4. solution | Design of experiment |
|
||||||||||||||
| 5. Outcomes |
Products | Best practices in NDE and SHM techniques for untreated concrete decks |
Data-driven, reliability-based inspection intervals & criteria for untreated concrete decks |
1 -- Data-driven deterioration models for untreated concrete decks | ||||||||||||
| 2 -- Data-driven life-cycle cost models for preservation and replacement practices for untreated concrete decks |
2 -- Data-driven life-cycle cost models for design and construction practices for untreated bridge decks |
|||||||||||||||
| 1. | Objectives | Defining and improving bridge health and performance for more effective safety, mobility, stewardship and asset management through: | ||||||||||||||||
| Standardized and enhanced inspection techniques and criteria | Enhanced design, construction, preservation and operating practices from probabilistic data-driven tools | |||||||||||||||||
| 2. Questions |
"Practical" questions to be answered: Goal: provide owners with data- driven actionable information |
How should a |
When should a |
How should |
When |
How should |
When should |
Should a deck treatment be applied to a new deck? |
||||||||||
| Overarching "Fundamental" questions to be answered Goal: explain observed behavior to support the actions |
Now does live load influence performance? Now does environment influence performance? How does the design & construction of the treatment influence performance? How do structural characteristics of the bridge (such as flexibility) influence performance? How do preservation activities influence performance? |
|||||||||||||||||
| 3. Hypotheses |
Key causal factors |
|
||||||||||||||||
| 4. solution | Design of experiment |
|
||||||||||||||||
| 5. Outcomes |
Products | Best practices in NDE and SHM techniques for treated decks |
Data-driven, reliability-based inspection intervals & criteria for treated decks |
1 -- Data-driven deterioration models for treated concrete decks |
||||||||||||||
| 2 -- Data-driven life-cycle cost models for preservation and replacement practices for treated decks |
2 -- Data-driven life-cycle cost models for design and construction practices for new bridges |
|||||||||||||||||
| 1. | Objectives | Defining and improving bridge health and performance for more effective safety, mobility, stewardship and asset management through: | ||||||||||||||
| standardized and enhanced inspection techniques and criteria | enhanced design, construction, preservation and operating practices from probabilistic data-driven tools | |||||||||||||||
| 2. Questions |
"Practical" questions to be answered: Goal: provide owners with data- driven actionable information |
How should joints and bearings be inspected |
When should joints and bearings be inspected? |
How should joints & bearings be preserved or replaced? |
When should joints and bearings be preserved or replaced? |
How should joints and bearings be selected? |
||||||||||
| Overarching "Fundamental" questions to be answered Goal: explain observed behavior to support the actions |
How does live load influence performance? How does environment influence performance? How does the selection & installation of the joint or bearing influence performance? How do structural characteristics of the bridge (such as skew) influence performance? How do preservation activities influence performance? |
|||||||||||||||
| 3. Hypotheses |
Key causal factors |
|
||||||||||||||
| 4. solution | Design of experiment |
|
||||||||||||||
| 5. Outcomes |
Products | Best practices in NDE and SHM techniques for joints and bearings | Data-driven, reliability-based inspection intervals & criteria for joints and bearings | 1 -- Data-driven deterioration models for joints and bearings | ||||||||||||
| 2 -- Data-driven life-cycle cost models for preservation and replacement practices for joints and bearings | 2 -- Data-driven life-cycle cost models for selection and Installation of joints and bearings | |||||||||||||||
| 1. | Objectives | Defining and Improving bridge health and performance for more effective safety, mobility, stewardship and asset management through: | ||||||||||
| standardized and enhanced inspection techniques and criteria | enhanced design, construction, preservation and operating practices from probabilistic data-driven tools | |||||||||||
| 2. Questions |
"Practical" questions to be answered: Goal: provide owners with data- driven actionable information | How should coatings for steel components be inspected | When should coatings for steel components be inspected? | How should coatings for steel components be preserved or replaced? | When should coatings for steel components be preserved or replaced? | How should new steel components be coated? | ||||||
| Overarching "Fundamental" questions to be answered Goal: explain observed behavior to support the actions | How does environment influence performance? How does the selection & application of the coating influence performance? How do preservation activities influence performance? |
|||||||||||
| 3. Hypotheses |
Key causal factors |
|
||||||||||
| 4. solution | Design of experiment |
|
||||||||||
| 5. Outcomes |
Products | Best practices In NDE and SHM techniques for coatings for steel components | Data-driven, reliability-based inspection intervals & criteria for coatings for steel components | 1 -- Data-driven deterioration models for coatings for steel components | ||||||||
| 2 -- Data-driven life-cycle cost models for preservation and replacement practices for coatings for steel components | 2 -- Data-driven life-cycle cost models for selection and application of coatings for steel component practices on new bridges | |||||||||||
| 1. | Objectives | Defining and Improving bridge health and performance for more effective safety, mobility, stewardship and asset management through: | ||||||||||
| standardized and enhanced inspection techniques and criteria | enhanced design, construction, preservation and operating practices from probabilistic data-driven tools | |||||||||||
| 2. Questions |
"Practical" questions to be answered: Goal: provide owners with data- driven actionable information | How should embedded or ducted strands or tendons be inspected | When should embedded or ducted strands or tendons be inspected? | How should embedded or ducted strands or tendons be preserved or replaced? | When should embedded or ducted strands or tendons be preserved or replaced? | How should a new embedded or ducted strands or tendons be designed and constructed? | ||||||
| Overarching "Fundamental" questions to be answered Goal: explain observed behavior to support the actions | How does environment influence performance? How does the design & construction of the strands or tendons influence performance? How do preservation activities influence performance? |
|||||||||||
| 3. Hypotheses |
Key causal factors |
|
||||||||||
| 4. solution | Design of experiment |
|
||||||||||
| 5. Outcomes |
Products | Best practices in NDE and SHM techniques for embedded or ducted strands or tendons | Data-driven, reliability-based inspection intervals & criteria for embedded or ducted strands or tendons | 1 -- Data-driven deterioration models for embedded or ducted strands or tendons | ||||||||
| 2 -- Data-driven life-cycle cost models for preservation and replacement practices for embedded or ducted strands or tendons | 2 -- Data-driven life-cycle cost models for design and construction practices for pre- tensioned or post-tensioned bridges | |||||||||||
Research Approach & Methodology: Description of Untreated Bridge Deck Matrix
Research Approach & Methodology: Description of Untreated Bridge Deck Matrix
Research Approach & Methodology: Description of Untreated Bridge Deck Matrix
|
|
Research Approach & Methodology: Description of Untreated Bridge Deck Matrix
Research Approach & Methodology: Description of Untreated Bridge Deck Matrix
Practical (Providing Actionable Information)
Fundamental (Underpin Forecasting and Asset Management)
Research Approach & Methodology: Description of Untreated Bridge Deck Matrix
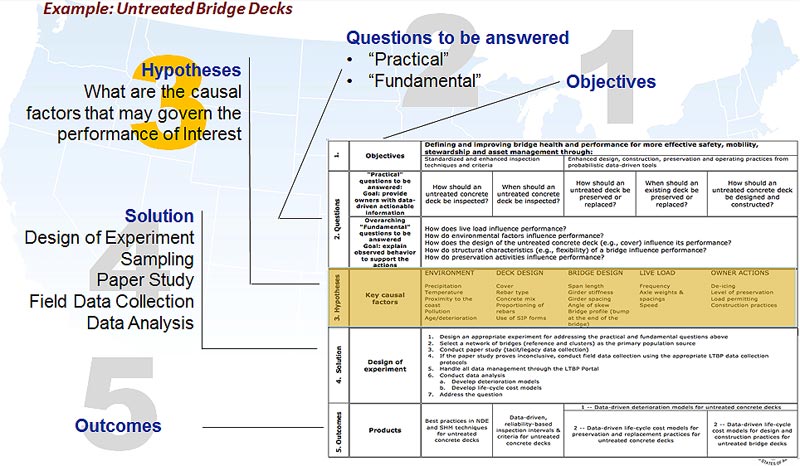
Research Approach & Methodology: Description of Untreated Bridge Deck Matrix
The observed deterioration of bridge decks is caused by the individual and combined influences of…
Research Approach & Methodology: Description of Untreated Bridge Deck Matrix
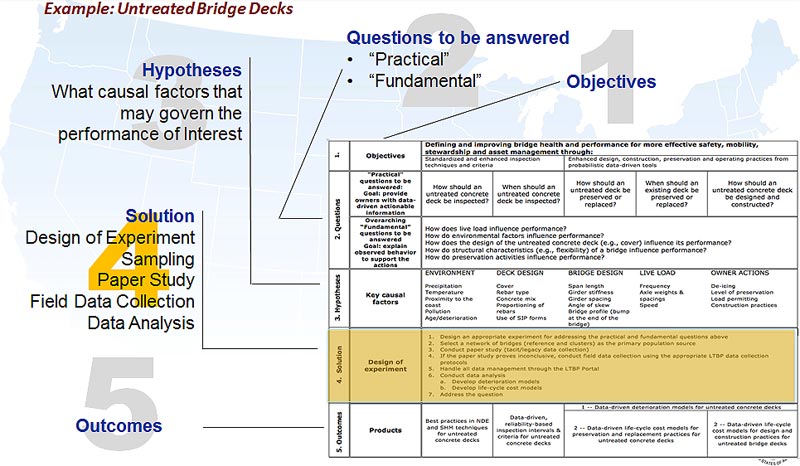
Research Approach & Methodology: Description of Untreated Bridge Deck Matrix
Specific details provided within an “Operational Matrix” |
Research Approach & Methodology: Description of Untreated Bridge Deck Matrix
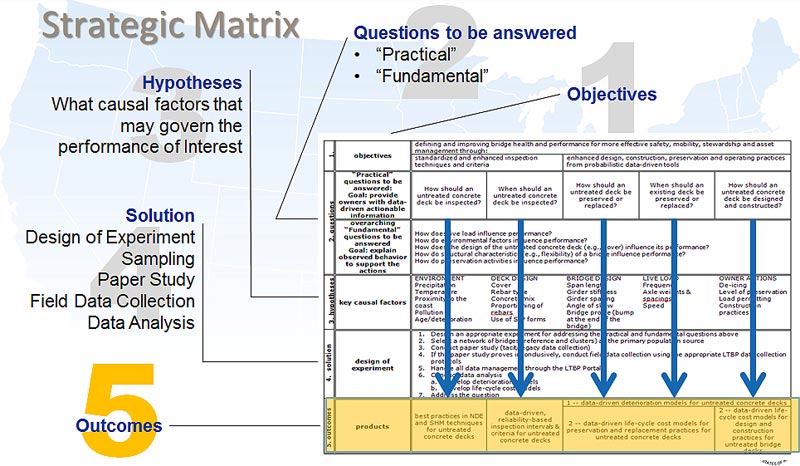
Research Approach & Methodology: Description of Untreated Bridge Deck Matrix
| Question: | How should an untreated concrete deck be inspected? | |
| Outcome: | Best practices in NDE and SHM techniques for untreated concrete decks | |
| Question: | When should an untreated concrete deck be inspected? | |
| Outcome: | Data-driven, reliability-based inspection intervals & criteria for untreated concrete decks | |
| Question: | How should an untreated deck be preserved or replaced? | |
| When should an existing deck be preserved or replaced? | ||
| How should an untreated concrete deck be designed and constructed? | ||
| Outcome: | Data-driven deterioration models for untreated concrete decks | |
| a) data-driven life-cycle cost models for preservation and replacement practices for untreated concrete decks | ||
| b) data-driven life-cycle cost models for design and construction practices for untreated bridge decks | ||
(There is a layer of Matrix for Each High Priority Performance Issue)
Data Collection
Data Analysis
An example of what this looks like in concept …..