U.S. Department of Transportation
Federal Highway Administration
1200 New Jersey Avenue, SE
Washington, DC 20590
202-366-4000


Skip to content
Facebook iconYouTube iconTwitter iconFlickr iconLinkedInInstagram

Federal Highway Administration Research and Technology
Coordinating, Developing, and Delivering Highway Transportation Innovations

 
PRESENTATION
This presentation is an archived publication and may contain dated technical, contact, and link information
Back to Publication List        
Publication Number:  N/A    Date:  January 2014
Publication Date: January 2014


ND Condition Assessment of George Washington Memorial Parkway/Arlington Memorial Bridge

PDF Version (5.90 MB)

PDF files can be viewed with the Acrobat® Reader®

TRB 93rd Annual Meeting
LTBP Program Workshop – Program Briefing
Washington, DC – Thursday January 16, 2014

Robert Zobel, Ph.D., P.E.
Technical and Development Engineer
Federal Highway Administration

Sue Lane, P.E.
Outreach and Development Engineer
Federal Highway Administration

Hamid Ghasemi, Ph.D.
Team Leader/Program Manager
Federal Highway Administration

Tom Saad, P.E.
Structural/Bridge Engineer
Federal Highway Administration


Objectives of AMB Assessment by LTBP

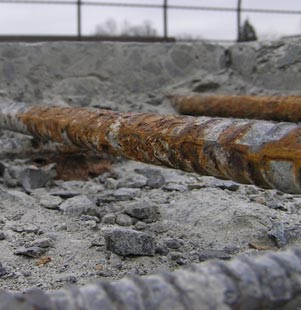
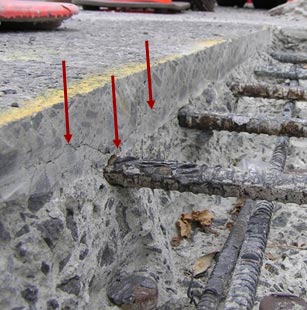
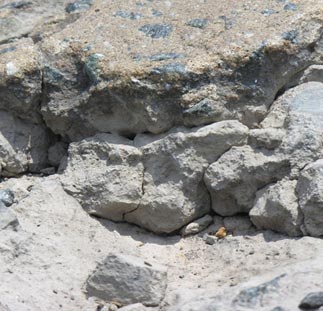
Corrosion Delamination Concrete Degradation
The first image, located in the lower-left corner of the slide, shows corrosion on two reinforcing bars of a concrete deck. The bars are exposed and there is a small pile of concrete rubble under the reinforcing bars. The second image, located to the right of the previous image, shows delamination of the concrete deck. Three red arrows point down to areas of delamination. Five exposed rebars are also seen in the image. The third image, located to the right of the second image, shows concrete degradation. Pieces of broken concrete appear in the image.

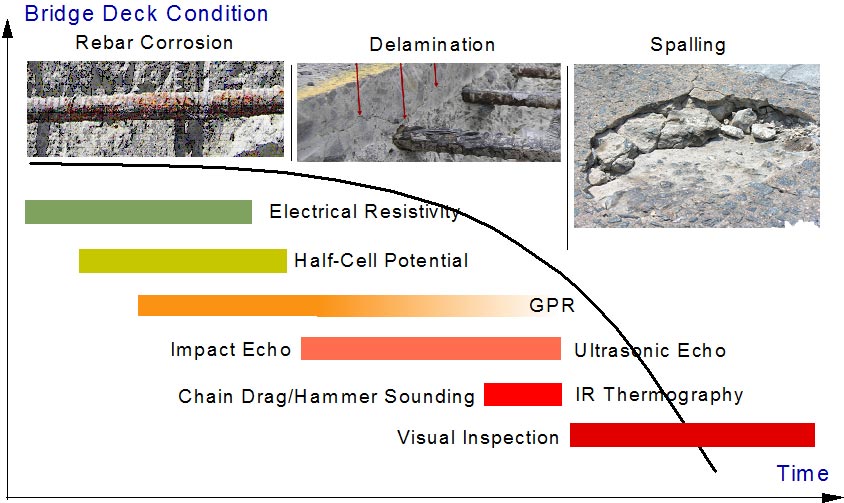
Deck Condition Assessment Vs. NDE Method

Three photographs appear at the top of the map of the United States. The first picture, on the left of the slide, shows an exposed reinforced bar that is corroded. The second image, located to the right of the previous image, shows delamination of the concrete deck. Three red arrows point down to areas of delamination. Three exposed rebars are also seen in the image. The third image, located to the right of the second image, shows spalling of the concrete. Cracks in the concrete appear in the image, as well as small pieces of broken concrete. A vertical line appears between the first and second image and between the second and third image. Below these three images is a graph, with Bridge Deck Condition plotted on the y-axis and Time plotted on the x-axis. A deterioration curve is plotted on this graph, with the condition beginning high at the y-axis and following a parabolic shape downward to the x-axis. Inside the graph are six rectangular boxes. The first box is green and is labeled Electrical Resistivity. This box depicts the stage of deterioration when the Electrical Resistivity test will provide results, which is during the initial stages of rebar corrosion.  Electrical Resistivity test does not detect corrosion per se, but indicates whether or not the concrete is an environment that is conducive to corrosion. The second box is below the first box and shifted slightly to the right. It is light green and is labeled Half-Cell Potential. The Half-Cell potential test provides results during the initial stages of rebar corrosion; it does not detect corrosion but indicates whether or not the concrete is an environment that is conducive to corrosion. The third box is colored orange, is labeled GPR on the right side of the box, and is below the second box. It stretches from partway through the rebar corrosion phase all the way to end of the delamination phase. GPR is an abbreviation for Ground Penetrating Radar. The fourth box is pink, is below the third box, and is labeled Impact Echo on the left side of the box and Ultrasonic Echo on the right side of the box. The box stretches across the delamination phase. The fifth box is red, is below the fourth box, and is labeled Chain Drag/Hammer Sounding on the left side of the box and IR Thermography on the right side of the box. The box covers only the end of the delamination phase. The sixth box is deep red and is below the fifth box; it is labeled Visual Inspection at the left side of the box. This box stretches across the full spalling phase, which is at the end of the deterioration curve.


The cross-sectional view shows a top mat and a bottom mat of reinforcing steel, as well as the concrete cover above the reinforcing bar and a 2.5-inch asphalt wearing surface on top of the concrete deck.


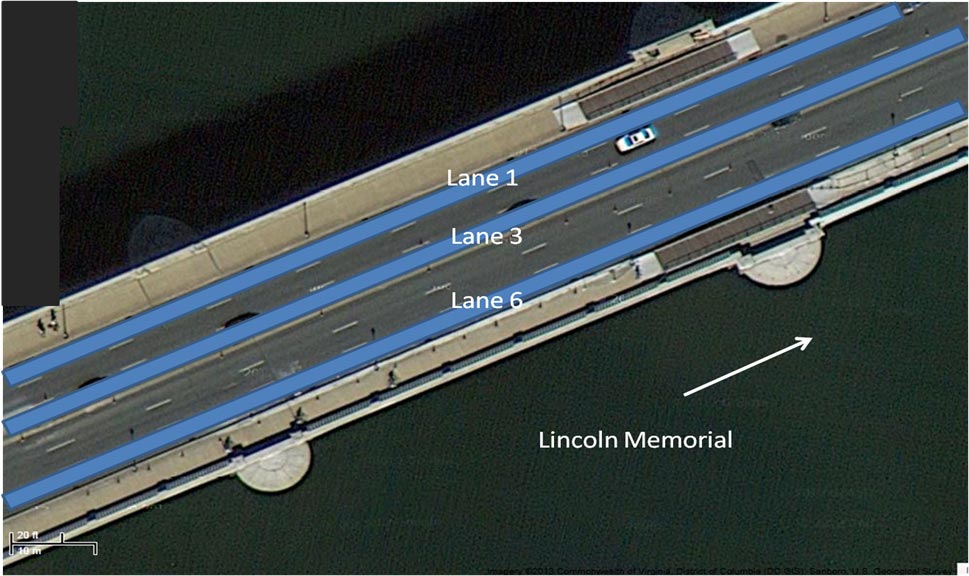
There are three lanes in each direction, and there are sidewalks visible on each side of the roadway. There are light posts on the sidewalk and vehicles on the road. Lanes 1, 3, and 6 are highlighted in blue. There is an arrow in the lower-right portion of the slide pointing diagonally to the upper right, which is in the direction of the Lincoln Memorial, which is not visible in the slide. In the lower left of the image, a scale is provided for the viewer to see how much distance is covered for 20 feet and 10 meters.


Delamination Assessment Using Impact echo (IE)

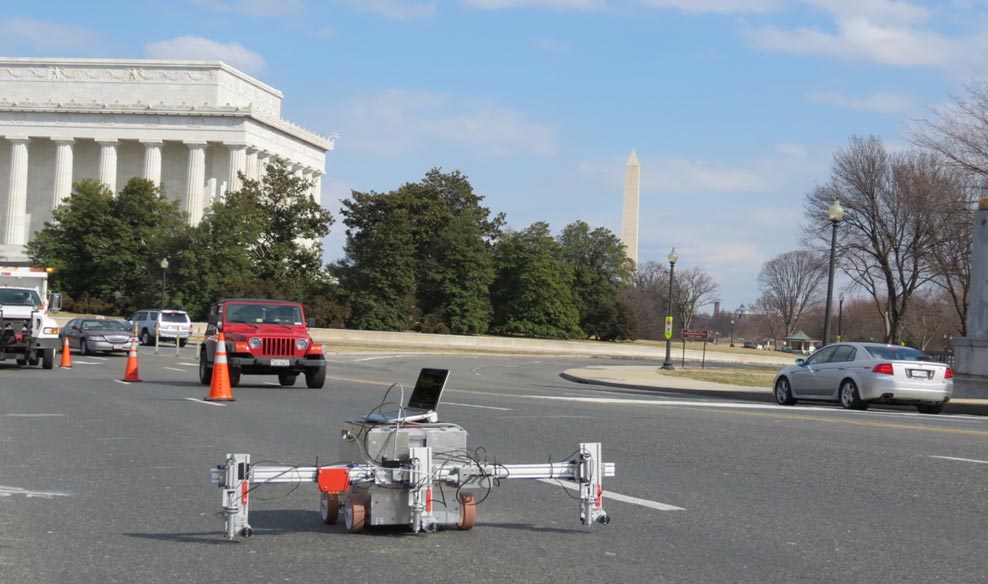
The tool is comprised of a silver box on four small wheels. It has a horizontal supporting bar on the front of it and that horizontal bar supports one vertical arm on each side. The vertical arm on each side contains the impact echo impulse and measuring devices. The tool is located on the bridge deck of the Arlington Memorial Bridge at the end of the bridge near the Lincoln Memorial. The bridge deck contains an asphalt overlay (wearing surface). Behind the bridge deck and to the left of the IE tool are vehicles, traffic cones, and the Lincoln Memorial. Behind the bridge deck and to the right of the IE tool is a parked vehicle with the Washington Monument in the distance behind the some trees.


Principle of Impact Echo and Resulting Condition Grades

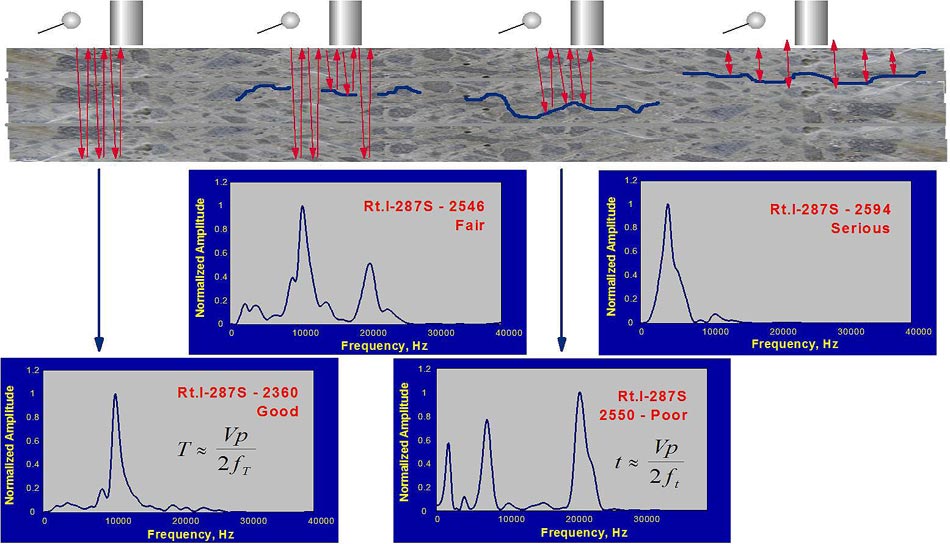
. The title of the slide is “Principle of Impact Echo and Resulting Condition Grades.” The top image is a concrete bridge deck with a pair of an impulse device and a recording device placed at four different points on the bridge deck. The bridge deck condition differs at each one of the four pairs of devices. Below the image of the bridge deck are four graphs, each related to one of the pair of devices. Each graph plots Normalized Amplitude on the y-axis and Frequency on the x-axis. 
The first pair of impulse and recording devices is placed at the left end of the bridge deck where the concrete has no cracks. A series of six red arrows traverses up and down across the full thickness of the bridge deck. This image is linked by a blue arrow line to the rightmost graph, which depicts a reading with only one high vertical peak in the graph. This denotes that the concrete is solid
The second pair of impulse and recording devices is placed to the right of the first pair, and the concrete has three short horizontal cracks in the center of the bridge deck. Four long red arrows go up and down in the concrete between the cracks. Then four short arrows go up and down between the crack and the upper surface of the concrete deck. This is followed by two red arrows that go up and down for the full depth of the concrete deck between the cracks. This image is linked to the second graph, above and to the right of the first graph. This second graph depicts a wave with two peaks, and lower readings between the two peaks. This denotes that the concrete has two areas where it is solid, but in between the two peaks there is a crack.
The third pair of impulse and recording devices is placed to the right of the second pair, and the concrete has one long horizontal crack in the center of the bridge deck. Six short arrows go up and down between the crack and the upper surface of the concrete deck. This image is linked by a blue arrow line to the third graph, below and to the right of the second graph. This third graph depicts a wave with three peaks, and lower readings between the three peaks. This denotes that the concrete has a long crack of varying depth.
The fourth pair of impulse and recording devices is placed to the right of the third pair, and the concrete has one long horizontal crack near the upper surface of the concrete bridge deck. Six short arrows go up and down between the crack and the upper surface of the concrete deck. This image is linked to the fourth graph, above and to the right of the third graph. This fourth graph depicts a wave with one peak in the area of concrete before the crack, and a series of very small readings after the peak. This denotes that the concrete has a long crack near the upper surface of the concrete deck.


Typical Delamination Assessment and Impact Echo Validation with Cores

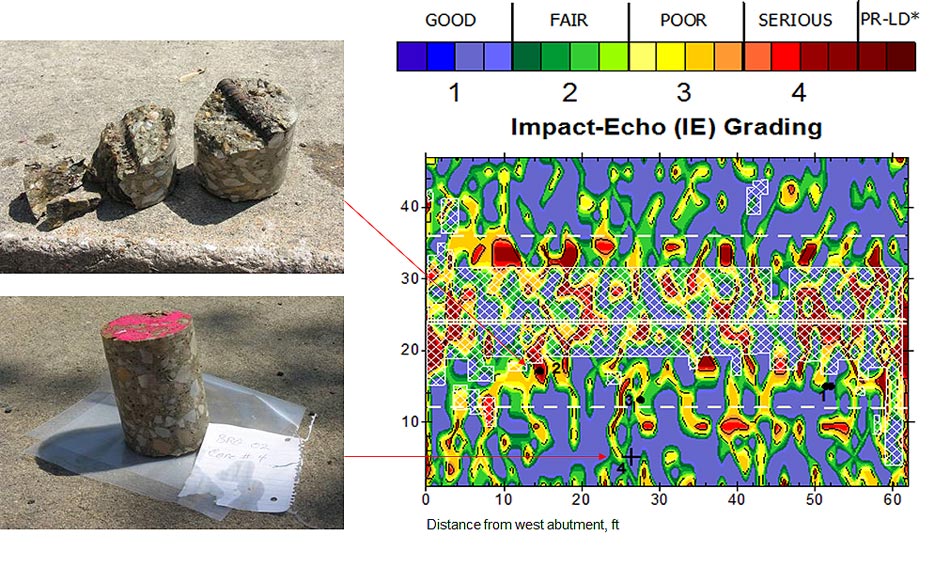
The image shows two concrete cores that are broken with horizontal cracks known as delaminations. Another image is directly below the first image, and depicts a solid concrete core with pink markings on the top and a piece of notebook paper below the core with the core’s designation written on the paper. The image on the right side of the slide is a contour map that is color –coded to show the condition of the concrete. It also contains a key above the contour map, which denotes that blues are good condition, greens are fair condition, yellows are poor condition, reds are serious condition, and deep red and brown are labeled as PR-LD*. The top left image has a red arrow running from it to a spot on the contour map that is red in color. The bottom left image has a red arrow running from it to a spot on the contour map that is blue in color.


Deck Condition Assessment Using Ground Penetrating Radar (GPR)

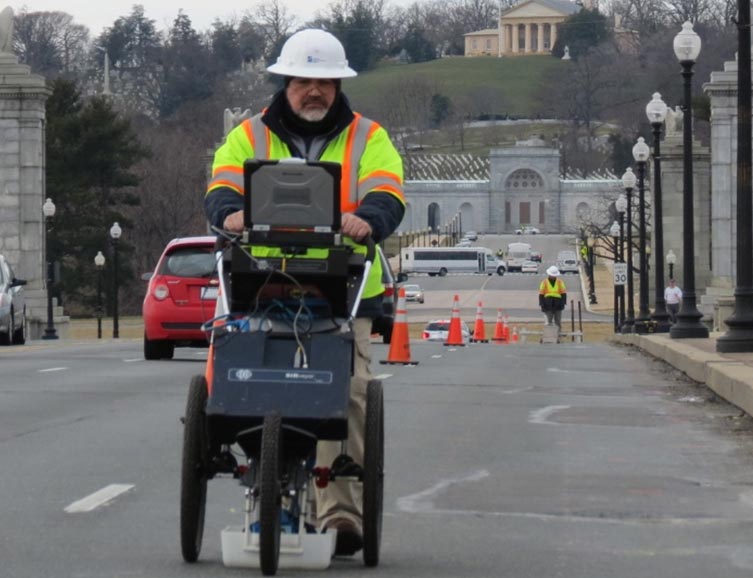
An image of a worker using ground penetrating radar (GPR) on the Arlington Memorial Bridge. Vehicles are seen on the bridge but the lane in which the worker is using the GPR equipment is closed and orange traffic cones separate the open lanes from the closed lane. In the background, portions of Arlington National Cemetery are seen.


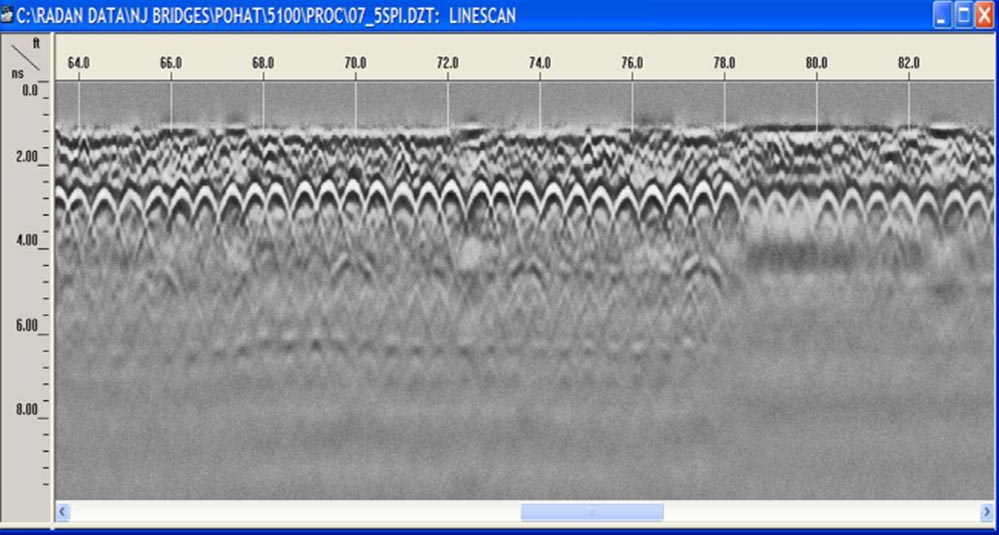
Typical GPR B-Scan of Bridge Deck

A ground penetrating radar (GPR) B-Scan of a bridge deck. For the first three-quarters of the scan the data has continuous well-defined peaks. However, for the last one quarter of the scan the peaks become less defined, almost fuzzy in their appearance. This indicates that the concrete has some deterioration in the last one quarter of the scan.


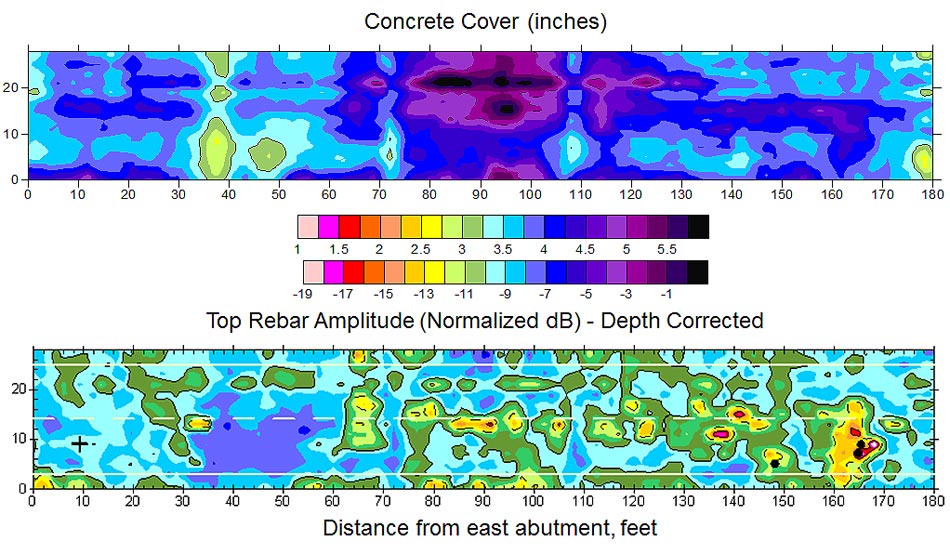
Typical Concrete Cover and Condition Maps from GPR Survey

Concrete cover and condition maps from a ground penetrating radar (GPR) survey. The top image is a concrete cover contour map that was obtained using GPR. The contour map indicates mainly blue areas with some smaller purple, green, and yellow areas. The key is color coded and is provided below the map. Purple indicates 5 inches of cover, blue indicates 3.5 to 4.5 inches of cover, green indicates 3 inches of cover, while yellow indicates 2.5 inches of cover. The bottom image provides the top rebar amplitude that is depth-corrected. The contour map shows a lot of blue and green areas, some yellow areas, and a few very small orange areas. A color-coded key is provided. Blue indicates -5 to -9, green indicates -11 to -12, yellow indicates -13, and orange indicates -14 to -16.


Concrete Quality Assessment Using Ultrasonic Surface Waves (USW)

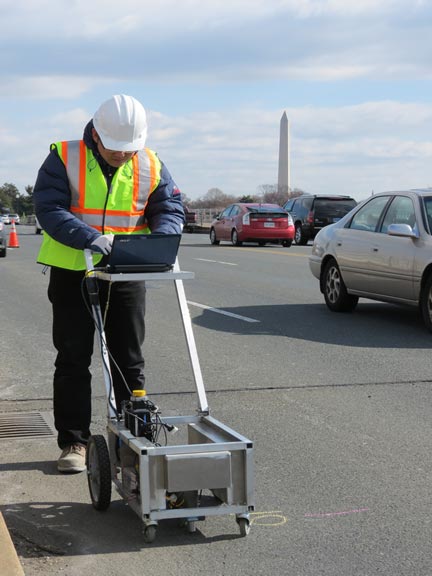
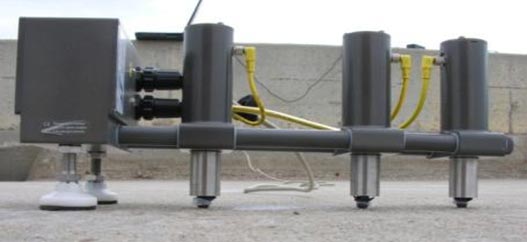
The first photograph shows a worker wearing a safety vest and hard hat and using a tool to measure concrete quality using ultrasonic surface waves. The tool is contained in a push cart with wheels. The ultrasonic surface wave equipment is contained in a box at the bottom of the cart, while a computer is recording the data. The image includes a worker using the tool and the computer on a closed lane of the Arlington Memorial Bridge. Vehicles are seen on the roadway and the Washington Monument can be seen in the background. The second image shows the ultrasonic surface wave equipment with three probes touching the concrete surface.
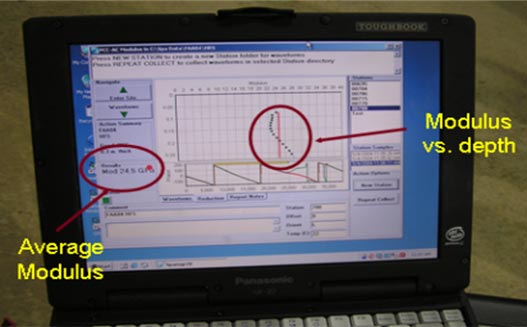
The third image shows a laptop computer screen with graphs and charts. A portion of the graph is highlighted with a red circle. An arrow points to that circle with the words Modulus vs. depth printed next to it. Another portion of the graph is highlighted with another red circle. An arrow points to that circle with the words Average Modulus printed next to it.

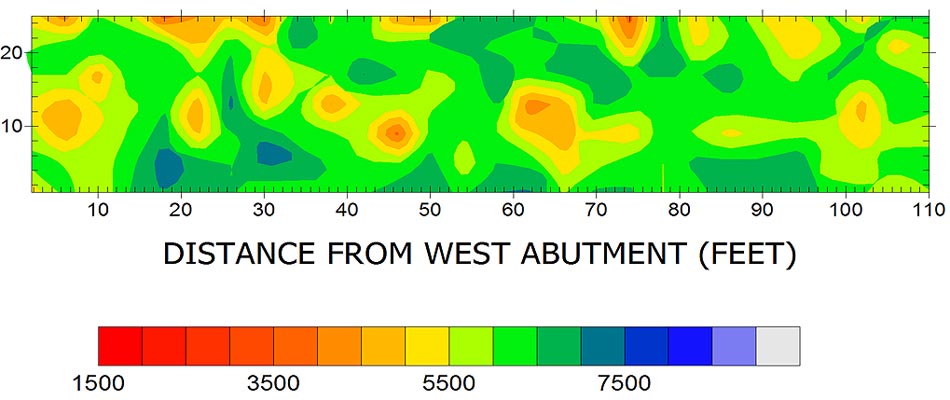
Typical Concrete Quality Assessment Using Concrete Modulus from USW Test

A contour map of concrete modules, also known as Young’s modulus of elasticity. It is a measure of the stiffness of the concrete, which is one measure of the condition of the concrete. The contour plot was obtained from the data from the ultrasonic surface wave test. The contour plot shows a mixture of green, blue, yellow and orange areas. A color-coded key to the contour map is provided under the map. Red indicates 1500 kips per square in (ksi), orange is 3500 ksi, yellow is 5000 ksi, green is 6500 ksi, and blue is 8000 kis.


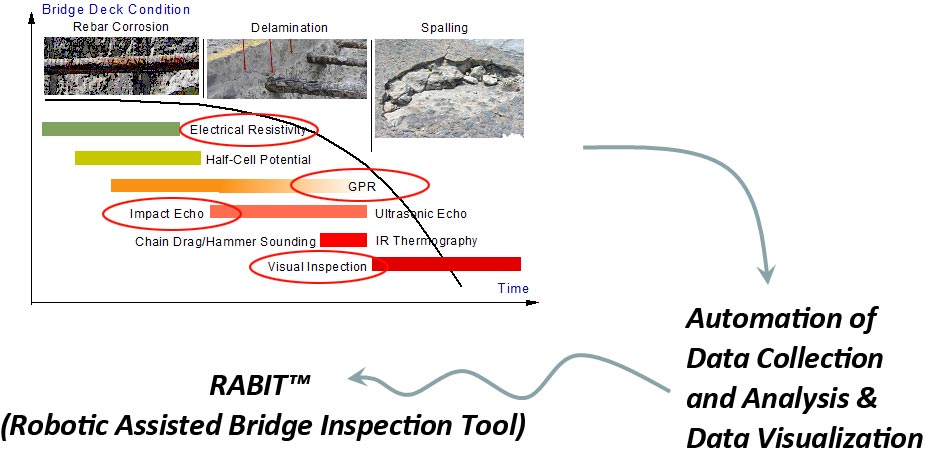
The image is the graph from slide 3 with circles around four of the methods listed in that graph. The methods circled in red are electrical resistivity, impact echo, GPR, and visual inspection. Three of these four methods are included in the robot, the automated data collection tool called the RABIT™ Bridge Deck Assessment Tool. At the bottom left corner of the slide, the Long-Term Bridge Performance logo appears.


Multi-NDE Technology Assessment Using RABIT™ -- Individual Components Shown Below

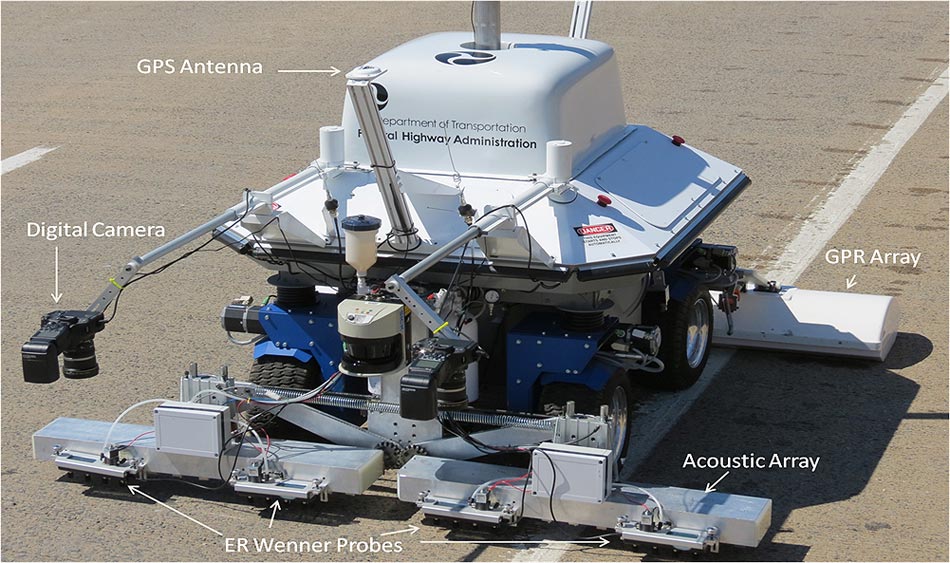
Image of the RABIT™ Bridge Deck Assessment Tool. The RABIT™ Bridge Deck Assessment Tool features two high resolution digital cameras on mechanical arms extending from the center of the tool to in front of the tool. Electrical Resistivity Probes are included at the bottom of the tool and Impact Echo and Ultrasonic Surface Waves equipment are included, also at the bottom of the tool, to evaluate concrete delamination and concrete deck stiffness. Ground Penetrating Radar (GPR) is located at the back of the tool to “map” rebar and give an indication of concrete deterioration below the surface. Two Global Positioning System (GPS) devices are located on the top of the tool, near the front and rear, l to record and mark both the location and the orientation of the robot. At the bottom left corner of the slide, the Long-Term Bridge Performance logo appears.


Multi-NDE Technology Assessment Using the RABIT™

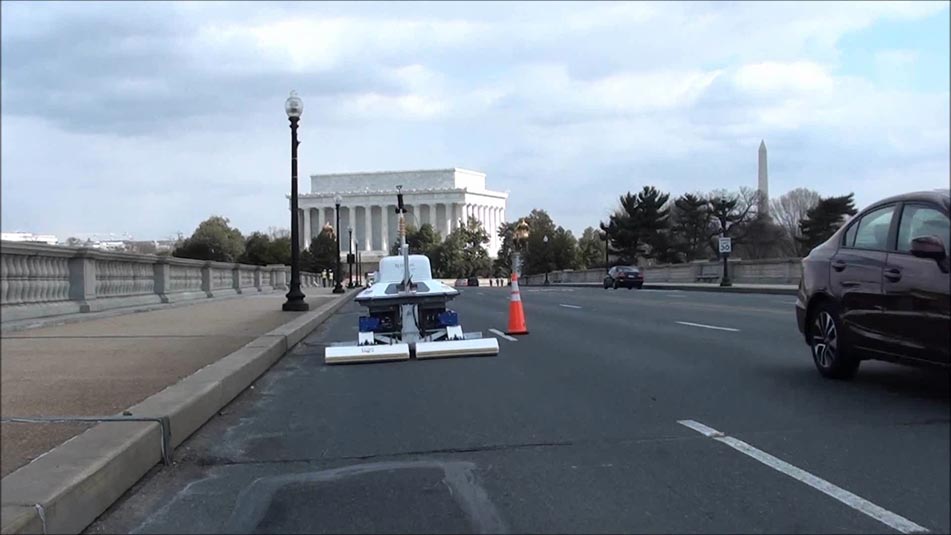
Image of the RABIT™ Bridge Deck Assessment Tool on the deck of the Arlington Memorial Bridge. Sidewalks, street lights, and trees can be seen in the image. Directly behind the bridge and in the distance, the Lincoln Memorial can be seen. To the right of the Lincoln Memorial is the Washington Monument. Vehicles are on the bridge and are separated from the lane containing the RABIT™ Bridge Deck Assessment Tool by a traffic cone.


Delamination Assessment – Lane 1 (Lincoln Memorial Side)

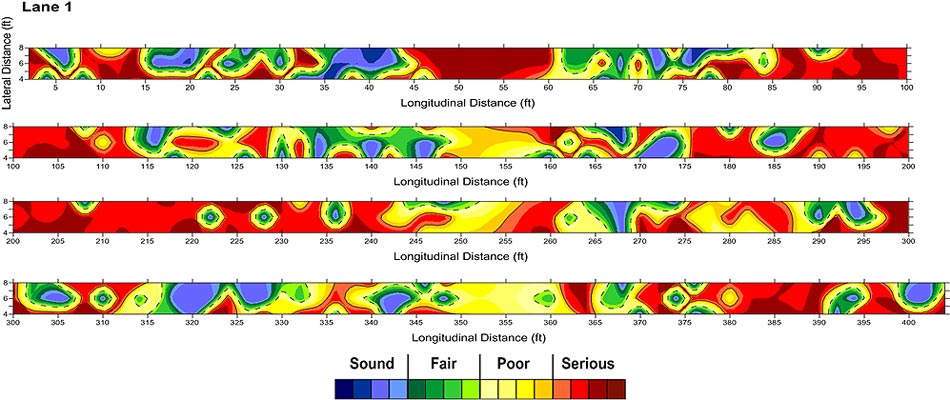
Image of a delamination assessment. There are four contour plots displaying colors chosen to match the extent of the delaminations in the deck from the results of the hand-held and automated NDE assessments. The results are all for Lane 1 of the Arlington Memorial Bridge. The first image shows the contour plot of the first 100 feet of the bridge deck. The second plot, below the first one, shows the next 100 feet of the bridge deck. The third image, below the second one, shows the next 100 feet of the bridge deck. The fourth image, below the third image, shows the next 100 feet of the bridge deck. There is a color-coded key below the fourth image. The colors in the four contour plots have many areas of yellow and red, with smaller areas of blue and green. The blue represents sound concrete, the green stands for fair concrete, the yellow represents poor concrete, and the red represents concrete in serious condition.


Delamination Assessment

Because of the asphalt overlay, some detection is a result of asphalt debonding, or disintegration of near surface concrete.

Grading


Good


- No delamination/debonding detected


Fair/Poor


- Incipient delamination


Serious


- Fully delaminated or debonded


  Lane 1 Lane 3 Lane 6
Arlington Lincoln Arlington Lincoln Arlington Lincoln
Impact
Echo
Good 9% 18% 15% 19% 21% 19%
Fair/Poor 19% 23.50% 23.50% 29% 52% 47%
Serious 72% 58.50% 61.50% 52% 27% 34%


Concrete Quality Assessment

Composite modulus

Grading


Good


-   > 3000 ksi


Fair/Poor


-  2000-3000 ksi


Serious


-  2000-3000 ksi


  Lane 1 Lane 3 Lane 6
Arlington Lincoln Arlington Lincoln Arlington Lincoln
USW Good 35% 7% 4%
Fair/Poor 34% 59% 17%
Serious 31% 34% 79%


GPR Condition Assessment

Qualitative assessment based on the attenuation of electromagnetic waves on the top rebar level.

  Lane 1 Lane 3 Lane 6
Arlington Lincoln Arlington Lincoln Arlington Lincoln
GPR Good   8%   11%   11%
Fair/Poor   67%   62%   72%
Serious   25%   27%   17%


Based on the IE survey, almost eighty percent of the deck is delaminated or debonded. A high percentage of the deck, varying from about 30 percent on the Lane 6 side to more than 60 percent on the Lane 1 side, is already in a serious or severe condition. The delamination is more prevalent and more severe on the Lane 1 side and the delamination conditions are slightly less severe going towards Lane 6
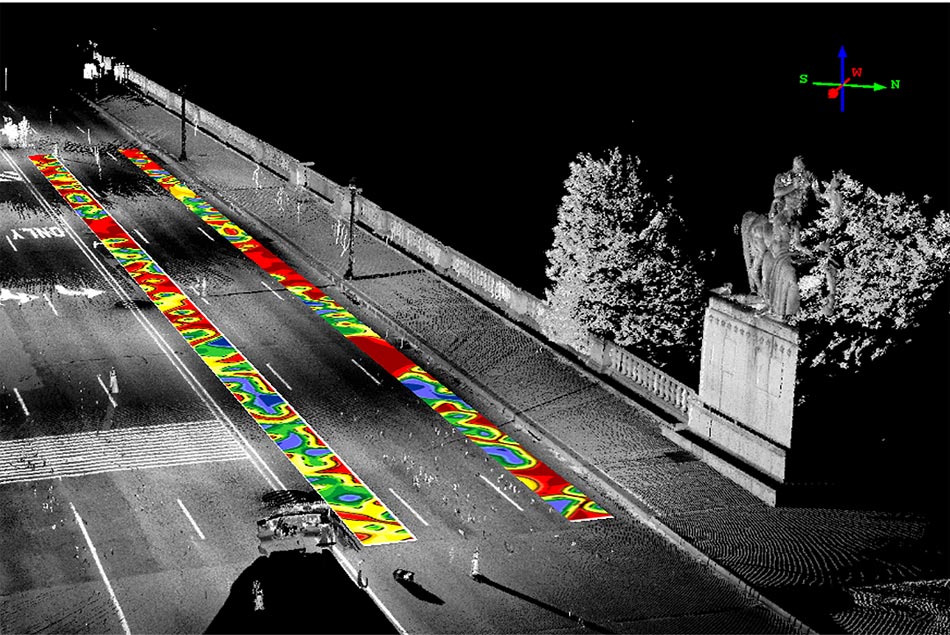
The whole slide is a black-and-white image using Light Detection and Ranging (LIDAR) of the Arlington Memorial Bridge. The image is taken looking down at the bridge from above. All six lanes of the bridge, one sidewalk, two light poles, and the bridge railing are shown. Two trees and a statue at the end of the bridge are also visible. Superimposed on top of the black-and-white LIDAR image are two colored contour plots of the Impact Echo data taken at the bridge.

Impact Echo Data Superimposed on LiDAR Image


The concrete modulus for most of the deck, about 80 percent, is less than 3000 ksi. The modulus is on the low side of typical values of concrete modulus in bridge decks, which in most cases is measured between 4000 and 6000 ksi.

The whole slide is a black-and-white image using Light Detection and Ranging (LIDAR) of the Arlington Memorial Bridge. The image is taken looking down at the bridge from above. All six lanes of the bridge, one sidewalk, two light poles, and the bridge railing are shown. Two trees and a statue at the end of the bridge are also visible. Superimposed on top of the black-and-white LIDAR image are two colored contour plots of the Impact Echo data taken at the bridge.

Impact Echo Data Superimposed on LiDAR Image


The GPR survey results also describe a significant percentage of the deck area to be deteriorated or/and highly corrosive. Only 10 percent of the deck area according to the GPR survey can be described as good.

The whole slide is a black-and-white image using Light Detection and Ranging (LIDAR) of the Arlington Memorial Bridge. The image is taken looking down at the bridge from above. All six lanes of the bridge, one sidewalk, two light poles, and the bridge railing are shown. Two trees and a statue at the end of the bridge are also visible. Superimposed on top of the black-and-white LIDAR image are two colored contour plots of the Impact Echo data taken at the bridge.

Impact Echo Data Superimposed on LiDAR Image


AMB Assessment by LTBP


QUESTIONS ??

The whole slide is a black-and-white image using Light Detection and Ranging (LIDAR) of the Arlington Memorial Bridge. The image is taken looking down at the bridge from above. All six lanes of the bridge, one sidewalk, two light poles, and the bridge railing are shown. Two trees and a statue at the end of the bridge are also visible. Superimposed on top of the black-and-white LIDAR image are two colored contour plots of the Impact Echo data taken at the bridge.

Impact Echo Data Superimposed on LiDAR Image


Federal Highway Administration | 1200 New Jersey Avenue, SE | Washington, DC 20590 | 202-366-4000
Turner-Fairbank Highway Research Center | 6300 Georgetown Pike | McLean, VA | 22101