
FEDERAL HIGHWAY ADMINISTRATION -- OFFICE OF HIGHWAY INFORMATION MANAGEMENT
WASHINGTON, D.C. (202) 366-0180
Press Conference on Issuance of Report,
Our Nation's Travel
On September 15, a Press Conference was held in conjunction with the issuance of the first report
based on the recently completed 1995 Nationwide Personal Transportation Survey (NPTS). The
report, Our Nation's Travel, describes the travel choices we make in meeting our business and
personal obligations.
Moderated by Gary Maring, Director of the Office of Highway Information Management, the
session had 50 attendees and was highlighted by a videotaped presentation of the major survey
findings by Acting Federal Highway Administrator Gloria J. Jeff .
The Acting Administrator noted that the findings of the survey reaffirm that the United States
remains the most mobile society in history, but they also demonstrate that there is still much to be
done to assure that all people have the mobility needed to achieve a desirable quality of life.
The NPTS found that of the billion trips made each day by the Nation's 100 million households,
900 million are by private vehicle and 19 million are by transit. This reflects the Nation's
dependence on highway travel to meet economic and personal needs.
Following the videotape presentation, the Acting Administrator joined the conference from Little
Rock, Arkansas, via teleconference. She provided further discussion on our need to remain
mindful of how travel is intertwined with how we fulfill our business and personal needs.
The conference included short discussions by the survey's other modal sponsors in the Bureau of
Transportation Statistics (BTS), the Federal Transit Administration and the National Highway
Traffic Safety Administration on how they will make use of the survey data.
The internationally known transportation consultant Alan Pisarkski provided commentary on the
unique information needs met by the NPTS and how it relates to other national surveys by the
Bureau of the Census and BTS.
The conference attendees also had an opportunity to see an Internet-enabled analysis system that
allows users to obtain answers to their specific questions using the survey databases.
Our Nation's Travel may be obtained from the FHWA Research and Technology Report Center
by phone, 301-577-0818, or by fax, 301-577-1421.
Further information on the Internet products from the survey, including the report, is available at
http://www-cta.ornl.gov/npts.
Questions on the survey may be directed to Bryant Gross, HPM-40, telephone 202-366-5026 or
E-mail (Bryant.Gross@fhwa.dot.gov).
1995 Nationwide Personal Transportation Survey
Low-Income Household Travel
According to the 1995 Nationwide Personal Transportation Survey (NPTS), low-income
households are nearly twice as likely to walk as people in other income groups. Low-income
households are defined as:
Number of Household Members Annual Income
One to two-person households Less then $10,000 annually
Three to four-person households Less than $20,000 annually
Five or more-person households Less than $25,000 annually
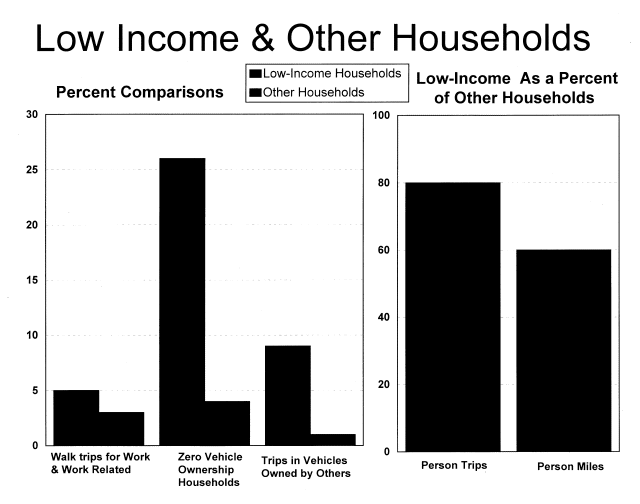
For work and work-related trips, low-income households report 5 percent of work trips by walk,
compared to only 3 percent for other income groups. Of these low-income households, 26
percent do not own an automobile, compared to only 4 percent of other households. Despite
having few vehicles, people in low-income households still make most of their trips in private
vehicles. These trips are much more likely to be made in a vehicle owned by someone else, such
as a friend or relative (9 percent for low income, compared to only 1 percent for the majority
population).
On a per-person basis, people in low-income households make about 20 percent fewer trips than
people in other households (1,340 person trips compared to 1,648 person trips). However,
because so many of these trips are by walking, the difference in person miles of travel is much
more striking. People in low-income households travel nearly 40 percent fewer miles (9,060 vs.
14,924 person miles).
For more information on the 1995 NPTS, visit our website at: http://www-cta.ornl.gov/npts, or
contact Bryant Gross at 202-366-5026.

Future Funding Formulas and Highway Information
Proposed surface transportation legislation reauthorizing the current Federal Intermodal Surface
Transportation Efficiency Act (ISTEA) programs would rely more heavily on highway
information furnished by the States to FHWA's Office of Highway Information Management
(OHIM).
House and Senate authorizing committees have included in their draft bills formula factors that
use State-furnished data. These include such factors as highway use of motor fuel and diesel fuel,
public-road lane miles, and vehicle miles of travel.
Both the House-proposed draft authorizing legislation ( H.R. 2400, "Building Efficient Surface
Transportation and Equity Act of 1997," also called "BESTEA"), and the Senate-proposed draft
legislation (S. 1173, also called "ISTEA II") provide for the increased use of highway
information. For example, the House-proposed bill would use State contributions to the Highway
account of the Highway Trust Fund (HTF) as a 1/3 factor in the distribution of Surface
Transportation Program (STP) funds and State commercial vehicle contributions to the Highway
account of the HTF as 1/3 factors in the distribution of Interstate Maintenance funds and National
Highway System (NHS) funds. (It is important to note that both Highway account contributions
and commercial motor vehicle contributions are attributed to the States based on highway use of
gasoline and diesel fuel, respectively--see the article titled "Estimation of Highway Trust Fund
Tax Receipts Attributable to Highway Users in Each State," in "Highway Information Update,
Volume 1, No. 2, dated July 29, 1996.) The Senate-proposed bill would use contributions to the
Highway account of the HTF as a 25-percent STP factor and highway use of diesel fuel as a 24-percent factor in distribution of the NHS component of some funds.
State-reported public road data and vehicle-miles-of-travel data would also be used more
extensively in proposed legislation. For example, the House-proposed bill would use rural public
road lane miles as a 1/9 NHS factor and urban public road lane miles as a 2/9 NHS factor. Rural
and urban VMT would also be used as an NHS factor as 1/9 and 2/9 factors, respectively.
Functional system information would be used in the Senate bill. Principal arterial lane miles and
VMT would be used in the distribution of the NHS component of funds while Federal-aid system
lane miles and VMT would be used in STP program fund distribution.
In anticipation of important changes in the use of State- reported highway data, OHIM has been
closely monitoring the proposed changes and emphasizing those data series. The OHIM issued
several memos through its field offices pointing out to States the possibility of increased emphasis
on motor fuel as a Federal formula distribution factor.
For additional information, please contact Ralph Erickson, HPM-10, at 202-366-9235.
Changes Affecting the Highway Trust Fund in the Taxpayer Relief Act
(P. L. 105-34) Signed by the President on August 5, 1997
The Taxpayer Relief Act contains tax and revenue provisions that affect the Highway Trust Fund
(HTF) and other transportation interests. The following bullets and Highway Statistics Table FE-21B summarize the major changes:
The following table displays current Federal tax rates.
For more information, please contact Ralph Erickson, HPM-10, at 202-366-9235.

Toll Road Data
FHWA has recently completed the 1997 edition of Toll Facilities in the United States. The
report is based upon information provided by State Departments of Transportation which are not
necessarily the toll road operating authorities. This often results in minor year-to-year
adjustments in reported length and status. The report is available through the Internet at
http://cti1.volpe.dot.gov/ohim.
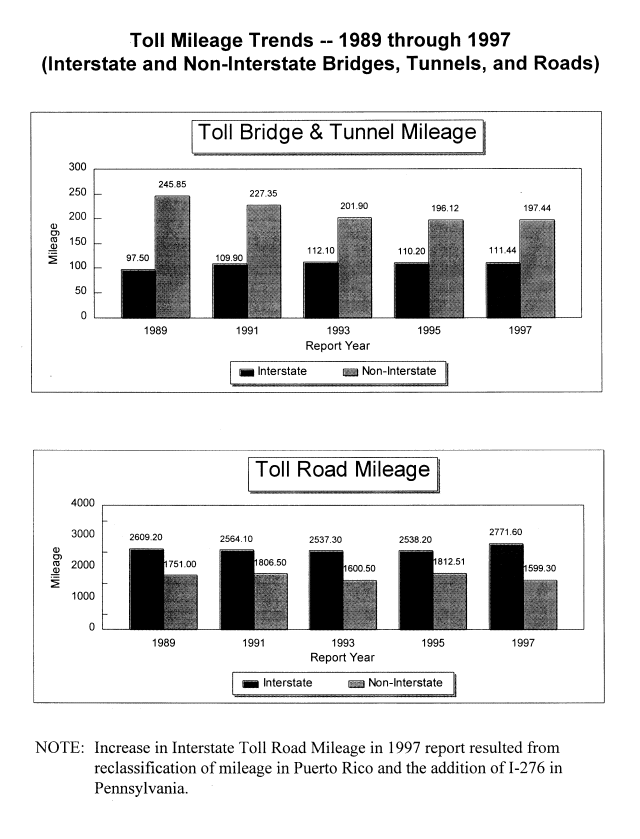
The following chart shows that for the last five reporting years, 1989-1997 inclusive, Interstate
toll bridge and tunnel mileage has increased very slightly while the miles of non-Interstate bridges
and tunnels have declined by about 20 percent. During the same period, the miles of Interstate
toll roads remained fairly stable until 1997, while the miles of non-Interstate toll roads have shown
some variation but no clear trend. The variation in non-Interstate toll road mileage is attributed to
an unequal number of deletions and additions of toll road facilities on a year-to-year basis. For
further information, please contact Connie Bell @ 202-366-5068.

1997 Highway Cost Allocation Study
The Department of Transportation and the Federal Highway Administration recently completed
and sent to Congress the 1997 Federal Highway Cost Allocation Study (HCAS). This is the first
Federal HCAS since 1982. The study was conducted in coordination with the Department's
ongoing Comprehensive Truck Size and Weight Study and will provide key inputs for estimating
infrastructure and certain other costs associated with truck size and weight policy scenarios.
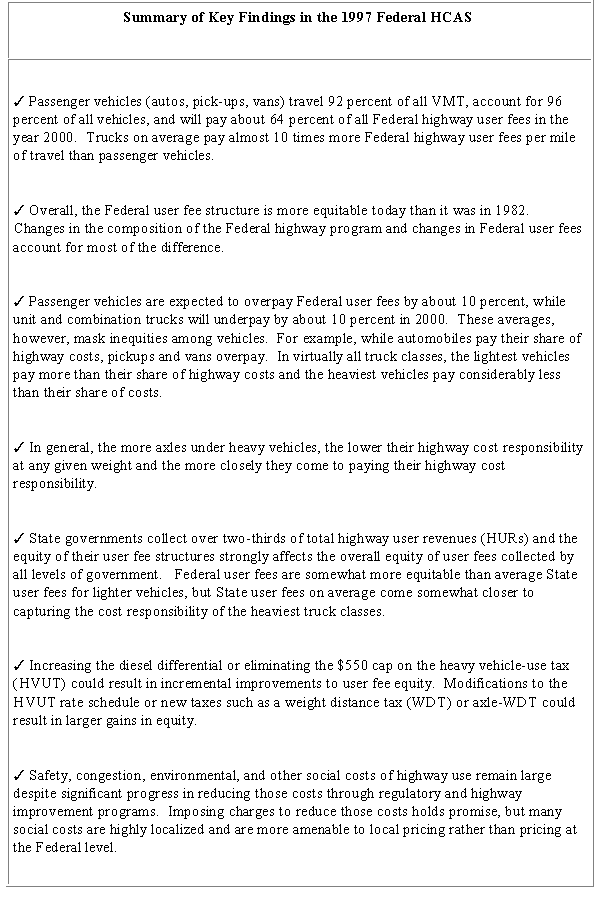
An important element of the study was to compare Federal user fees paid by different groups of highway users with their share of Federal costs to construct, maintain, and operate the Nation's highway system. Among the other issues considered in the study were (1) cost allocation for all levels of government,
(2) marginal costs of highway travel and the extent to which Federal highway user charges are
economically efficient, and (3) social costs of highway use, including crashes, congestion, and
environmental impacts. The following table summarizes key study findings.

The Department plans to conduct future highway cost allocation studies on a more regular basis.
A project is underway to adapt data, software, and analytical tools developed for the Federal cost
allocation study for use by States. For further information, please contact Jim March, HPP-10,
on 202-366-9237.
Traffic Monitoring in Large Urbanized Areas
An increasing need for quality traffic monitoring data to support transportation program needs is
clearly evident as a result of policy changes brought about by highway and clean air legislation.
Other contributing factors include the need to monitor transportation program performance,
relieve congestion, and enhance intermodal activities. Effective traffic data collection programs
are critical to the provision of traffic characteristics data in urbanized areas. Two final reports
have been recently released by the FHWA documenting the findings of a study conducted by the
Volpe National Transportation System Center (VNTSC).
The first report, An Overview of Traffic Monitoring Programs in Large Urban Areas, presents
results from a survey of urban traffic monitoring activities in the 128 urbanized areas with
population greater than 200,000. The survey examined urban traffic monitoring programs,
including traffic volume, vehicle classification, truck weight, speed, and vehicle occupancy.
Comprehensive information is provided in generalized table format. The survey was conducted
during December 1995 and January 1996.
The second report, Case Studies of Traffic Monitoring Programs in Large Urban Areas, presents
details of the traffic monitoring programs within the urbanized areas of Minneapolis, Minnesota;
Philadelphia, Pennsylvania; Portland, Oregon; and Tampa, Florida.
The reports are electronically accessible from the OHIM Website [http://cti1.volpe.dot.gov/ohim]
or through the FHWA Webpage [www.fhwa.dot.gov]. For additional information, contact
Joseph Mergel, VNTSC, 617-494-2777, or Tony Esteve, FHWA, HPM-30, 202-366-5051,
Internet E-mail [tony.esteve@fhwa.dot.gov].
Traffic Monitoring Data Variability Research Completion
The final report, Variability in Traffic Monitoring Data, presents the findings of a study
conducted by the Oak Ridge National Laboratory (ORNL) for the Office of Highway Information
Management (OHIM) in cooperation with the Florida and Washington Departments of
Transportation.
The objective of the study was to analyze continuous traffic volume, vehicle classification, and
truck weight data to identify and quantify variability patterns. Increased understanding of traffic
variability will help to improve the statistical accuracy of traffic data, assist in overcoming data
deficiencies and limitations, and provide a means to increase the cost-effectiveness of traffic data
collection activities.
The report summarizes detailed analyses to identify the temporal variation in the traffic data,
compare alternative estimation procedures, determine the effect of missing data on annual
estimates, examine the effects of holiday and holiday periods, and compute traffic and variability
statistics at each site. The information extracted can be used to make determinations regarding
the need to adjust traffic estimates to compensate for variability, to track missing data, to
aggregate vehicle classification categories to improve the characteristics of the estimates, to assist
in the editing of raw data, to monitor changes in traffic characteristics over time, to conduct trend
or time-series analysis, and to establish how best to collect the information to improve the quality
of the estimates.
The report is electronically accessible from the OHIM Website [http://cti1.volpe.dot.gov/ohim] or
through the FHWA Webpage [www.fhwa.dot.gov]. For additional information contact Pat Hu,
ORNL, 423-574-5284, or Tony Esteve, FHWA, HPM-30, 202-366-5051, Internet E-mail
[tony.esteve@fhwa.dot.gov].
| UPCOMING CONFERENCES |
|
North American Travel Monitoring Exhibition and Conference (NATMEC '98)
Charlotte, North Carolina May 11-15, 1998 |