Hang-ups-Looking at Non-Response in Telephone Surveys
Nancy McGuckin
Travel Behavior Analyst/NHTS Team Member
Nancy.McGuckin@dot.gov
Adella Santos
NHTS Team Member
Adella.Santos@dot.gov
Susan Liss
NHTS Team Member
Susan.Liss@fhwa.dot.gov
ABSTRACT
Since the mid-1980's, telephone surveys have become the standard practice for obtaining data on household travel in the U.S. (Stopher, 1996). But, for a variety of reasons including changes to the North American telephone numbering system, the availability of intercepting technologies, such as caller-ID, and the multiple contacts required to complete a two-stage survey, telephone-based travel surveys seem to be suffering from declining response rates. Recent regional telephone surveys of household activity or travel surveys in the U.S. have had household response rates ranging from 20 to 40 percent (Zimowski, Tourangeau et al, 1997).
The information presented in this paper was obtained from the pretest of the National Household Travel Survey (formerly the NPTS/ATS). The 2000 pre-test included a number of method and content tests, but for this research we examined the test of nine contact attempts versus nineteen contact attempts and the imbedded non-response follow-up survey. For the pre-test as a whole, the household recruitment rate (called the cooperation rate in this paper) was 44 percent, and the final response rate was 28 percent. This very low response rate prompted a hard look at where we lost potential respondents in the survey process.
Non-response is made up of refusals and non-contacts. We have used the call-disposition file (a tally of the results of each attempt to contact each household) and the non-response follow-up survey to try and understand more about non-response. From the call disposition file we have found that non-contact is a much larger area of loss than direct refusal. For example, almost 30 percent of call attempts reached an answering machine, and never contacted a person. Another 25 percent of call attempts rang with no answer.
When response rates fall low enough, questions about the representativeness of the respondents are raised. This is probably the biggest challenge facing telephone-based and random-digit dialing (RDD) surveys. As contact rates and response rates fall, survey practitioners should consider a range of techniques to increase contact and participation.
1. Overview:
One of the greatest dilemmas faced by survey practitioners in the US today is weighing the benefits of CATI (computer assisted telephone interviewing) with an RDD (random digit dialing) sample frame compared to the seriously declining response rates for this method. The CATI/RDD method for large-scale surveys gained popularity in the U.S. throughout the 1970's and by the end of the 1980's even some very traditional government agencies had switched from address samples to RDD. The benefits of the telephone contact, using an RDD sample, compared to an address sample, include:
However, in the U.S. lately we appear to be facing a serious decline in response rates with this method. People have become wary of telephone solicitation and find it easy to hang-up the telephone. Families are busy and resent intrusions on their home time. Perhaps the distrust of government has increased, as have concerns about privacy.
Some researchers are looking at the assumptions integral to the CASRO standard of computing response rates, such as the assumption that non-contacts are proportionally similar to contacts in terms of eligible units. Some researchers continue to look for methodological approaches, such as pre-contact letters to legitimize the survey, very intensive contact attempts (one federal survey will attempts each number up to 40 times), and multiple modes of contact.
In addition, the use of an RDD sample is further complicated by changes in the telephone industry, such as the almost six-fold increase in the number of potential telephone numbers in the time between 1990 and 2000, greater availability of cell phones, and multiple lines in many residences.
In this research we looked at non-contacts and refusals by using the call disposition file (which tallies the results of each call attempt to each sample number), and the non-response follow-up survey imbedded in the pretest.
The call disposition file is a rich source of information but cumbersome to analyze. Information on each call attempt allows us to keep track of contact patterns and telephone answering behavior, and potentially to link contact patterns to final outcomes. For example, some intriguing research in political opinion surveys (Couper 1997) found that people who said they were not interested in participating, but later completed, had very different political attitudes then those who readily agreed to participate. Follow-up research linking the contact behavior to travel patterns might discern similar biases.
2. Changes in the Sampling Frame
There has been considerable discussion in the market research field about the changes in the U.S. telephone sample frame. The growth in telephone exchanges because of telephone company competition, the release of telephone numbers from geography (called portability), the proliferation of multi-line households, the projected surge in cellular phones as a main residential phone have complicated the picture even more.
In addition, the many barriers to contacting a person continues to concern practitioners, as use of an answering machine grows in acceptance and more and more methods of screening calls are available to the telephone user. Call identifying technologies, such as caller-ID and privacy guard, as well as multi-use telephone lines, increase the difficulty of identifying an eligible household from the RDD sample.
These concerns focus on two things: fishing for residential numbers in a more dispersed universe of working eligible samples, and barriers to contact a potential respondent via the telephone line. The concerns about the sample frame grow from the proliferation of exchanges, which in turn lowers the household 'hit' rate, and also brings into question some of the techniques used to increased sample efficiency (such as sampling only blocks where at least one number is listed). The proliferation of exchanges and the effect on the probability of connecting with a working residential phone are shown in Table 1.
Table 1 - Declining Household "Hit" Rate in U.S. RDD Samples
|
1990
|
1993
|
1996
|
1999
| |
| Residential Active Exchanges (1) |
34,929
|
37,247
|
41,396
|
55,160
|
| Active Banks (millions) (2) |
164
|
177
|
202
|
236
|
| U.S. Households (millions) (3) |
94.2
|
95.8
|
100.0
|
106.0
|
| Estimated Household "Hit" Rate |
57.4%
|
54.1%
|
49.5%
|
44.9%
|
(1) Bellcore/LERG Files, 1990-99, Type 00, 50-54
(2) Derived from Donnelley DQI Listed HH database, 1990 - 99, 1+ HH
(3) Genesys Database/ Claritas, 1990 - 99 (This table taken from: http://www.m-s-g.com/refernce/mra/sld019.htm)
Clearly, the changes to the system of telephone numbering has made it's contribution to declining response rates. In the NPTS series we found:
The impact of the growth in multiple telephone households is less documented, but concerns revolve around increasing the probability of selection on the one hand and decreasing the efficiency of the sample on the other. Some research has indicated that the growth of ring/no answer= as a proportion of the sample disposition is a direct result of the rapid rise in home-office, mixed-use lines and fax/modem lines. For example, if a line is equipped with call waiting, but is being used for an internet connection, the attempted call could result in a ring/no answer when the computer is on-line.
In 1999, the U.S. national average of land-lines per household was 1.2 and 25 percent of all households maintained more than one line (Centris Tracking, July 1999). The NPTS determines the probability of household selection by asking a series of questions about the number of telephone lines for participating households, and in the 2000 pretest a sampled household had an average of 1.34 land-lines. Altogether, 27.1 percent of sampled households had more than one land-line. Almost a third of sampled households had at least one cell phone, with another 24 percent having 2 or more. The overall average was 0.84 cell phones per household.
In 1999, the U.S. national average of land-lines per household was 1.2 and 25 percent of all households maintained more than one line (Centris Tracking, July 1999). The NPTS determines the probability of household selection by asking a series of questions about the number of telephone lines for participating households, and in the 2000 pretest a sampled household had an average of 1.34 land-lines. Altogether, 27.1 percent of sampled households had more than one land-line. Almost a third of sampled households had at least one cell phone, with another 24 percent having 2 or more. The overall average was 0.84 cell phones per household.
Clearly, we are a wired nation. But technological barriers make it more difficult to identify and contact eligible households from the RDD sample. In the U.S. about 50 percent of households have an answering machine, 25 percent have (but may not consistently use) caller-ID, and another 6 percent subscribe to voice mail or other call management systems. (Piekarski, 1999)
In 1999, 43 percent of U.S. households had computers, and half of those had the ability to go online. (Ernst and Young, 1999) This growing portion of household activity means that whether a household has one or multiple lines, a large number are likely tying up a phone line with various on-line activities.
One of the biggest current issues for survey practitioners is reaching beyond these barriers to correctly identify the universe of eligible units (providing a more faithful representation of response rates) and to contact a human being to recruit into the survey. The patterns of call attempts from the NPTS pretest show a surprising complexity in contact outcomes.
3. Disposition of the RDD Sample
A pretest of the household travel survey was conducted in February - May 2000 in two areas, Boston, MA and Tulsa, OK. Two specific geographic units were selected to enable us to test an address-sample frame against the RDD. The goal was to interview a total of 2000 households, about half in each area. In actuality, the pretest netted about 1750 completed households. Figure 1 shows the disposition of sampled numbers.
In the pretest, 41,251 call attempts were made to 9456 telephone numbers, an average of 4.4 call attempts per sampled number. Of the original sample of telephone numbers, 6145 were found to be households or were presumed to be households. In the pretest, a 44.6 percent of the households agreed to participate (2740 of the 6145 households). Because such a small proportion of households were respondents at the household interview level, we investigated the patterns of call attempts to examine the contact rates and call history of non-contacted households.
The overall disposition of the 41,251 call attempts to the 9456 telephone numbers are shown in Figure 1 and Table 2. This inventory includes all pretest designs the test of a maximum of nine call attempts and the test of a maximum of nineteen attempts. Once the caller reached a live person no limit on the number of call-backs was set.
Figure 1
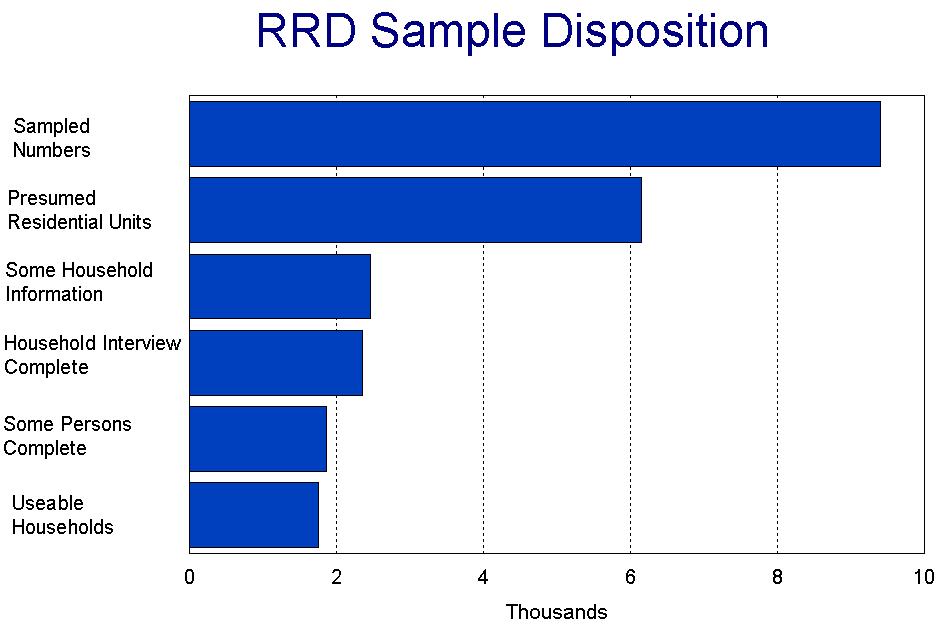
Table 2 - Outcome of Sampled Numbers
|
Dispsition
of RDD sample numbers:
|
Number
|
Percent
|
| Out of Scope |
3434
|
36.5
|
| Reached a person: Partial or Complete Household Interview |
2460
|
26.2
|
| Reached a person: Refused |
1500
|
16.0
|
| Reached a person: Language Barrier |
67
|
0.7
|
| No Contact - Answering machine |
1023
|
10.9
|
| Scope Undetermined |
831
|
8.8
|
| Other |
86
|
0.9
|
| TOTAL |
9401
|
100.0
|
We should note that some people who completed the household interview and agreed to participate in the survey failed to complete the survey. We have called these households "passive" refusals. Almost 25 percent of the households who completed the household interview ended up with enough persons in the household reporting travel information to be usable. In the pretest a household was defined as usable if at least 50% of the adults (ages 16 years and older) completed the person-level interview about their travel.
3.1 Productivity of Increased Call Attempts
We tested two levels of intensity to reach a sampled number: nine call attempts and 19 call attempts. Overall, only 6.5 % of the numbers we designated as residential rang with no answer on every call. Eighteen percent of unique households had a person who answered and said, "call back" at least once, and 33% of the unique households had an answering machine pick-up at least once.
For this analysis we use only telephone numbers that were positively determined to be residential (approximately 5600 numbers). To do this we removed a large proportion of undetermined outcomes (831 telephone numbers), and look at the patterns of response for telephones in eligible households.
The greater number of call attempts resulted in higher contact rates overall, and higher response rates--about 8 percentage points higher at the household/screener level, but only 5.5 percentage points greater for completed households (those which responded to the travel interview). The effect was tested and found significant, but in data analysis we noticed a trailing-off of productivity. For instance, we found:
The greater intensity of effort resulted in higher completion rates and lower proportions of unresolved numbers. One of the benefits of the greater number of contact attempts was to help determine whether the number is a household (i.e., in-scope) or not. The numbers with nine call attempts resulted in 9 percent of the sample numbers having no contact (scope not determined) versus less than 8 percent of the numbers that were tried 19 times. The added calls required greater resources, and the overall increase in contact was small. However, reducing the number of cases of scope not determined usually helps the precision of the response rates.
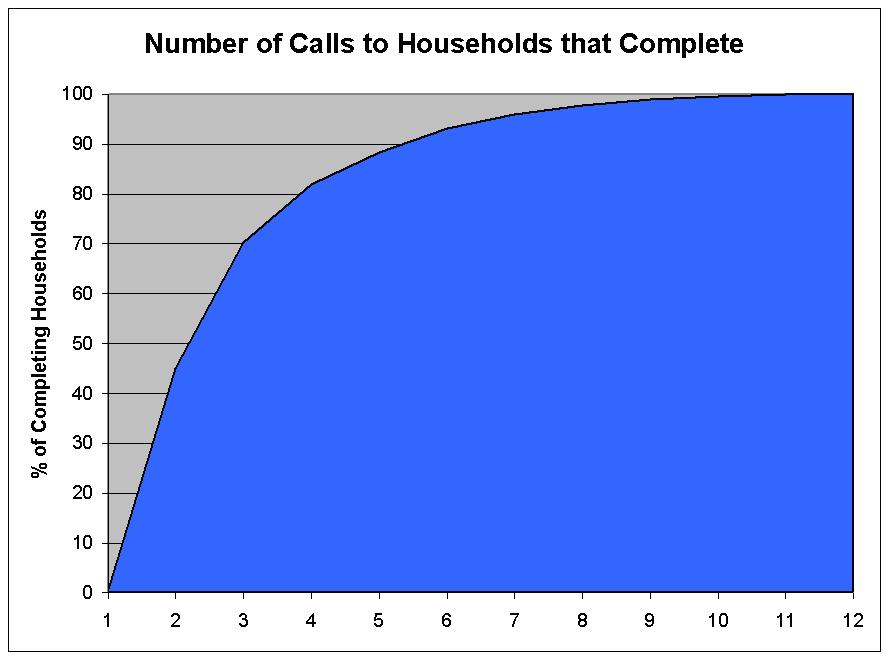
Figure 1 shows the decay in productivity for the added effort in call attempts. The number of calls to completing households is most productive on the first few calls and levels off significantly after eight or nine. In fact, even though we allowed fifteen call attempts in one arm, none of the completed households the survey received more than 12 recruiting calls.
Figure 1
3.2 Patterns of Call Attempts
Focusing on call attempts can be confusing for survey methodologists used to looking at data for household level or person level response. The results of each attempt can be varied, while the household is coded to a single outcome. For instance, here is a series of call attempt outcomes that were finally coded an answering machine:
Case 1: AM Ring AM Busy CB CB Busy AM
Case 2: Busy REF AM CB AM AM AM AM
Case 3: AM AM AM AM RING RING AM AM
Case 4: AM AM CB CB CB AM AM AM
Where:
AM=Answering Machine
CB=Person said "Call Back"
Ring=Ring with no answer
REF= Person Refused
Comp= HH Interview
Table 3 shows the proportion of call attempts in each of the coded outcomes. The highest percent of the call attempts reached an answering machine; nearly 30 percent. The protocol for the pretest allowed one message to be left on the answering machine during recruiting (although this was only done about half the time). In fact, a person answered the phone only a quarter of the time. The phone rang with no answer (six rings) 24.8 percent of the time.
Table 3 - Inventory of Call Attempts
|
Disposition
code of call attempt
|
Frequency
of Call Attempts
|
Percent
of Call Attempts
|
| Answering machine, never talked to a human |
12,063
|
29.2
|
| Reached a person: Total (of shaded rows) |
10,676
|
25.9
|
| Reached a person: Completed Household Interview |
4,335
|
10.5
|
| Reached a person: Set a Call Back |
3,237
|
7.8
|
| Reached a person: Refused to Participate |
2,828
|
6.9
|
| Reached a person: Other (language, mail-out needed, etc.) |
276
|
0.7
|
| Ring, no answer |
10,237
|
24.8
|
| Other |
5,456
|
13.2
|
| Busy |
2,819
|
6.8
|
| TOTAL |
41,251
|
100.0
|
It is interesting that although the response rate was higher in the design that allowed more call attempts, the average number of call attempts per sample household did not differ significantly in the arms that had a higher maximum. Table 4 shows the household level response rates and the average number of call attempts for each test.
Table 4 - Number and Percent of Household-Level Outcomes for 9 and 19 Call Attempts
| Call Outcome: |
Nine
Attempts - Number
|
Nine
Attempts - %
|
Nineteen
Attempts - Number
|
Nineteen
Attempts - %
|
| Answering Machine on every call |
204
|
3.1%
|
6
|
0.4%
|
| Ring, no answer on every call |
546
|
8.2%
|
59
|
3.9%
|
| Call Back (at least once) |
2251
|
34.0%
|
453
|
30.0%
|
| Completed * |
2057
|
31.1%
|
762
|
50.4%
|
| Refused * |
1167
|
17.6%
|
171
|
11.3%
|
| Completed, after refusal |
400
|
6.0%
|
60
|
4.0%
|
* The designs with 19 attempts included refusal conversion and non-response follow-up, some of which completed the survey.
The design with long-distance travel only may have been a more interesting topic and a less burdensome survey to the respondent, and we expected the household level response rate to be highest for this group.
Overall, we can divide the outcomes of call attempts into 'good' outcomes, if the respondent completed the household interview and agreed to participate in the survey, and 'bad' outcomes, for example, refusals or a number that is ultimately unresolved. The average number of calls to obtain an ultimately 'bad' outcome is much higher than for a 'good' outcome, as shown in Table 6. Ultimately, if a household is going to participate they will participate within a few calls.
Table 5 - Level of Response by Average Number of Call Attempts
|
Test
|
Average
Number of Call Attempts
|
Household
Response Rate
|
| Daily Travel Only - No Pre-Incentive |
4.2
|
35.7
|
| Daily Travel Only - $5 Pre-Incentive mailed to listed households |
4.2
|
40.5
|
| Long Distance Travel Only |
4.5
|
56.2
|
| Daily Combined w/retrospective long distance (19 call attempts allowed) |
4.5
|
49.4
|
| Daily Combined w/prospective long distance |
4.3
|
40.8
|
Table 6 - The Mean Number of Calls by Whether Household Completed Interview
|
Test
|
Average
Number of Call Attempts for Complete Surveys
|
Average
Number of Call Attempts - Not Completed
|
| Daily Travel Only - No Pre-Incentive |
3.32
|
4.35
|
| Daily Travel Only - $5 Pre-Incentive mailed to listed households |
3.25
|
4.42
|
| Long Distance Travel Only |
3.10
|
5.00
|
| Daily Combined w/retrospective long distance (15 call attempts allowed) |
3.49
|
4.76
|
| Daily Combined w/prospective long distance |
3.35
|
4.46
|
| Overall |
3.35
|
4.59
|
4. Soft Refusals and Passive Refusals
The pretest allowed for a respondent to offer a soft refusal= (no profanity or threats) three times before coding the household as refused. Eighty-three percent of these refusals happen before the introduction is complete (for instance, "Hello, my name is ___ and we're conducting a survey for the Department of Transportation..." is interrupted with "I'm not interested" and the person hangs up). A little over 28 percent of the households who had initially refused eventually ended with a completed household interview (5.32 percent of the call attempts in Table 7). Sometimes the refusal was by one person, and on the second try we would reach a different household member who would cooperate. Sometimes a different day or time of evening might make a difference.
Table 7 - Refusal and Completion
|
Outcome
for household:
|
Number
|
Percent
|
| Initially refused, but ended with completion |
503
|
5.32
|
| Initially refused, and never completed |
1277
|
13.51
|
| Never refused, completed |
2344
|
24.79
|
| Neither refused nor completed |
5331
|
56.38
|
In the review of the call history for each household, we became aware of the amount of avoidance used by respondents. We noticed that many people told us to call back as a way to avoid participation. Nearly half of the people who said call back the first time we reached a person, said call back the second time we reached a person. Almost a quarter of the people who at first said call back completed the survey, 18.5 percent refused eventually, and 10.2 percent rang with no answer for the remainder of the survey period.
Table 8 shows the percent of cases and the mean number of call attempts required to resolve the household after the respondent said 'call-back' on the first contact. For instance, for those households that initially said 'call back' it took three more calls to complete the survey, for those that initially said 'call back' it took 2.7 more calls to obtain a refusal.
Table 8 - Mean Number of Calls to Resolve Household after Initial Coding of "Call-back"
|
After
a person says "call back" once, the number of call-backs to:
|
Mean
|
Percent
|
| Complete the survey |
3.0
|
24.0%
|
| Refuse the survey |
2.7
|
18.5%
|
| Live person says "call-back" again |
1.9
|
47.3%
|
| Never get a person again (ring/no answer) |
4.4
|
10.2%
|
As a way of understanding the subtle differences in what a person meant when they said 'call-back' we looked at the disposition comments typed in by the interviewer at the end of the phone call. Not all of the call records had typed comments, only when a live person answered the phone and only when the interviewer thought the comments could help the supervisors in disposition coding, or the next interviewer that made a call to the same household.
Coding the comments into general categories, we found that many respondents offered more than one excuse, so categories often overlapped. Since the interviewers were not trained to type in coded comments, and we were just looking at the raw comments, the categories are not mutually exclusive. Nonetheless, it is informative to listen to what the interviewers hear from real respondents in their own words. A total of 1551 cases with comments were examined to see what patterns might emerge. For instance, some comments include:
Comment coded as "Call back"
Comment coded as "Busy"
Comment coded as "Bad Time"
Comment coded as "Hung-up"
The biggest proportion--80 percent overall and over half of respondents who had comments coded--simply hung-up during the introduction. By far this is the most common way to refuse a telephone interview. This analysis made us look closely at our introduction, and to try to make the survey more relevant to the respondent.
If there was even a slight chance to get the interview on a call-back, the interviewer took it. Almost one out of five of the cases with comments were coded as a call-backs even when the comments included what also might be termed "soft-refusals"
Only three percent of the comments for these refusals clearly stated that the respondent does not give information over the phone B about the same as the number who said they did not speak English. Since these are refusers, it is interesting to note that the overall sample produced less than one percent of households as "Language problem" (in the pretest we did not have a Spanish version of the survey).
Table 9 - The Excuses People Say
|
The interviewer
coded:
|
Number
|
Percent
|
| Person "Hung Up" | 810 | 52.2% |
| Person said "Call Back" | 298 | 19.2% |
| Person said "Bad Time" | 189 | 12.2% |
| No HH Members Present | 146 | 9.4% |
| Person said "Busy Now" | 62 | 4.0% |
| Person said "I don't give information over the phone | 46 | 3.0% |
| Does not speak English | 42 | 2.7% |
| Illness | 21 | 1.4% |
Clearly, reducing the number of hang-ups is the most effective way of improving response rates. Our survey, like many others, could benefit from a less traditional introduction. However, the down side of that approach is leaving the respondent with the impression that this is not a serious study. We have yet to fully grapple with that trade-off.
5. Non-Response Follow-up Survey
It is difficult to get information about non-respondents. We need to know whether they are similar to respondents in the thing that we are measuring (e.g. travel). If non-respondents are similar to respondents, the information about them could be assumed to be missing completely at random (MCAR) (Little and Rubin, 1987) and therefore the non-response is considered ignorable.
If non-respondents are different than respondents in the thing we are measuring, e.g. travel, then we have non-response bias in our results. Our estimates will be inaccurate in ways we cannot predict (because we don't know about the non respondents).
Special studies of non-respondents that are conducted as a follow-up survey don't seem to show stark demographic differences between respondents and non-respondents. Some of this could be the very low number that completed the non-response follow-up survey--only 156 non-respondent households.
Non-response in surveys can introduce an amount of bias to make the study results suspect. Some researchers believe that there is a continuum of resistance to participation in surveysBthat some households will participate on the first attempt, some with more attempts, some with incentives, some with even greater incentives, and so on as a continuum. Efforts to include people are intensified as the resistance increases. In this model, people who are further along the spectrum that is, more difficult to include in the survey--are similar the non-respondents. In fact, 7 of the households who were contacted in the non-response study were recruited into the main survey, although none of these households actually completed the full survey.
In this research we are referring to the households that completed the non-response follow-up survey, although it is clear that they represent a set of people who are harder to get to respond, but at some level responders (since they responded to the non-response survey). On the continuum of response they may be more like non-responders, but we have no evidence from non-responders to compare.
In the pilot study, we included refusal conversion as an operational part of contact procedures. That is, the respondent had to refuse on three separate calls (unless violence was threatened or profanity used) before the number was marked as a refusal. People who refused outright, people who simply hung-up during the introduction, and non-contacts were included in a follow-up study to assess whether the non-respondents are very different from those who complete the survey.
The non-responding households were followed-up in two designs Bone RDD-based sample and an address-based sample. To increase the household-level response rates, postcards were mailed to all non-responding households for which an address was available. These postcards asked the household members to call a specified number to complete the non-response follow-up survey (and receive the ten dollar incentive).
Four hundred RDD households and 200 address-sample households were specifically targeted for the non-response follow up survey. Twenty-eight percent, or 169 households completed the ten-question interview. Of those 15 were completed in-person and the remainder over the telephone. Seven of the non-response follow-up households actually converted and consented to be part of the survey. None of those seven ended up a usable household.
The non-response follow-up survey obtained detail about the demographic characteristics of the household members, such as age, sex, income, etc. in an attempt to discover if socioeconomic characteristics of responders are different than those of non-responders. In addition, some questions about whether the person on the phone took trips 'yesterday' were asked to help determine travel for non-responders. A ten-dollar incentive was paid to people participating in the follow-up survey.
The non-response follow-up questionnaire asked a subset of the questions asked of the households that completed the initial interview. These included:
Household respondents who provided the information were paid ten dollars for their time. The information was recorded on a paper questionnaire and keyed into a separate data file. Overall, nearly five percent of the people who initially refused in the RDD sample eventually completed the non-response follow-up.
Although the sample sizes are small when divided into analysis groups, there are differences between the completing households and the non-responding households. These differences need to be checked for statistical validity. But, overall in comparing the non-responding households with the responding households, it appears that non-responding households:
Have more people in the household. Almost 31 percent of non-response follow-up households have four or more people, compared to 23.5 percent of completed households.
Have more workers in the household. Non-responding households have three or more workers in the house in 16 percent of the homes vs. just eight percent of the completing households.
Have more drivers in the household. Almost one out of five (19.2 percent) of non-response follow-up households have three or more drivers vs. 12.2 percent of the completed households.
Have fewer vehicles. The two groups of households have similar proportions with no vehicles available (5 % vs. 6%). However, 35 percent of non-response follow-up households have only one vehicle, compared to 29 percent of completed households, and only 34.4 percent of non-response follow-up households had two vehicles compared to over 45 percent of the completed households.
Are more often Hispanic. The non-responding follow-up survey households are about the same proportion of white and black, and slightly more likely to be Hispanic.
6. Conclusions and Future Research
Response rates overall are viewed as a measure of the quality of the survey. Higher response rates help tame our fears about response bias. As response rates have fallen, essential survey conditions have been expanded to keep response rates up. For example, in analyzing the pretest overall, we found that a final good outcome depended on the number of people in the household (this is a two-stage survey in which half of the household members must complete in order for the household data to be usable), the number of call attempts, and the race/ethnicity (although the sample sizes for minority respondents was small, and the pretest was only conducted in English). Factors that seemed to increase response during the pretest included:
In examining the results of refusal conversion we found that non-response may be more situational than it is stable. That is, the same person may refuse, be a non-contact, or a respondent based on the timing of the call. This is consistent with previous research (Groves and Couper, 1998). Increasing our attempts to contact a number increases contact rates and increases response rates. Both strategies are becoming part of the common repertoire of techniques used in travel surveys.
However, even with more intense efforts to contact and recruit households, response rates have been declining. Recent changes in the North American numbering system, the competitive telephone service provider markets, the growth in multiple phone lines, and the growth in cell phone use (especially to the extent it replaces land-line telephone use) all seem to impact our ability to conduct RDD-telephone surveys.
In addition, barrier technologies are used to screen out unknown callers. People are difficult to reach on the telephone, and when an interviewer gets through many people do not have any motivation to participate. The low response rates hamper the credibility of RDD-sample survey results. There is much more that needs to be done and can be done in this field.
Some specific factors that are widely used to explain non-response in surveys include socio-demographic characteristics of the respondent, such as age, gender, income, and health status. Response rates have been shown to vary with each of these. Other factors have also been related to response rates, including:
Groves (1992 AAPOR) asserts that these factors produce a set of psychological predispositions that affect the decision to participate in the survey.
In the non-response follow-up survey analyzed here the demographic differences between responders and non-responders are small. In our case, the respondents to the follow-up study might be viewed as RESPONDENTS who were just harder to contact or recruit. In trying to understand the non-respondents, perhaps a survey is not the best option.
Perhaps we can use our knowledge about respondent demographics and response probability in a more integrated way. For instance, some samples are pre-screened (during address-matching for pre-contact mailings, for instance) so that information is available about the assumed county or area of the area code and exchange. Data that can be helpful includes:
Using these data would allow us to better understand and craft alternative approaches to survey non-responders. Information from the pre-screening could be used to adjust the timing of the contact calls, for instance. Other approaches include targeted mailings, information campaigns, or incentives. One potential problem is that these data are at the census tract or block level-and as summary variables the medians may mask considerable differences.
With a better understanding of the patterns of call attempts we could program dynamic scheduling, which would bring a number up at a different time based on the previous patterns of contact for that number. For instance, if a line is busy, a series of call-backs could be scheduled for the same evening, then near the same time the following evening, or near the same time one week later on the same day.
We might even consider setting callback times or the maximum number of calls differently for different call outcomes. For instance, if a line consistently rings with no answer, but then we get an answering machine, we could set a daytime call-back to see if a different outcome occurs (the person may be on-line in the evening, and an answering machine picks up during the day, or the person may be away in the evening and available during the day).
One area we did not get a chance to analyze is the amount of time from the first contact to the final outcome. An issue we try hard to overcome is the time lag between the recruiting call and the assigned travel day--a lot can happen in people's lives in two weeks, and their promise to respond may grow stale. The use of Express Mail cuts the lag time, but we have not analyzed these issue related to the timing of the series of contacts.
With the growth of electronic communication we really have to consider multi-mode surveys, allowing for mail, phone, or Internet response. But in the immediate future, even with a mixed mode survey, the use of the telephone in contacting respondents will remain an important element and must be understood and used more effectively. More research is needed to develop creative ways to make CATI a more effective survey instrument.
References