Highway Information Quarterly Newsletter
January 2002
Office of Highway Policy Information
Federal Highway Administration
| This edition will be the last printed copy of the Highway Information Quarterly newsletter. Future editions can be found on our website at: https://www.fhwa.dot.gov/policy/ohpi/newsletters.htm |
Highway Statistics 2000
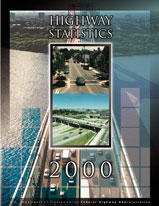 |
The Highway Statistics 2000 has just been released. This is the 55th edition of this annual report, and contains statistical data on motor fuel, motor vehicles, driver licensing, highway-user taxation, State and local highway finance, highway mileage, Federal-aid for highways, and other valuable information. Tables from the printed report and other State tabulations are available on the web at: https://www.fhwa.dot.gov/policyinformation/statistics.cfm. Hard copies expected to be distributed in February. For more information, contact Bryant.Gross@fhwa.dot.gov or phone 202-366-5026. |
Our Nation's Highways - 2000 edition
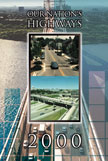 |
The biennal publication Our Nation's Highways will be available in February 2002. The information in this publication provides overview of facts and figures about the highway program. This publication is designed to be of interest to anyone needing a concise description of trends in highway transportation. The Office of Highway Policy Information is the editor and source for most of the data. Much of the data in the publication is from the annual Highway Statistics series. For more information, contact Bryant.Gross@fhwa.dot.gov or phone 202-366-5026. |
Most Traveled Principal Arterials by Urbanized Area - 2000
Twenty-four urbanized areas had 779 miles of principal arterial highways that operated at a level of 200,000 or more vehicles per day. The table below summarizes by route the amount of Interstate and other freeways and expressways that carried 200,000 or more vehicles a day, and the highest daily traffic reported for the route. About 48 miles of these highways carried at least 300,000 vehicles a day. The highest daily traffic of 365,852 vehicles a day was reported along a 12-lane section of I-5 in Orange County, California. On non-Interstate segments, the highest daily traffic of 320,283 vehicles a day was reported along a 10-lane section of U.S. 101 in Los Angeles County, California.
The data
for this table is also also available in Excel highestaadt1.xls (23kb). For more information,
contact Paul Svercl at email paul.svercl@fhwa.dot.gov or at
202-366-5036.
| Mileage of Principal Arterials With 200,000 Or More AADT |
| Urbanized Area | Route | Miles | Highest AADT |
| New York | I-95 | 4.11 | 297,700 |
| SR-495 | 1.64 | 218,438 | |
| SR-907 | 1.38 | 201,082 | |
| SR-908 | 1.33 | 203,481 | |
| Parkway | 14.39 | 231,193 | |
| Los Angeles | I-5 | 60.34 | 365,852 |
| I-10 | 49.30 | 312,802 | |
| I-105 | 8.37 | 227,629 | |
| I-110 | 12.64 | 292,924 | |
| I-210 | 13.26 | 266,696 | |
| I-405 | 71.84 | 351,610 | |
| I-605 | 17.41 | 280,886 | |
| I-710 | 10.22 | 229,608 | |
| US-101 | 26.88 | 320,283 | |
| SR-22 | 7.00 | 201,521 | |
| SR-55 | 11.82 | 270,610 | |
| SR-57 | 10.48 | 261,717 | |
| SR-60 | 27.54 | 300,275 | |
| SR-91 | 24.69 | 275,177 | |
| SR-110 | 2.27 | 305,915 | |
| SR-134 | 3.30 | 226,624 | |
| Chicago | I-90 | 14.22 | 330,286 |
| I-290 | 6.39 | 241,292 | |
| San Francisco-Oakland | I-80 | 5.35 | 269,472 |
| I-280 | 1.60 | 223,129 | |
| I-580 | 5.40 | 261,000 | |
| I-680 | 2.86 | 240,000 | |
| I-880 | 21.38 | 258,000 | |
| I-980 | 1.85 | 200,500 | |
| US-101 | 24.93 | 319,594 | |
| Boston | I-93 | 2.32 | 203,771 |
| Washington | I-95 | 7.62 | 310,703 |
| I-270 | 4.35 | 232,350 | |
| I-395 | 0.58 | 250,000 | |
| I-495 | 15.44 | 260,497 | |
| Minneapolis-St Paul | I-35W | 0.14 | 210,000 |
| Houston | I-45 | 14.83 | 259,480 |
| I-610 | 5.28 | 255,360 | |
| US-59 | 12.22 | 317,394 | |
| US-290 | 3.28 | 212,600 | |
| Seattle | I-5 | 18.66 | 273,183 |
| I-405 | 3.73 | 215,773 | |
| Miami-Hialeah | I-95 | 14.03 | 287,000 |
| SR-826 | 2.99 | 213,000 | |
| San Diego | I-5 | 14.46 | 239,250 |
| I-8 | 12.26 | 286,189 | |
| I-15 | 14.85 | 267,742 | |
| I-805 | 11.57 | 226,536 | |
| Denver | I-25 | 6.27 | 243,309 |
| Atlanta | I-20 | 0.65 | 205,600 |
| I-75 | 18.21 | 334,700 | |
| I-85 | 11.45 | 296,400 | |
| I-285 | 17.29 | 260,600 | |
| SR-400 | 5.09 | 205,000 | |
| San Jose | I-280 | 3.00 | 230,004 |
| US-101 | 4.50 | 231,203 | |
| Phoenix | I-10 | 12.31 | 265,202 |
| I-17 | 7.05 | 216,473 | |
| SR-202 | 1.01 | 212,963 | |
| Sacramento | I-80 | 1.72 | 206,000 |
| I-305 | 2.48 | 236,582 | |
| US-50 | 5.34 | 201,000 | |
| Riverside-San Bernardino | SR-91 | 8.41 | 220,245 |
| Honolulu | I-H1 | 3.46 | 216,966 |
| Fort Lauderdale-Hollywood | I-95 | 21.55 | 303,000 |
| -Pompano Beach | |||
| El Paso | I-10 | 0.48 | 200,810 |
| Austin | I-35W | 2.31 | 201,259 |
| Las Vegas | I-15 | 5.51 | 229,500 |
| San Juan | PRI-1 | 1.35 | 227,300 |
| PRI-3 | 0.87 | 222,900 | |
| Dallas-Fort Worth | I-35E | 7.31 | 232,440 |
| I-635 | 8.95 | 257,751 |
| AADT - Annual Average Daily Traffic |
| I - Interstate (E - East, W - West) |
| US - United States |
| SR - State Route |
SOURCE: Office of Highway
Policy Information,
Federal Highway Administration
https://www.fhwa.dot.gov/policy/ohpi/
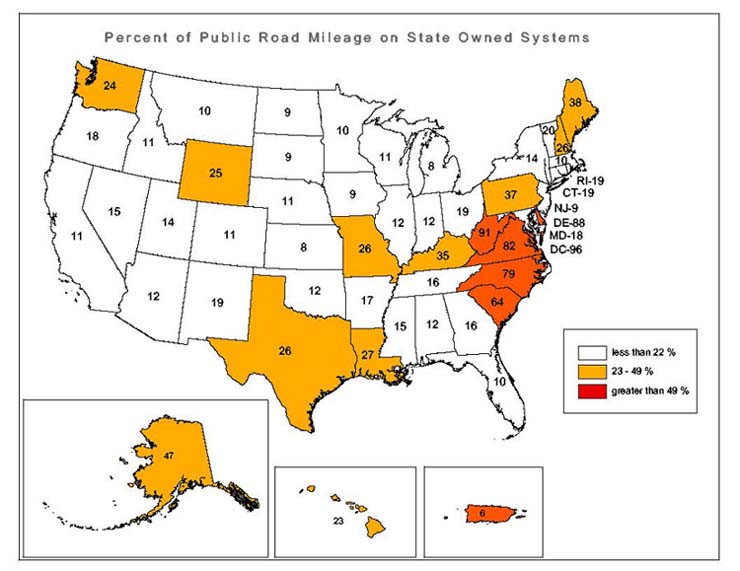
State-Owned Public Roads Increase
Nearly 4 million miles of public roads exist today in the United States. About 20 percent of these public roads are owned by the State highway agencies, another 1 percent by other State agencies, 45 percent by counties, 13 percent by town/townships, 18 percent by municipalities, 3 percent by Federal agencies, and less than 1 percent by other local governments, Tribal Nations and other instrumentalities combined. State ownership has increased from nearly 802,000 miles in 1990 to almost 813,000 miles in 2000.
The percentage of total public roads that were State-owned varies throughout the Nation as shown in the First Figure. The highest State ownership of public roads includes the District of Columbia (96%), West Virginia (91%), Delaware (88%), Virginia (82%), North Carolina (79%), and South Carolina (64%). Most of these States acquired much of this mileage from the local governments during the depression of the 1930's. From 1990 to 2000, about 16 States have gradually reduced their amount of owned mileage.
The data for this table is also also available in Excel owngov1.xls (23kb).
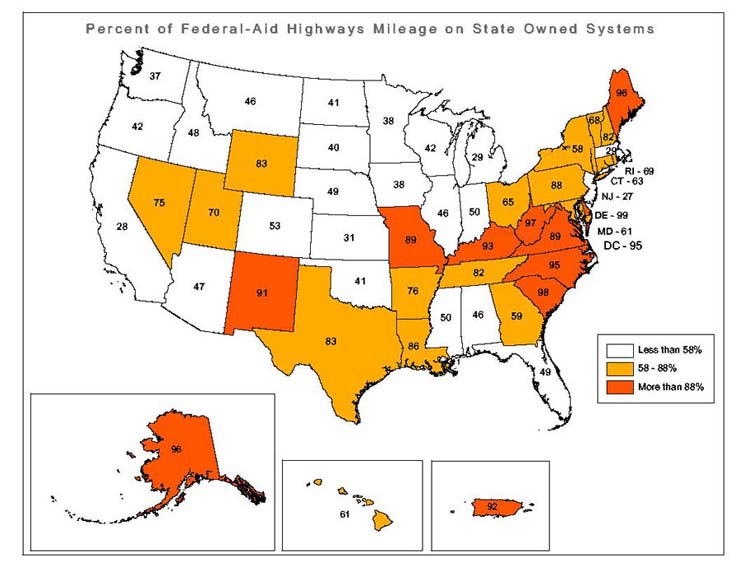
About 24 percent of total public roads (nearly 960,000 miles) are Federal-Aid Highways (i.e., sections that are part of the National Highway System and other arterial and collector functional systems, excluding rural minor collector). State ownership of Federal-Aid Highways averages 58 percent nationally, but varies widely by State as shown in the Second Figure. The highest State ownership of Federal-Aid Highways includes Delaware (99%), South Carolina (98%), West Virginia (97%), Alaska (96%), Maine (96%), District of Columbia (95%), North Carolina (95%), Kentucky (93%), Puerto Rico (92%), New Mexico (91%), and Missouri (89%).
T he data for this table is also also available in Excel owngov1.xls (24kb).
For additional information, contact Paul Svercl at 202-366-5036 or paul.svercl@fhwa.dot.gov.
Highway Statistics Seminar - November 6-8, 2001:
The annual Highway Statistics Seminar of the Office of Highway Policy Information was held on November 6-8 at the Crystal City Marriott in Arlington, Virginia. Over 60 participants from various State DOT's and FHWA field offices attended. The review and discussion of Highway Statistics reporting covered all major data series, including Highway Finance, Vehicle and Driver registrations, Motor Fuel, Mileage and Highway Performance, Travel and Travel Characteristics and Surveys, as well as Traffic Volume and Truck Weight. Improving data quality was the major theme, along with updated data reporting requirements.
A special Panel on Statistical Data Users Perspective was presented by Janet Oakley of AASHTO, Rick Kowalewski of BTS, and Ron Marshall and Ross Crichton of FHWA. Special guest included Alan Pisarski who presented "Transportation" by the Number in the 21st Century. The second panel on "Oversight of State Data Quality Improvements" was presented by Carol Jacoby of FHWA headquarters, and John Rohff of the Kansas FHWA Division Office.
The next Highway Statistics Seminar is scheduled for early November 2002. For more information, contact Sharon Smith at (202) 366-0180.
FHWA Motor-Fuel Workshops in Chicago and Atlanta
FHWA's Office of Highway Policy Information is sponsoring 2 two-day workshops to support Motor-Fuel Oversight of State-reported motor-fuel data. These workshops are as follows:
TEA-21 legislation made motor-fuel data/Highway Trust Fund attribution far more important than ever, with more than $12 billion annually in Federal funds apportioned to the States relying on the motor-fuel factor. Working with its State partners and AASHTO, FHWA initiated a process in May 2001 to improve the oversight process. This process relied on the recommendations of an FHWA field working group (See September 2001 web version at: https://www.fhwa.dot.gov/ohim/hiqsep01.htm under FHWA Motor-Fuel Oversight to Begin in FY 2002.
About 40 State and FHWA staff attended each oversight workshop. The workshops provided a "refresher" on Continuous Process Improvement as a technique to conduct oversight reviews. Pilot States (Kansas, New York, North Carolina, and Washington) shared their experiences and lessons learned in conducting FHWA oversight reviews of State-reported motor-fuel data in co-operation with the States.
"Breakout" groups comprised of State and FHWA staff discussed and reported out the "best" ways to approach oversight. FHWA division office has primary oversight responsibility for overseeing motor-fuel data. Further, by September 30, 2002 each FHWA division has been asked to complete an initial in-depth review of its State's process for compiling and submitting motor-fuel data to FHWA. Based on results of the initial in-depth review, each division would develop an oversight plan and annual report of activities.
These Chicago and Atlanta workshops are intended to provide needed training and perspectives to make sure that FHWA oversight reviews provide independent verification of State-reported motor-fuel data.
For more information, contact Ralph Erickson at (202) 366-9235 or email Ralph.Erickson@fhwa.dot.gov.
GIS Internet Application for Displaying Traffic Data
The Illinois Department of Transportation has completed a project that moves all Volume and Truck average daily traffic counts (ADT) to a GIS application on the Internet. Since the implementation of the GIS Internet application, requests for traffic data have been routed to the Internet. As more repeat users of traffic data become aware of the application, resources previously used answering calls and producing traffic maps within IDOT will be available for other purposes.
This application provides a point and click method for retrieving traffic counts via the Internet. Users of traffic data can access the Internet application from IDOT's home page www.dot.state.il.us by clicking the "Getting Around" button. Under the "MAPS" topic on the top right, the first selection is for the "Average Daily Traffic Counts (ADT)". Clicking on that line will bring up the ADT application. This application will display most current and complete ADT information than currently available through the use of paper traffic maps.
If you have any questions on the operation of the application, or any other comments, call Rob Robinson at IDOT's Office of Planning and Programming at (217) 785-2353 or email robinsonre@nt.dot.state.il.us.
HPMS Notes
HPMS Submittal Software
A new version of the HPMS Submittal Software will be sent to the States in March 2002; it will incorporate revised capacity related procedures that are consistent with the Highway Capacity Manual (HCM) 2000. The new procedures must be used to report the 2001 HPMS data due in June 2002. For further information, contact Beverly Harrison at 202-366-4048 or by e-mail at beverly.harrison@fhwa.dot.gov.
HPMS and Census Urbanized Area boundaries
Revised boundaries for Census urbanized areas resulting from the 2000 Census will not be available until the spring of 2002. Existing Federal-aid urbanized and small urban area boundaries should be used to report the 2001 HPMS data due in June 2002. Population numbers for rural, small urban and individual urbanized areas should be developed from the Census estimate of State population as of July 1, 2001 in accordance with standard reporting practice cited on page III-2 of the HPMS Field Manual. FHWA has delayed a decision on how the Census boundaries will be used in the future until after the Census has published the new boundaries and FHWA has had a chance to assess their impacts. For further information, contact Paul Svercl at 202-366-5036 or by e-mail at paul.svercl@fhwa.dot.gov.
OHPI Home | Highway Information Newsletters