Highway Information Quarterly Newsletter
October 2002
![]() Reminder: Please remember to buckle up and drive safely, especially in the upcoming holiday season.
Reminder: Please remember to buckle up and drive safely, especially in the upcoming holiday season.
Office of Highway Policy Information - Federal Highway Administration
Contents
Office of Policy Website Redesign | Who Drives Most/Least by Region? | Status of ITS Traffic Data for HPMS | Highway Finance Notes
This edition is in electronic (web) only format.
 Office of Policy Website Redesign
The Office of Policy is currently reviewing the current website, and redesigning the various Office of Policy web pages to enhance navigation, and to to ensure consistancy between the various office webpages.
The review includes the website of the following organizational elements:
To view the various Office of Policy web pages, go to: https://www.fhwa.dot.gov/policy/index.htm
Please forward comments/suggestions to Bryant.Gross@fhwa.dot.gov.
Who drives Most/Least among US regions? Guest Author: Bob Dunphy: Senior Resident Fellow, Transportation, Urban Land Institute
About the Author: Mr. Dunphy conducts studies on traffic congestion, transit, parking, and their relationship with land use and development and assists in outreach to business and government on development and transportation issues. He is active in national committees of the Institute of Transportation Engineers, chairs the Transportation and Land Development committee of the Transportation Research Board, and is a member of Lambda Alpha International, an honorary land economics society.
Who drives the most and the least among large US regions? According to the latest Highway Statistics 2000, released in February 2002, the gold medal belongs to residents of Houston who logged an average of 37 miles of driving daily for each man, woman, and child, followed closely by Birmingham, Alabama and Atlanta, with 35 and 34, respectively. Other large urban areas in the road warrior category (in descending order) were Indianapolis, (32) Dallas-Fort Worth (31), Austin (31), Charlotte (30), San Antonio (29), Kansas City (29), St. Louis (29), and Jacksonville (28). The top ten list includes all of the four largest regions in Texas-no surprise there-as well as three in the mid west, and three in the south. Surprisingly, none of the presumably car dependent regions in California or anywhere in the West made it to the top. Los Angeles, often considered the car capital of the US, ranked 31th among large urbanized areas. At the other extreme, the lowest level of driving occurred not in the New York City-Northeastern New Jersey area which was second at 15.4 miles per capita - but in the New Orleans area (14.5 miles). Others among the lowest driving list were Philadelphia (19) Las Vegas (19), Miami (19), Buffalo (19), Boston (20), Chicago (20), Milwaukee (21), and Cleveland (21). Most of these are older, industrialized communities, including many of the leading transit cities - New York, Philadelphia, Boston, and Chicago. Two of the traditional "good planning" communities in the northwest, Seattle and Portland-Vancouver, weighed in somewhere in the middle, with an average of 26 and 24 miles traveled per capita daily, respectively. Portland was tied with San Diego and San Jose. Los Angeles and San Francisco were even lower, and just about equal in their driving levels, another surprising finding.
One qualification is that the traffic data measures all travel through the area, including trucks and through trips. David Schrank and Tim Lomax of the Texas Transportation Institute, the authors of the Annual Mobility Report that is the definitive work on congestion in metropolitan areas point out that many of the high driving regions are hubs for interstate highway connections with extensive travel from out of the region, which tends to overstate the travel of the local community. This can be a special problem for smaller regions, with large amounts of through traffic. In addition, it should be noted that the source for this data is state transportation departments, not the U.S. Census, so the density figures may not match those of other sources.
A major distinguishing factor between the high driving and the low driving lists is density. Higher density communities tend to have higher levels of transit, some destinations within walking distance, and lower levels of driving. High regional densities also mean that things are closer together, so driving trips can be shorter. The lowest driving regions have urbanized area densities generally above 3,000 persons per square mile, in contrast to the high driving areas, which are generally at or below 2,000 persons per square mile. The combination of high density and extensive transit service in places like New York/Northeastern New Jersey, Philadelphia, Boston, and Chicago makes it easy to use public transit and walk, and often hard to drive. In contrast, lower densities and lower transit use common in Houston, Atlanta, Indianapolis, and the other high-driving areas make it hard to walk and use transit and relatively easy to drive. Another factor that influences driving is income, with greater prosperity resulting in higher levels of auto ownership and use. Low incomes could explain the low levels of driving in New Orleans, which also had high density and higher transit use, and Buffalo, which had neither. The density figures are consistent with other sources that indicate both Los Angeles and Miami have urbanized area densities that exceed those of New York. Many find it hard to believe that Los Angeles is a high-density region, whose residents drive less than those of the Washington, D.C. area, despite Los Angeles' reputation as a sprawling, low density, freeway capital of the U.S. It is also surprising to find that Las Vegas is a high-density, low driving area. Houston and Atlanta are among the lowest density areas in the list, along with St. Louis, Indianapolis, and Kansas City, which partially explains their high driving levels. An interesting comparison is Austin, Phoenix, and Minneapolis-St. Paul, which had virtually identical densities, a little above 2000 persons per square mile. However, their driving is vastly different. The average resident of the Austin region-including its suburbs-drives 31 miles a day, well above those in Phoenix and Minneapolis.
While there are some obvious explanations for the differences in driving, there appear to be many unique regional factors as well, which require knowledge of the local market. Race and class divisions that artificially separate people geographically can increase driving. So can policies that encourage commercial development for its tax revenues and discourage residential development, creating imbalances between jobs and housing. This data reflects the combined influence of a range of public policies and individual behavior across all jurisdictions in a region. It is intriguing to imagine what would happen if some of these communities could switch places. If Houstonians only drove as much as Los Angelinos, they would have the roads to themselves. For that matter, if people in Houston only drove as much as residents of the Atlanta region, congestion would be vastly improved. Many regions, concerned about congestion and other traffic impacts, are attempting to slow the growth of driving, or even reduce per capita levels. One reason that national trends in driving are likely to exceed population growth is that most of the low driving regions are growing slowly, at best, while, the urbanized areas with the highest levels of driving are booming -places like Atlanta, which has been proclaimed the fastest growing community on earth.
URBANIZED AREAS RANKED BY DRIVING PER CAPITA-2000
Source -- Highway Statistics 2000, USDOT, Federal Highway Administration
| URBANIZED AREA |
STATE |
POPULATION (1,000) |
DENSITY (Persons per Square Mile) |
DRIVING (Miles per Day per Person) |
| Houston | TX |
2,487 |
1,618 |
37
|
| Birmingham | AL |
667 |
1,095 |
35 |
| Atlanta | GA |
2,977 |
1,694 |
34 |
| Indianapolis | IN |
915 |
2,168 |
32 |
| Austin | TX |
641 |
2,041 |
31 |
| Dallas-Fort Worth | TX |
3,746 |
2,188 |
31 |
| Charlotte | NC |
646 |
2,161 |
30 |
| San Antonio | TX |
1,143 |
2,357 |
29 |
| Kansas City | MO |
1,422 |
1,373 |
29 |
| St. Louis | MO |
2,044 |
1,819 |
29 |
| Jacksonville | FL |
869 |
1,711 |
28 |
| Orlando | FL |
1,160 |
2,937 |
28 |
| Cincinnati | OH |
1,176 |
1,867 |
28 |
| Phoenix | AZ |
2,138 |
2,028 |
27 |
| Columbus | OH |
940 |
1,975 |
26 |
| Seattle | WA |
1,994 |
2,363 |
26 |
| Memphis | TN |
919 |
2,188 |
25 |
| Salt Lake City | UT |
830 |
2,351 |
25 |
| Minneapolis-St. Paul | MN |
2,475 |
2,076 |
25 |
| Riverside-San Bernardino | CA |
1,340 |
2,607 |
25 |
| W. Palm Beach-Boca-Delray | FL |
1,041 |
3,391 |
24 |
| Detroit | MI |
3,836 |
2,942 |
24 |
| Oklahoma City | OK |
1,083 |
1,674 |
24 |
| San Deigo | CA |
2,653 |
3,619 |
24 |
| Portland-Vancouver | OR |
1,338 |
2,853 |
24 |
| San Jose | CA |
1,626 |
4,455 |
24 |
| Ft. Lauderdale-Hollywood-Pompano | FL |
1,601 |
4,896 |
23 |
| Norfolk-VA. Beach-Newport News | VA |
1,507 |
1,583 |
23 |
| Washington | DC |
3,617 |
3,621 |
23 |
| Tampa-St. Petersburg-Clearwater | FL |
1,953 |
3,005 |
23 |
| Los Angeles | CA |
12,384 |
5,551 |
23 |
| Pittsburgh | PA |
1,569 |
1,445 |
23 |
| Providence-Pautucket | RI |
907 |
1,761 |
23 |
| San Francisco-Oakland | CA |
4,022 |
3,343 |
22 |
| Denver | CO |
1,993 |
2,768 |
22 |
| Tucson | AZ |
619 |
2,211 |
22 |
| Baltimore | MD |
2,107 |
2,959 |
21 |
| Sacramento | CA |
1,394 |
3,640 |
21 |
| Cleveland | OH |
1,783 |
2,128 |
21 |
| Milwaukee | WI |
1,532 |
2,958 |
21 |
| Chicago-Northwestern Indiana | IL |
7,702 |
2,821 |
21 |
| Boston | MA |
2,917 |
2,563 |
20 |
| Buffalo-Niagara Falls | NY |
1,112 |
1,972 |
19 |
| Las Vegas | NV |
1,256 |
4,652 |
19 |
| Miami-Hialeah | FL |
2,270 |
6,431 |
19 |
| Philadelphia | PA |
4,068 |
3,020 |
19 |
| New York-Northeastern NJ | NY |
17,089 |
4,313 |
15 |
| New Orleans | LA |
1,065 |
3,944 |
15 |
Source of the Data: Highway Statistics 2000 which can be found at www.fhwa.dot.gov/ohim/hs00/index.htm
Status of ITS Traffic Data for HPMS
The FHWA Office of Highway Policy Information has been championing the use of ITS as a traffic data resource. One of the early uses of such data could be in supporting reporting to the HPMS. While there are concerns about incorporating data from ITS detectors into traditional counting programs, they are a tremendous resource for traffic data collection, especially in urban areas where it is difficult to get traffic counts. We recently asked FHWA's Division offices to provide us with the following information about the States' use of ITS traffic data for HPMS reporting:
The Division reports document that one-third of the States are using some ITS traffic detectors to supply HPMS traffic data. It was noted that the number of ITS detectors available was currently limited, but was expected to increase in the future.
Half answered that although ITS existed in their State, it was not an HPMS data source. The most common reason for not yet using ITS traffic detectors for HPMS was that they're still working on it. Other answers were that the data quality was poor or that it's still under consideration.
The full report "Use of ITS for Traffic Monitoring 9/09/2002" is available at the FHWA Travel Monitoring Community of Practice web site under "Reference"
http://knowledge.fhwa.dot.gov/cops/hcx.nsf/home?openform&Group=Travel%20Monitoring
Questions about the findings can be directed to Mr. Ralph Gillmann, 202-366-5042 or Ralph.Gillmann@fhwa.dot.gov.
The Office of Highway Policy Information is hosting a workship for FHWA field and State staff involved in reporting highway finance information (Highway Finance Reporting - Smart Tool and Other Current Issues.) The workshop will be held Tuesday January 28 - Wednesday January 29, 2003 in Arlington, Virginiaat the Holiday Inn, 4610 N. Fairfax Drive, Arlington, Virginia 22203 (Ballston Metro stop on Orange line is the closest stop). States should participate to discuss the following:
To reserve a room, please call the Holiday Inn direct at 703-243-9800, by January 3, 2003; the room rate is $150.00 single, and $160 double. Please ask for DOT:FHWA to receive the special rate.
If you have additional questions, please contact (email) Sharon.Smith@fhwa.dot.gov for registration information (phone 202 366-0180).
HPMS Issues Workshop Held in Chicago
A very successful and well-attended HPMS issues workshop was held on August 27 and 28 in Chicago. The 82 participants from 29 States shared experiences and best practices for improving HPMS data. The format of open discussion of items of interest to the participants interspersed with topic related presentations from States and FHWA worked very well. This provided ample time for discussion and hearing first hand about best practices from states presentations.
The opening session included a brief status report from every state participating, and provided some meaningful insight into their current problems and issues and unique activities. Many states shared similar frustrations and comments on staffing issues, documentation of procedures, timeliness, off state system data collection, Census boundaries, using MPO and ITS data, and management support for data quality.
The timely reporting of quality data session focused on state efforts to verify and assure accuracy of the data by having annual workshop sessions with MPOs, documenting procedures for data flow and responsibilities, and performance measures. The use of mini laptops for field data collection and verification activities is an innovative approach being tried by several states. The advantages of mini laptops over PDAs and laptops were discussed and several states shared their experiences with laptops.
The traffic monitoring session focused on using length based vehicle classification data for the HPMS summary forms, ITS data, and impacts of the new TMG. Pavement data needs focused on equipment problems, complete coverage in urban areas, and quality assurance checks. The software session resulted in suggestions for identifying which data items on the editor screen are rural only or urban only, alternate methods of importing prior years data, and addressing new urbanized areas.
There was some discussion on methods used to estimate local VMT. One unique method being tried was the use of collector system data to estimate local VMT, which showed promising results. Quality control of data provided by other agencies is necessary as many states recognize the value of using other agency data. This is being done by annual training sessions and checking field coding of data items, random checks on field crews, and trend analysis. This should be an important activity as many states are actively pursuing the use of MPO and ITS data to supplement and replace their databases.
Sample adequacy review is an activity that needs to be done as part of each year's submittal and in depth analysis is needed periodically to avoid sample bias and to better manage the sample structure. Unsampled, oversampled, and undersampled volume groups, random selection for revisions, and short section lengths are all important factors to consider in sample adequacy.
The new urban boundaries, which impact functional classification of roadways and sample adequacy, should be incorporated into HPMS as they are established. The information on the Census web site and the Questions and Answers provided by FHWA in recent months are still relevant and should be referred to for further guidance.
The participants were divided into four breakout groups to discuss other issues, offer suggestions for improvements, and recommendations to FHWA. There was lively discussion in these groups, which presented a summary report with the following common themes emerging:
At the closeout session there were some very useful recommendations for future activities focusing on the theme of this workshop: Establishing Best Practices. These were:
Some of the presentations made by States and FHWA at the workshop will be available on the HPMS Community of Practice link, found on the HPMS webpage. For additional details, or if you have any questions on this workshop or the activities discussed, please contact Fred.Orloski@fhwa.dot.gov or call 517-702-1840.
The Office of Highway Policy Information of the Federal Highway Administration (FHWA) is hosting two special workshops for FHWA field and State transportation and revenue staff to discuss "Motor-Fuel/Highway Trust Fund Data - Current Issues." To save time and resources, one meeting will be added in the "East"; the other in the "West". The meetings are as follows:
Workship Place Dates:
Eastern Motor Fuel Workshop: Where: Atlanta, Georgia When: February 5/6, 2003
Western Motor Fuel Workshop: Where: Sacramento, California When: February 18/19, 2003
States should participate in discussion and breakout sessions on the following issues:
Registration information is available from Sheila Moore by (865) 574-8267 or email mooresa@ornl.gov. Interested parties should act as soon as possible because space is limited.
States Using Motor Fuel Smart Tool
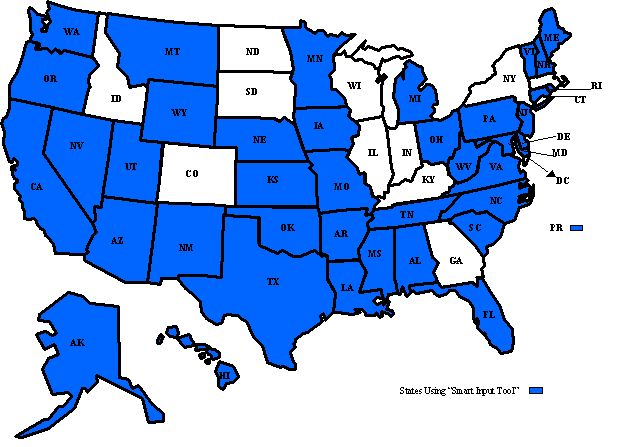
If you need further assistance please email Ralph.Erickson@fhwa.dot.gov or call 202-366-9235, or email Marsha.Reynolds@fhwa.dot.gov, or call 202-366-5029.
OHPI Home | Highway Information Newsletters