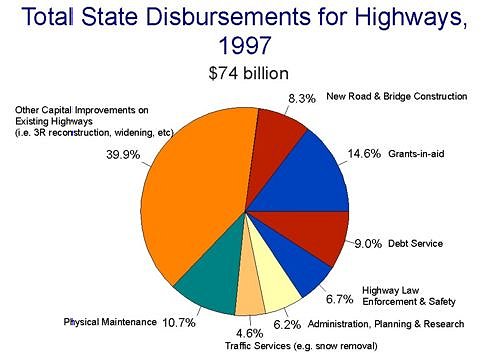
Total State Disbursements for Highways--1997
Recently published information in the Federal Highway Administration's (FHWA) Highway Statistics--1997 shows that States spent about $74 billion for highways, including Federal funds.
The following chart displays the components of the $74 billion in State expenditures for highways: 8.34 percent ($6.17 billion) went for new route and bridge construction; 39.9 percent ($29.55 billion) for other capital improvements on existing highways; 10.7 percent ($7.91 billion)for physical maintenance; 4.6 percent ($3.42 billion) for traffic services; 6.2 percent ($4.57 billion) for administration, planning, and research; 6.7 percent ($4.93 billion) for highway law enforcement and safety; 14.6 percent ($10.81 billion) for grants-in-aid; and 9.0 percent ($6.63 billion) for debt service.
If spending by all levels of government is considered, total highway expenditures
exceeded $100 billion in 1997 for the first time. In Spring 1999, FHWA will
publish its annual Highway Funding Bulletin which will provide additional
highway finance data, including estimates of capital spending for the TEA-21
years of 1998 (partial TEA-21 year) and 1999.
These data are also available at the Office of Highway Policy Information Web site https://www.fhwa.dot.gov/ohim/hs97/hfpage.htm under the State Highway Finance, SF series tables.
For addition information, contact Ralph Erickson, Highway Funding and Motor Fuel Division, at (202) 366-9235.
Annual Highway Information Seminar Held in Washington, D. C.
The Office of Highway Information Management (currently Office of Highway Policy Information) held its annual Highway Information Seminar on November 17-19, 1998, at the Holiday Inn--Capitol in Washington, D.C. The seminar, which was deemed highly successful, attracted 74 representatives from State DOTs, revenue departments, and motor vehicle administration, and FHWA field offices. This 3-day course, targeted to State and FHWA field personnel who are involved in collecting, analyzing, preparing, and submitting highway statistical data, was divided into two phases--lectures and workshops.
It provided an excellent opportunity for FHWA and State personnel to exchange information, discuss individual problem areas, and recommend solutions. The States provided FHWA valuable feedback on field office issues. The agenda included discussions on the various uses of data for policy purposes, i.e., reporting to Congress, apportioning funds, and performance measurement.
Keynote speakers included Frank Moretti of the Road Information Program (TRIP), and David Clawson, from the American Association of State Highway and Transportation Officials (AASHTO). Mr. Moretti spoke on the importance of data for decisionmaking as viewed by national organizations while Mr. Clawson addressed the various uses of highway statistics by national organizations. Mike Weiss, Special Assistant to the FHWA Executive Director, added valuable insight on the information programs and their needs and use by Congress.
For information on the seminar,
contact Juanita Proctor, HPM-30, at 202-366-5047 or E-mail juanita.proctor@fhwa.dot.gov.
FHWA/State Fuel Reporting Group Charts Course
On December 10-11, 1998, in cooperation with the American Association of State Highway and Transportation Officials (AASHTO) and the Federation of Tax Administrators, the Federal Highway Administration (FHWA) met with State representatives and others to begin a cooperative review of its current motor-fuel data reporting structure and related issues. This review is necessary because the Transportation Efficiency Act of the 21st Century (TEA-21) makes greater use of highway information, including State-reported motor fuel consumption and related Highway Trust Fund contributions in apportioning Federal-aid funds to the States. The group, chaired by Nicholas Graf, FHWA North Carolina Division Administrator, includes representatives from 10 States, including Revenue and Transportation Departments, FHWA field and Headquarters staff, and others.
The group heard from Dr. Walter L. Sutton, Jr., FHWA Associate Administrator for Policy, and Dan Corbett, of the Senate Environment and Public Works staff. In its work sessions, the group identified a number of key issues and appointed four subcommittees to develop specific proposals to help improve the quality of the State-reported motor-fuel data. These areas included a survey of State reporting capabilities, State terminology and definitions, State reporting under the International Fuel Tax Agreements (IFTA), and the use of motor-fuel data to attribute Federal Highway Trust Fund receipts to the States. A second meeting of this group is contemplated in 1999.
For additional information, please contact Ralph Erickson, HPM-10, at 202-366-9235, E-mail ralph.erickson@fhwa.dot.gov or Marsha Reynolds, HPM-10, at 202-366-5029, E-mail marsha.reynolds@fhwa.dot.gov.
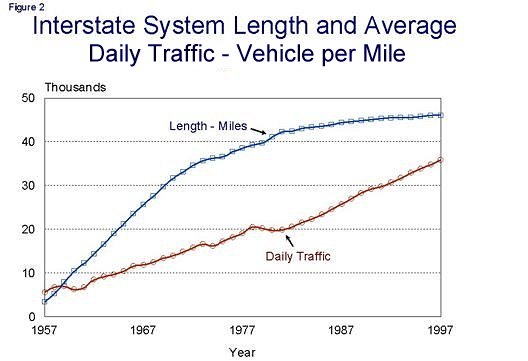
Interstate System Traffic Has Grown Significantly
In 1957, the Interstate System consisted of over 3,000 miles and carried nearly 6,000 daily vehicles per mile (See Figure 2). By 1967, the System increased to almost 26,000 miles and carried nearly 12,000 daily vehicles per mile. Twenty years later, the System represented over 38,000 miles and daily traffic averaged over 19,000 vehicles per mile; by 1997, the System extended over 46,000 miles with daily traffic averaging over 35,000 vehicles per mile. The Interstate System accounts for about 1 percent of the Nation's public road mileage and carries about 23 percent of the travel.
During 1986 to 1996, traffic volumes
on 23 major intercity Interstate System routes of 500 miles or longer increased
an average of 46 percent (see Table 1 for data by route number).
During this same period, traffic on other intercity Interstate System routes
increased 34 percent and on beltways and spurs, by 25 percent. Overall,
the Interstate System traffic grew 41 percent while the Nation's public
roads grew 35 percent.
During the same period, the constructed length of these major intercity
routes grew less than 2 percent (from 31,823 miles to 32,314 miles). Other
intercity routes grew 13 percent (from 8,218 miles to 9,270 miles), while
beltways and spurs grew 18 percent (from 3,995 miles to 4,713 miles). For
more information on this subject, contact Paul Svercl at (202) 366-5036
or E-mail paul.svercl@fhwa.dot.gov.
|
|
|
|
|
|
|
|
|
|
|
|
|
|
|
|
|
|
|
|
|
|
|
|
|
|
|
|
|
|
|
|
|
|
|
|
|
|
|
|
|
|
|
|
|
|
|
|
|
|
|
|
|
|
|
|
|
|
|
|
|
|
|
|
|
|
|
|
|
|
|
|
|
|
|
|
|
|
|
|
|
|
|
|
|
|
|
|
|
|
|
|
|
|
|
|
|
|
|
|
|
|
|
|
|
|
|
|
|
|
|
|
|
|
|
|
|
|
|
|
|
|
|
|
|
|
|
|
|
|
|
|
|
|
|
|
|
|
|
|
|
|
|
|
|
|
|
|
|
|
|
|
|
|
|
|
|
|
|
|
|
|
|
|
|
|
|
|
|
|
|
|
|
|
|
|
|
|
|
|
|
|
|
|
|
|
|
|
|
|
|
|
|
|
|
|
* Includes 35E (136 miles) and 35W (127 miles).
Through a December 1998 letter to a number of its customers and an internal memorandum to FHWA Headquarters and field offices, the Office of Highway Information Management (OHIM) solicited views on the forms and instructions in its Guide to Reporting Highway Statistics, which is now under its triennial periodic review. Several "listening sessions" were held in early January 1999 to discuss customer and data provider issues.
Under the Guide instructions, States report motor-vehicle licensing and registration, motor-fuel consumption, and highway finance income and spending statistical data to FHWA for publication in the annual Highway Statistics report. State and local governments are the principal collectors and preparers of the data used to complete the various forms in the Guide.
The data collected under the Guide are of great assistance to Congress, FHWA, other U.S. DOT and Federal agencies, State and local governments, and various interest groups. The "Status of the Nation's Surface Transportation System: Condition and Performance Report to Congress" (the Needs Report) is one report that relies of these data.
The current version of the Guide is available on OHIM's home page under the Highway Statistics Series secondary page at https://www.fhwa.dot.gov/policyinformation/statistics.cfm. Written comments on Guide instructions are welcome and should be addressed, Attn: Michael Neathery, HPM-10, or E-mail mike.neathery@fhwa.dot.gov.
A Major New Survey, NPTS/ATS 2000, in Planning Stages
The next Nationwide Personal Transportation Survey (NPTS) will begin in the summer of 2000 and will be coordinated with the Bureau of Transportation Statistics American Travel Survey (ATS). The focus of the NPTS is in collecting daily trips, which yields a dataset primarily composed of trips under 30 miles. The ATS, which has historically collected trips of 100 miles or more, will be expanded in 2000 to trips of 30 miles or more. The results of the surveys will be issued as one dataset to facilitate analysis of the full range of personal travel. We are currently in the design phase of the NPTS/ATS 2000 and plan to conduct a large pretest this fall.
States and metropolitan planning organizations (MPOs) may purchase additional or "add-on" samples to obtain a household travel survey for their area. The add-on component of the NPTS grew from 4,000 households in 1990 to 21,000 in 1995, and interest in the 2000 survey has already been expressed by several jurisdictions. The add-on households also provide the origins and destinations of individual trips for use in loading the network and in other elements of the planning process.
The NPTS Transferability Project is also of interest for the urban and statewide planning processes. This project was initiated to determine whether the NPTS data could be useful to those areas that do not have recent household travel survey data. Transferability is a proof of concept project that allows a test of producing data from the NPTS that closely replicates the household travel data collected for that area. Ms. Patricia Hu at Oak Ridge National Laboratory is conducting the transferability demo for FHWA.
For more information on any of these NPTS topics or to provide your input for consideration in planning the NPTS/ATS 2000, please contact Nancy McGuckin, HPM-40, 202-366-8750, E-mail nancy.mcguckin@fhwa.dot.gov or Susan Liss, HPM-40, 202-366-5060, E-mail susan.liss@fhwa.dot.gov.
Archived Data User Service
The main focus of intelligent transportation systems (ITS) on the efficient use of transportation networks and services is dependent on the real-time data that are collected and made available as quickly as possible. However, these data are also valuable for many purposes for Federal, State, and local agencies involved in transportation policy, planning, program assessment, research and related activities. Many new traffic sensors and electronic tags are used with ITS, but the real-time data collected are currently either discarded or left in a raw, highly disaggregated form that few people can use. If such data were archived and made available to others in a manageable form, they would constitute a new source of data which is often richer than current data sources.
A wide range of stakeholders has been found with an interest in multiple uses of data generated by ITS and it has been determined that a new User Service should be included in the National ITS Architecture: the Archived Data User Service (ADUS -- pronounced "add-us"). The report ITS as a Data Resource: Preliminary Requirements for a User Service and an addendum to the ITS Program Plan serve as the basis for revising the National ITS Architecture to incorporate ADUS. [See OHIM webpage]
The ITS Architecture Team, in consultation with a working group of ADUS stakeholders, has begun the process of revising the National ITS Architecture. Updates will appear on the ITS America webpage [www.itsa.org] and comments are welcome from anyone with an interest in ADUS.
For more information, contact Ralph Gillmann, HPM-30, at 202-366-5042, or E-mail ralph.gillmann@fhwa.dot.gov.
There's a new web page that brings together
material related to traffic monitoring:
https://www.fhwa.dot.gov/policy/ohpi/travel/index.htm.
It includes publications such as the latest editions of the Traffic Monitoring
Guide and Traffic Volumes Trends. The proceedings for the North
American Travel Monitoring Exhibition and Conference (Charlotte, North Carolina,
May 1998) are also located there. "What's New," "Contacts,"
and "Related Sites" round out the page.
Also note the new web page https://www.fhwa.dot.gov/ohim/ohimvtis.htm for downloading the latest version of the Vehicle Travel Information System (VTRIS).
Table SF-12A has been improved and expanded compared to the current Table SF-12A published in Highway Statistics--1997. Table SF-12A contains State capital and maitenance expenditures for arterial systems and collectors in rural and urban areas. The improved and expanded version now provides detail for all 17 capital improvements types and maintenance for which States report expenditures to FHWA. The original version of Table SF-12A grouped the improvement types in seven summary categories. For example, "New Construction" included both "New Route" and " Relocation" improvement types. The more detailed information supports analysis of State highway finance. The new table SF-12A may be accessed on the Website "www.fhwa.dot.gov/ohim" under "Highway Statistics" or "What's New." Questions on the new table should be directed to either Ralph Erickson at 202-366-9235, or Long Nguyen, 202-366-9213.
Transportation Research
Board (TRB) Conference,
"Personal Travel: The Long and Short of It"
Scheduled for June 28-July 1, 1999, Swissotel Watergate, Washington,
D.C.
The Nationwide Personal Transportation Survey (NPTS) and the American Travel Survey (ATS), both conducted by the U.S. Department of Transportation, together provide a complete description of personal travel by residents of the United States. These surveys include information on the continuum of personal travel, and allow analysis of a broad spectrum of topics. This TRB conference presents a unique forum to describe the full spectrum of personal travel. Over 30 papers will be presented using the 1995 datasets, and current plans and recommendations for improvements for the 2000 surveys will be discussed. Brad Edmondson, former Editor of American Demographics will provide the keynote address, and Martin Wachs, Director of the University of California Transportation Center, will be a luncheon speaker.
The conference registration fee of $175 is due by May 26, 1999, and $275 after that date. The meeting will be held at Swissotel Washington-The Watergate Hotel in Washington, D.C. Guest room rates are $110, single and double, plus 13 percent sales tax.
For more information, contact: Tom Palmerlee, TRB, at (202) 334-2907, E-mail tpalmerl@nas.edu or Nancy McGuckin, Federal Highway Administration, at (202) 366-8750, or E-mail nancy.mcguckin@fhwa.dot.gov.