| |
|
| |
|
Highway Information Quarterly Newsletter
September 2000

Office of Highway Policy Information
Our Nation's Highways -Selected Facts and Figures
 |
The newly available Our Nation's Highways provides charts, graphs and summaries of data on a variety of topics including: air quality, the U.S. vehicle fleet, licensed drivers, the highway system and its condition and performance, the National Highway System, motor fuel use, travel, and financing of our highways. The publication utilizes data submitted from the States which is published as detailed tabulation in the annual Highway Statistics Series, and also uses information from a wide variety of public and private organizations. Our Nation's Highways can be found online at: https://www.fhwa.dot.gov/ohim/onh.htm. If you have any questions about this publication, or would like a hard copy, call (202) 366-0160. |
US DOT Releases Conditions and Performance Report

The US Department of Transportation's Condition and Performance Report: 1999 Status of the Nation's Highways, Bridges, and Transit, is a biennial report to Congress that provides information on the physical and operating characteristics and future investment needs of the highway, bridge and transit segments of the nation's surface transportation system. The latest report was transmitted to Congress in May 2000. Much of the basic data for the report are derived from OHPI's Highway Performance and Monitoring System (HPMS), and State and local finance reported by the States in accordance with FHWA's Guide for Reporting Highway Statistics. It also relied extensively on data and analyses from the 1995 Nationwide Personal Travel Survey (NPTS).
Report highlights include:
Copies of the report can be obtained by calling toll-free 1-800-240-5674, or in the Washington, D.C. area, (202) 366-9899. The report is also available on the web at: https://www.fhwa.dot.gov/policy/1999cpr/
Highway Finance Re-assessment News Briefs
In July 1999, FHWA's Office of Highway Policy Information began a comprehensive reassessment of its highway finance reporting series, including both State and local finance and Federal highway finance reporting (FA-series, SF-series, and LF-series). These data are published annually in the Federal Highway Administration's (FHWA's) Highway Statistics publication and have a number of key uses. Steady progress has been made on a number of items:
OHPI is also advancing soft-ware that will improve its own analyses of the State-reported highway finance data and ultimately help States report higher quality data. As a first step, FHWA is converting its soft-ware from LOTUS 1-2-3 to EXCEL. This conversion will give FHWA more analytical capacity and bring FHWA's soft-ware into better alignment with State reporting. In the future, "smart forms" for reporting as well as data bases that can be more easily related to one another will be developed.
HPMS Computer Based Training Update
The Office of Highway Policy Information with cooperation and funding from the National Highway Institute (NHI) and twenty State DOTs has contracted Cambridge Systematics to develop an HPMS Computer Based Training (CBT) CD ROM. The HPMS CBT will instruct users on the proper coding of HPMS data items as well present information and instruction on HPMS Sample Management.
In the HPMS data coding portion, the user follows two data collectors as they attend office training where an instructor describes each data item, discusses relations between data items, and provides interactive exercises on collection and coding of data items. The user also follows the data collectors into the field where photos, instructions, and exercises are again used to demonstrate the proper collection and coding of the data.
The sample management portion uses a similar format to describe the HPMS use of data sampling to provide information for all roads within a State without actually collecting data for all roads. This portion discusses the theory behind statistical sampling as well providing instruction on how to develop a sample panel for individual States.
To date, a prototype of the CBT has been developed which shows the look and feel of the software. Additionally, a review of the first of three story boards was recently completed with a review of the second in September and the third later this year. After this, the audio portion will be recorded and combined with graphics and photos for a finished product to be completed in April 2001. For more information contact Russ Robertson at 202-366-5048 or e-mail at russell.robertson@fhwa.dot.gov.
Updated HPMS Catalog of New Technology and Techniques
In September 1998, the Highway Systems Performance Division (HPPI-20) published the Highway Performance Monitoring System Catalog of New Technology and Techniques (publication No. FHWA-PL-98-045) as a result of the HPMS reassessment activities. We are announcing an update to Part II of the catalog which is posted along with the original on the Office of Highway Policy Information website at: https://www.fhwa.dot.gov/ohim/catalogr.pdf.
The catalog is intended to be a means of distributing and sharing technical information regarding HPMS data collection techniques and usage among the HPMS data community. The entries in the catalog were submitted by the States and contain information related to field data collection techniques, GIS/GPS applications for data collection integration and presentation, other data integration and presentation techniques, automated data collection equipment (including pavement characteristics and condition, traffic/travel, and congestion), and private data sources and privatization of data collection. The catalog may just provide some useful information that you were looking for. Check it out!
For additional information or if your State/MPO would like to add to the catalog, contact Robert Rozycki, (202) 366-5059, e-mail robert.rozycki@fhwa.dot.gov.
Motor-Fuel/Highway Trust Fund Attribution News Briefs
FHWA continued progress in its motor-fuel reporting re-assessment effort. Motor-fuel and motor-fuel based highway trust fund receipts are major TEA-21 formula factors, with about $13 billion annually distributed to the States using these factors. With its February 2000 Denver workshop, FHWA's concluded its motor-fuel re-assessment outreach efforts. In total, more than 100 participants from State transportation agencies, revenue agencies, and others attended workshops held in Atlanta (December 1999), Philadelphia ( January 2000), or the Denver workshop.
Motor Fuel and Travel Demand
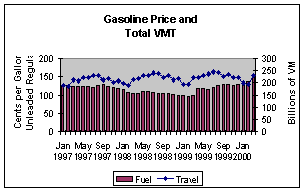
Since January 1997, prices of motor-fuel have been more variable than travel demand. The first graph shows the price of regular unleaded motor gasoline to users in 85 urban areas and total vehicle miles of travel (VMT) from January 1997 to March 2000. The following compares the percent change from the previous January for price of gasoline and for total VMT


Change in % from previous January
|
Price
|
Total
VMT
|
|
| January 1998 |
-10.3
|
+4.5
|
| January 1999 |
-14.1
|
-
1.7
|
| January 2000 |
+33.85
|
+2.94
|
By March 2000, the price of regular unleaded motor gasoline was 55.5% higher than March 1999, while travel had increased about 3.2 percent.
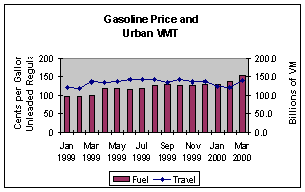
The second graph shows that urban travel had increases a little more than 2% on average in early 2000 in spite of sharply rising prices.
The Energy Information Administration is the source of the price data (http://www.eia.doe.gov); FHWA's Traffic Volume Trends report (https://www.fhwa.dot.gov/policyinformation/travel_monitoring/tvt.cfm) is the source of the vehicle miles of travel data. OHPI intends to make other relevant data comparisons and welcomes feedback and suggestions.
The Full Continuum of Travel: The NPTS/ATS 2000 Surveys
 |
The Nation's investment in its transportation infrastructure has led to the United States being the world's most mobile nation. Future investments will assure that the infrastructure is effectively managed. These investments will focus on promoting safety, as well as enhancing and encouraging innovative technologies to provide better use of the existing system. The challenge for transportation programs in the next century is to better understand and respond to the transportation needs of the American public. |
In the year 2000, the Nationwide Personal Transportation Survey and the American Travel Survey are re-evaluating traditional ways of looking at travel. This joint FHWA and BTS initiative is an attempt to provide a glimpse of the continuum of travel–from trips across the country to trips around the block. The surveys will obtain complete estimates of vehicle and person miles of travel, a more robust sample of trips, and a more accurate reflection of travel behavior within each sampled household.
At one end of the continuum, we have defined long distance trips as those of fifty-miles or more from home. This definition will be extremely useful for looking at corridor travel, long commutes, longer shopping trips, and weekend jaunts. While we are collecting travel by all modes, for shorter trips, we are collecting more detail on the frequency of walk and bike since these are of special interest in assessing policies related to auto and transit use, land use planning, air quality, and public health.
The NPTS/ATS 2000 pretest will tell us how we can most effectively combine two large transportation survey efforts. A significant challenge will be to assure adequate response rates. The NPTS/ATS pretest included the use of telephone surveys which have been used as a cost-effective means of contacting household members. Unfortunately, telephone usage has been tarnished by a decade of aggressive telemarketing that has encouraged people to screen their calls. In addition, home voice lines are used for multiple purposes, for instance computer modems, which adds to the difficulty of getting through.
Once contacted, people drop out of the interviewing process because of the multiple contacts it takes to complete a survey–a respondent has to be home when called, be willing to participate by having everyone in the household fill out a travel diary on the designated day, and then each household member must complete the travel interview. Research has shown that those first few minutes on the phone are critical to increasing people's interest in being part of the surveys.
Looking to the future we will be collecting information about occupation, including multiple jobs, immigration status, Internet use, cell phones, and multiple lines. Some of these data will help us understand telecommuting behavior, and the effect it may have on travel. Other data items help us understand travel behavior in niche markets, such as travel by people who have recently immigrated to the U.S., who are an important segment of transit users.
Highway Information Seminar & VTRIS/TVT Workshop
The Office of Highway Policy Information will be holding its annual Highway Information Seminar on November 14-16, 2000, at the Holiday Inn-Capitol in Washington, D.C. The Vehicle Travel Information System (VTRIS) & Traffic Volume Trend (TVT) workshop will be held at DOT Headquarters on Monday, November 13. A request for nominees went out to FHWA field offices on June 29. All participants who have received acceptance letters and are planning to stay at the Holiday Inn are reminded to make their arrangements directly with the hotel by October 1 and to identify themselves as being with the DOT/FHWA Highway Information Seminar to receive the special rate. Reservations received after that date will be provided on a space-available basis.
Questions concerning the course and workshop, please contact David L. Jones directly at 202-366-5053, or e-mail David.L.Jones@fhwa.dot.gov.