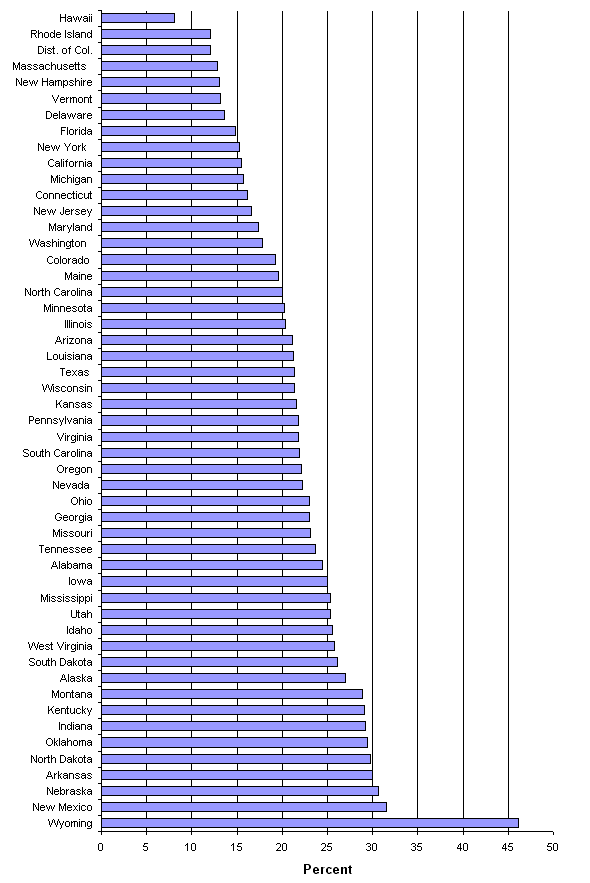
| Highway Statistics 2000 | OHPI > Highway Statistics > 2000 > Motor Fuel > Special Fuel Chart |

| State | Percent |
|---|---|
| Hawaii | 8.09 |
| Rhode Island | 12.04 |
| Dist. of Col. | 12.06 |
| Massachusetts | 12.83 |
| New Hampshire | 13.09 |
| Vermont | 13.17 |
| Delaware | 13.58 |
| Florida | 14.79 |
| New York | 15.25 |
| California | 15.50 |
| Michigan | 15.75 |
| Connecticut | 16.19 |
| New Jersey | 16.56 |
| Maryland | 17.34 |
| Washington | 17.78 |
| Colorado | 19.22 |
| Maine | 19.61 |
| North Carolina | 20.06 |
| Minnesota | 20.25 |
| Illinois | 20.35 |
| Arizona | 21.09 |
| Louisiana | 21.22 |
| Texas | 21.31 |
| Wisconsin | 21.37 |
| Kansas | 21.57 |
| Pennsylvania | 21.74 |
| Virginia | 21.75 |
| South Carolina | 21.90 |
| Oregon | 22.10 |
| Nevada | 22.23 |
| Ohio | 22.98 |
| Georgia | 23.05 |
| Missouri | 23.15 |
| Tennessee | 23.69 |
| Alabama | 24.44 |
| Iowa | 25.04 |
| Mississippi | 25.30 |
| Utah | 25.38 |
| Idaho | 25.50 |
| West Virginia | 25.77 |
| South Dakota | 26.15 |
| Alaska | 26.96 |
| Montana | 28.85 |
| Kentucky | 29.10 |
| Indiana | 29.21 |
| Oklahoma | 29.41 |
| North Dakota | 29.79 |
| Arkansas | 29.99 |
| Nebraska | 30.65 |
| New Mexico | 31.55 |
| Wyoming | 46.08 |
This chart is also availible for download in the following format:
To view PDF files, you need the Acrobat® Reader®.
OHPI Home | Highway Statistics 2000 | Data Feedback