WASHINGTON, D.C. · (202) 366-0180 Project Improvement Type Data Enhanced in Highway Statistics--1995 Publication and Assist in Improved AnalysesBeginning with Fiscal Management Information System (FMIS) data in Highway Statistics--1995, the Federal Highway Administration is now providing more detailed financial information on Federal-aid Highway projects by FMIS improvement type for reconstruction projects. Reconstruction information for Federal-aid projects is now available for "reconstruction-added capacity" and "reconstruction-no added capacity." Previously, Federal obligation data had only been available for a single "reconstruction" improvement type which included all reconstruction projects. The current definitions in FHWA's FMIS for "reconstruction-added capacity" include projects with added full lane capacity on existing alignment of an existing route where old pavement structure is removed and replaced, and where additional continuous through lanes are added through widening and dualizing, as well as certain other reconstruction projects. The definition for "reconstruction-no added capacity" includes projects with no full lane capacity reconstruction on existing alignment of an existing route where the old pavement structure is removed and replaced, with no through capacity additions, and certain other projects. Table FA-10, " Obligation of Federal-aid Highway Funds for Highway Improvements Fiscal Year 1995" ( Revised January 1997--see Highway Statistics--1995 errata sheets dated January 10,1997), reflects more detailed improvement type information for reconstruction obligations on new start projects authorized in Federal Fiscal Year (FY) 1995. (Table FA-10 also shows Federal obligations by improvement type for all major improvement types for new start projects.) The financial data from Table FA-10 Highway Statistics -- 1995 and later data for 1996 show that reconstruction obligations for new start projects (FMIS Step Code 4) are as follows (in thousands):
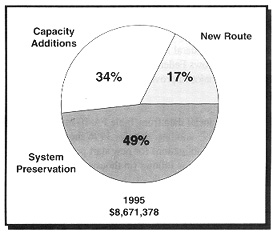
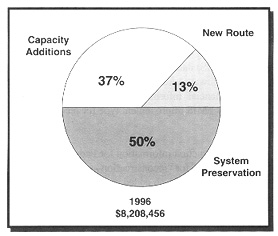
Also, as a result of this FMIS change, more detailed and accurate estimates of Federal financing of "system preservation" and "capacity additions" can also be developed. The chart, "Obligations of Federal Funds for Roadway Projects Under Way," (FMIS Step Code 6) published in Highway Statistics--1995, relies on FMIS improvement-type data, including "reconstruction" to show Federal obligations for "system preservation," "capacity additions," and "new routes." That chart shown on page IV-41 of Highway Statistics--1995 is based on the actual "reconstruction" data split between "reconstruction--added capacity" and "reconstruction--no added capacity." Previously, this "reconstruction" information has been estimated. "System preservation" and "capacity additions" are summary groupings of FMIS or improvement types reported by the States under the Guide to Reporting Highway Statistics. Information and analyses in the "Status of the Nation's Surface Transportation System: Conditions and Performance," and Highway Statistics use this "system preservation" and "capacity addition" grouping. Currently, capacity additions include "relocation," "major widening," and "reconstruction--added capacity." "System preservation" includes "minor widening," "restoration and rehabilitation," "resurfacing," and "reconstruction--no added capacity." The portion of reconstruction obligations for reconstruction 1991-1994, also shown on that chart, is estimated based on new detail from 1995 data. The financial data from the chart on page IV-41 of Highway Statistics -- 1995 and later data for 1996 show capacity additions, system preservation, and new routes for projects underway (FMIS Step Code 6) are as follows (in thousands):
For additional information on the use of Table FA-10 or any other FA-series table, contact Leonard Goldberg of FHWA’s Office of Highway Information Management at (202) 366-5024. For information on FHWA’s FMIS programs, contact Ms. Minnie Baskerville at (202) 366-2853. Our Nation’s Highways Selected Facts and FiguresOne of the Office of Highway Information Management’s most popular publications is slated for update this year--Our Nation’s Highways Selected Facts and Figures. This is an informative booklet of trend data that addresses most areas of highway information and presents it in easy to read charts and graphs. Comments have been solicited from a variety of the publication’s users, and work is in progress to have this pamphlet updated with 1995 data by late spring or early summer. We plan to also add this publication to the Internet under the OHIM URL. For more information on this publication, please contact Mary K. Teets at (202) 366-9211 or Email--Mary.Teets@fhwa.dot.gov.
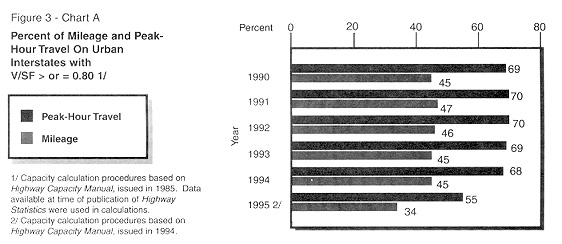
Urban Interstate Congestion TrendsThe revised Highway Capacity Manual (HCM), issued in 1994, changed capacity calculation procedures which are used in calculating the volume-service flow (v/sf) ratio. The changed procedures generally reduced the peak-hour v/sf ratio. The lower v/sf ratio reduced the number of urban Interstate sections operating at or near saturated flow during the peak hour of travel. Data in Chart A reflect peak-hour v/sf trends as published in Highway Statistics 1995. This chart uses updated capacity calculation procedures for 1995 based on the HCM, issued in 1994, while the data for 1990-1994 reflect capacity procedures based on the HCM issued in 1985. This discontinuity resulted in difficulty in making trend comparisons for the period. Chart B reflects recalculated data using the new capacity calculation procedures instituted in the Highway Performance Monitoring System reporting process for all 6 years. By recalculating the data for 1990 - 1994, comparisons between 1995 and previous years can be made. Based on the revised calculations, the peak hour v/sf ratio shows that a high of approximately 53 percent of urban Interstate sections were operating at or near saturated flow during the peak hour of travel. That is compared to a high of approximately 70 percent using the old capacity calculation procedures. Both charts reflect similar stable trends for the 6-year period. For additional information, please contact Janet Tierney, HPM-20, at (202) 366-5021.
Meetings of the Management Committee of COST-323--Brussels, BelgiumIn January, Ralph Gillmann of the Travel Monitoring Division attended meetings in Brussels, Belgium, of the Management Committee of COST-323, which stands for European Cooperation in the Field of Scientific and Technical Research. This committee is conducting tests of weigh-in-motion (WIM) equipment. The committee is also finishing up a report on tests conducted in Zurich, Switzerland, in 1993-1995. Other tests are being conducted in France. In addition, the WIM systems will be installed next June in Sweden for cold-weather testing. Mr. Gillmann presented information concerning activities in the United States, including the National Vehicle Detector Test Center and the Traffic Data Editing Procedures pooled-fund projects. We intend to keep in contact with these European activities and share results. For additional information, contact Ralph Gillmann at (202) 366-5042.
NPTS Customer Survey ResultsTo better understand the uses of the Nationwide Personal Transportation Survey (NPTS) data and the needs of its users, a Customer Questionnaire was distributed by the Office of Highway Information Management. The results regarding how the NPTS data were used were categorized into five areas:
As indicated, most of the uses of the NPTS data were for research and report writing, which accounts for over half. This includes cross-tabulations, projections, newsletter articles, and other related uses and activities. Using the NPTS as library and general reference materials accounted for 16 percent. Travel Demand Modeling and Forecasting accounted for approximately 11 percent, with such activities as intercity travel forecasting and calibrating auto availability portion of travel forecasting models as just a few examples. Many legislative policy and planning efforts have utilized the NPTS as a source for transportation planning efforts, planning studies such as the study of ridesharing, biking and pedestrian issues, etc. Other uses of the NPTS included teaching and as classroom material, which accounted for approximately 9 percent. Other specific examples of how the NPTS has been used included using the NPTS for a State Energy Master Plan, Greenhouse Car Emission Action Plan, Intermodal Task Force effort, and comparison of regional data trends with national data trends. The 1995 NPTS dataset will have more detail than past surveys. Improvements on the 1995 NPTS include the following: use of a travel diary for collecting travel day data, land use at the residence, customer service data, seat belt usage, use of odometer readings, driver information, and improved questions on worker status. For more information, contact Bryant Gross at (202) 366-5026. First 6 Months of Nationwide Personal Transportation Data Show Little Change in Vehicle Ownership DataData from the first 6 months of the 1995 Nationwide Personal Transportation Survey (NPTS) show that American households now average 1.03 vehicles per driver. After a sharp increase in the seventies, from .7 vehicles per driver in 1969, this figure leveled off through the eighties and nineties to about one vehicle per driver. (Figure 5) During the period from 1969 through 1995, the number of households that had more than one vehicle (Figure 6) followed this same trend, with a big increase in the seventies when, for the first time, half of households owned more than one vehicle. This is followed by only modest increases in the eighties, from 51 percent in 1977 to 58 percent in 1990, and 59 percent in 1995. This pattern is repeated again for households that own three or more vehicles, except that the curve is flat for the 1990-1995 period. In contrast, while the percentage of households that have no vehicles at all dropped from 21 percent to 8 percent between 1969 and 1995, the change in the seventies is not so pronounced. The decrease is steadier through 1990, from 21 percent to 9 percent, followed by a very slight decrease to 8 percent in 1995. The percentage of one-vehicle households is essentially flat between 1977 and 1995, at between 33 and 35 percent. While absorbing the households that have newly acquired first cars, this grouping is losing the slightly increasing percentages that own multiple vehicles.

Predictably, the 8 percent of households that do not own vehicles are disproportionately in the lowest income groups (Figure 7). In households with annual income of less than $10,000, the first 6 months of the 1995 NPTS data show that 32 percent have no vehicles; however, 51 percent of these very low-income households have one vehicle and 16 percent have more than one. This compares to households with annual income of $20,000 and more in which less than 4 percent have no vehicles and well over 50 percent have more than one. For households with over $40,000 annual income, this trend becomes more pronounced. The most notable aspects of these data are the lack of change in vehicle ownership between 1990 and 1995 and the rather large percentage of even low-income households that own vehicles. Clearly, one vehicle per driver is remaining the norm for most Americans. For more information on the NPTS interim data, contact Carol Harbaugh at (202) 366-0076.


Treasury Revision Impacts Highway Statistics and 1997 Highway FundsIn a January 10, 1997, memorandum to data users, FHWA revised HF, FE, and FA series tables in the Highway Statistics-1995 to reflect U.S. Treasury Department’s December 1996 restatement of FY 1995 Federal Highway Trust Fund (HTF) receipts. The revised tables are:
The tables initially published in the annual Highway Statistics--1995 publication were based on the Treasury HTF income which was overstated by approximately $1.59 billion due to an error in reconciling estimated 1994 HTF receipts to actual tax collections. The U.S. Treasury Department’s December 1996 restatements revised both FY 1994 and FY 1995 HTF receipt statements to credit the $1.59 billion to FY 1994 and reduce FY 1995 correspondingly. Since 1982, the attribution of HTF receipts to State highway users has been a factor in determining the amount of Federal-aid highway apportionments States receive. Currently, the estimation of HTF receipts attributable to highway users in each State is part of the calculation of three of the equity adjustment provisions of the Intermodal Surface Transportation Efficiency Act of 1991:
For FY 1997, the attribution of FY 1995 HTF (Highway Account) receipts was used to compute the 90-percent minimum allocation and the 90 percent of payments adjustment. Thus, the Treasury restatement impacted those computations. Attribution of projected FY 1997 combined Highway and Mass Transit Account receipts was used to compute the donor-State bonus. (Highway Information Update Vol.1, No.2 provides a detailed description of the method used by FHWA in attributing HTF tax receipts to highway users in each State.) In addition, Status of the Highway Trust Fund--Fiscal Year ended September 30, 1994 (FE-10); Comparison of Federal Highway Trust Fund Receipts and Federal-aid Apportionments and Allocations from the Fund - Fiscal Years 1957--1994 (FE-221), and Federal Highway Trust Fund Receipts Attributable to Highway Users in Each State--Fiscal Year 1995 (FE-9) were also revised as they, too, were impacted by the Treasury correction. These are among a number of tables on this and related topics the FHWA Office of Highway Information Management publishes in its annual Highway Statistics report. More detailed information on HTF financing and attribution of highway user revenue, as well as information on the highway summary tables may be obtained from Ross Crichton, (202) 366-5027.
Highway Statistics Steering Committee Plans June MeetingFHWA’s Highway Statistics Steering Committee has set June 3-4, 1997, as the tentative dates for its annual meeting. This meeting will be held in Washington, D.C. The Committee, which provides suggestions and feedback to FHWA’s Office of Highway Information Management on general highway information programs and policies, is comprised of transportation officials from State transportation agencies, FHWA and other U.S. DOT staff, and other Federal agencies. The Committee has recently invited representatives from major user groups to broaden its customer focus. While the agenda has not yet been finalized, presentations on a wide range of current issues such as reauthorization, CTIPS, U.S. DOT Conditions and Performance Report, and SCOP activities are expected to be of key interest. Committee work is expected to concentrate on a wide range of issues, including advice to FHWA on:
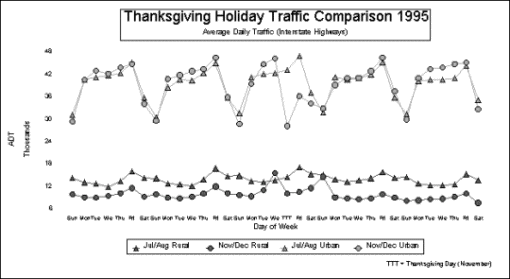
Since its inception more than 3 years ago, the Highway Statistics Steering Committee has made a number of key recommendations to FHWA which have resulted in information policy changes and improvements to FHWA and State information programs. The phase-out of the local government version of form FHWA-534 and the publication of a Customer’s Guide to Using Highway Statistics (FHWA Publication PL-96-028) are examples of Committee recommendations implemented by FHWA. For additional information, contact Ralph Erickson on (202) 366-9235. Thanksgiving Traffic PatternsThe Wednesday prior to Thanksgiving is often referred to as the busiest travel day of the year. This assertion has raised questions concerning traffic trends during the Thanksgiving holiday. Average daily traffic (ADT) during the Thanksgiving holiday period causes a shift in normal traffic patterns. This analysis compares Thanksgiving week and the 2 weeks preceding and following the holiday week with a high volume 5-week period in the summer. ADT is calculated for rural and urban Interstate highways for each time frame. Figure 8 shows ADT on rural and urban Interstates for 5 weeks from November 5 through December 9, 1995, and from July 23 through August 26, 1995. Each data point represents the average of approximately 500 ADTs for each stratum shown. Notice the significantly larger volume of traffic on urban Interstates compared to rural Interstate highways. In rural and urban areas, the normal pattern shows a weekly peak on Fridays. However, Sunday has the least traffic in urban areas, while Tuesday is often the low point in rural areas. Urban traffic has greater variation from day to day than rural traffic. The non-holiday, weekly patterns tend to remain consistent for each day of the week regardless of the month. The difference in seasons occurs primarily on rural Interstates. Figure 8 depicts a proportionally larger volume of traffic during weeks in July and August compared to weeks in November and December on rural Interstates. Traffic on urban Interstates does not show the same shift in traffic volume. The Thanksgiving holiday period causes a disruption in the normal weekly traffic patterns. The Wednesday preceding Thanksgiving day resembles typical Friday traffic patterns for both rural and urban Interstates. Note that on the Wednesday before Thanksgiving, ADT approaches but is no higher than that of a typical summertime Friday on rural Interstates. Subsequently, Thanksgiving day traffic shows a significant drop from the normal pattern on urban Interstates. The pattern quickly returns to normal on the Monday following the Thanksgiving holiday on rural and urban Interstates. These figures represent vehicle traffic on Interstate highways. It is reasonable to assume that vehicles traveling near the holiday have a higher number of occupants than normal, resulting in a greater number of person-miles. Also, this analysis does not consider other modes of travel. For more information, contact William Grush at william.grush@fhwa.dot.gov or call (202) 366-5052.

Back to Reports |


