|
|
|
Comparison of Gross Volume of Gasoline Reported by States - Sheet 1 of 4
Comparison of Gross Volume of Gasoline Reported by States - Sheet 2 of 4
Comparison of Gross Volume of Gasoline Reported by States - Sheet 3 of 4
Comparison of Gross Volume of Gasoline Reported by States - Sheet 4 of 4
Monthly Gasoline/Gasohol Reported By States - 2003
Monthly Special Fuel Reported by States - 2004
Monthly Special Fuel Reported by States - 2003
Tax Rates On Motor Fuel - December 2004 - Sheet 1 of 3
Tax Rates On Motor Fuel - December 2004 - Sheet 1 of 3
Tax Rates On Motor Fuel - December 2004 - Sheet 1 of 3
Motor Fuel Tax Rates for Selected Countries as of December 1, 2004
Note to Users of Monthly Motor-Fuel "Retail Price" Data
Retail Prices of Motor Fuel - Sheet 1 of 2
Retail Prices of Motor Fuel - Sheet 2 of 2
If you have questions concerning the report, contact:
Marsha A. Reynolds
Federal Highway Administration
Office of Highway Policy Information (HPPI)
400 Seventh Street SW
Washington, DC 20590
Telephone: 202-366-5029
Facsimile: 202-366-7742
The Monthly Motor Fuel Reported by States report is only available on the FHWA Office of Highway Policy Information Website at the following address:
https://www.fhwa.dot.gov/ohim/mmfr/mmfrpage.htm
Data in the tables are subject to change because the States may revise and update their data.
This is an electronic version of Publication No. FHWA-PL-05-014
| Monthly Motor Fuel Reported by States | December 2004 |
CHANGE FOR U.S.
+1.7
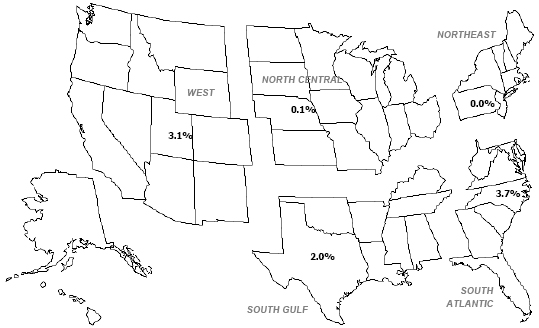 |
| REGION | PERCENT CHANGE | ||||||||
|---|---|---|---|---|---|---|---|---|---|
| Based on All Reported 2004 Data | |||||||||
| North-East | +1.4 % | ||||||||
| South-Atlantic | +3.1 % | ||||||||
| North-Central | +0.5 % | ||||||||
| South-Gulf | +1.7 % | ||||||||
| Western | +1.8 % | ||||||||
West
|
North Central
|
Northeast
|
South Gulf
|
South Atlantic
|
| Monthly Motor Fuel Reported by States | December 2004 |
Based on reports of 50 Entities, gasoline consumption for January - December 2004 changed by +1.7 percent compared to the same period in 2003 . /1 During this period, vehicle-miles of travel changed by +2.9 percent.
The gasoline volume shown in this report is a cumulative tabulation of gross volume reported by wholesale distributors to State motor fuel tax agencies. It includes highway use, nonhighway use and losses. There is a lag of up to 6 weeks between the wholesale transactions reported and retail sales to consumers. Travel trends are reported monthly in Traffic Volume Trends based on actual traffic counts at permanent traffic recorders operated by the State highway agencies and, thus, reflect only highway use of fuel. The vehicle-miles reported include all vehicles, regardless of fuel type. While data in both reports reflect changes in trends, large monthly changes can be caused by exceptional weather conditions, variations in timing of holidays, or processing delays.
All States levy volume taxes on gasoline and diesel fuel. The rates in effect for 2004 are shown in Table MF-121T. The gasoline rates vary from a low of 7.5 cents per gallon to 30 cents with an average of 19.4 cents. Six States provide for full or partial exemptions for gasohol, a blend of 90 percent gasoline and 10 percent fuel alcohol. Diesel fuel rates vary from 7.5 cents to 31.2 cents per gallon.
Traditionally, State fuel tax rates could only be changed with legislation, but 10 States now have variable rate motor fuel taxes. These taxes are adjusted at specified intervals-annually, semiannually, or quarterly-usually on the basis of an index or formula specified in the enabling legislation. These States are identified in the notes on Table MF-121T. Adjustments to variable rate taxes are announced by State tax agencies shortly before the effective date of the change.
NONE
/1 This percentage change is a comparison for those States for which data are available for the report month. However, the percentage increase on the national map is a comparison of cumulative data for all States for which both 2003 and 2004 data are available.
| Monthly Motor Fuel Reported by States | December 2004 |
| Created On: 10/21/2005 | (GALLONS) | TABLE MF-33G Sheet 1 of 4 December 2004 Reporting Period |
| STATE |
JANUARY 2004 (52 Entities) |
CALENDAR YEAR CUMULATIVE |
FEBRUARY 2004 (52 Entities) |
CALENDAR YEAR CUMULATIVE |
MARCH 2004 (51 Entities) |
CALENDAR YEAR CUMULATIVE |
|||
|---|---|---|---|---|---|---|---|---|---|
| VOLUME | VOLUME |
PERCENT CHANGE |
VOLUME | VOLUME |
PERCENT CHANGE |
VOLUME | VOLUME |
PERCENT CHANGE | |
|
1/ Exports and dealer transfers are excluded where possible. Cumulative figures include revisions of data for prior months. Volume includes both gasoline and gasohol. 2/ Percent change is from comparable period of prior year and includes only the States shown. Totals include only those States for which data are shown. For information, call the Office of Highway Policy Information, Federal Highway Administration at (202) 366-0170. |
|||||||||
| Alabama | 202,666,982 | 202,666,982 | 0.9 | 199,284,538 | 401,951,520 | 4.0 | 215,696,272 | 617,647,792 | 4.6 |
| Alaska | 23,646,787 | 23,646,787 | 5.9 | 20,877,270 | 44,524,057 | 0.6 | 24,061,554 | 68,585,611 | 2.6 |
| Arizona | 227,588,931 | 227,588,931 | 2.8 | 222,095,612 | 449,684,543 | 5.6 | 247,418,669 | 697,103,212 | 6.8 |
| Arkansas | 117,758,848 | 117,758,848 | 1.3 | 114,821,624 | 232,580,472 | 5.7 | 127,321,372 | 359,901,844 | 6.5 |
| California | 1,293,630,728 | 1,293,630,728 | 2.5 | 1,251,734,914 | 2,545,365,642 | 4.2 | 1,360,361,532 | 3,905,727,174 | 4.5 |
| Colorado | 172,276,334 | 172,276,334 | 2.5 | 166,981,281 | 339,257,615 | 4.3 | 183,181,309 | 522,438,924 | 7.3 |
| Connecticut | 160,702,863 | 160,702,863 | 12.0 | 150,985,496 | 311,688,359 | 15.8 | 154,867,812 | 466,556,171 | 15.6 |
| Delaware | 33,703,658 | 33,703,658 | 6.9 | 32,504,897 | 66,208,555 | 9.8 | 35,588,223 | 101,796,778 | 8.5 |
| District of Columbia | 14,258,748 | 14,258,748 | 19.6 | 13,891,686 | 28,150,434 | 14.0 | 14,641,080 | 42,791,514 | 8.6 |
| Florida | 625,475,385 | 625,475,385 | -6.6 | 782,562,263 | 1,408,037,648 | 4.5 | 688,176,347 | 2,096,213,995 | 5.5 |
| Georgia | 391,247,318 | 391,247,318 | -3.1 | 444,223,278 | 835,470,596 | 6.8 | 437,385,398 | 1,272,855,994 | 5.4 |
| Hawaii | 36,607,032 | 36,607,032 | -2.0 | 36,868,443 | 73,475,475 | 12.1 | 41,637,086 | 115,112,561 | 3.4 |
| Idaho | 44,697,403 | 44,697,403 | -9.4 | 53,923,909 | 98,621,312 | 0.7 | 44,486,389 | 143,107,701 | -2.9 |
| Illinois | 439,656,846 | 439,656,846 | 5.2 | 406,803,708 | 846,460,554 | 4.6 | 389,883,853 | 1,236,344,407 | 1.6 |
| Indiana | 254,521,201 | 254,521,201 | -1.7 | 250,654,602 | 505,175,803 | 3.0 | 271,803,024 | 776,978,827 | 3.0 |
| Iowa | 124,871,268 | 124,871,268 | -3.4 | 118,157,921 | 243,029,189 | -0.9 | 135,940,731 | 378,969,920 | 2.0 |
| Kansas | 110,099,380 | 110,099,380 | -3.3 | 101,067,217 | 211,166,597 | -1.7 | 122,786,683 | 333,953,280 | 0.7 |
| Kentucky | 176,423,982 | 176,423,982 | 1.1 | 172,731,639 | 349,155,621 | 4.8 | 193,297,367 | 542,452,988 | 4.9 |
| Louisiana | 187,413,485 | 187,413,485 | 9.8 | 183,107,117 | 370,520,602 | -4.2 | 217,652,320 | 588,172,922 | 0.6 |
| Maine | 59,203,868 | 59,203,868 | -28.6 | 53,395,744 | 112,599,612 | -22.3 | 57,046,430 | 169,646,042 | -15.2 |
| Maryland | 209,913,097 | 209,913,097 | 3.5 | 204,863,392 | 414,776,489 | 9.5 | 225,632,390 | 640,408,879 | 7.5 |
| Massachusetts | 236,121,491 | 236,121,491 | 2.1 | 220,064,119 | 456,185,610 | 3.8 | 233,685,529 | 689,871,139 | 4.4 |
| Michigan | 388,171,345 | 388,171,345 | -6.2 | 393,403,233 | 781,574,578 | -0.2 | 399,731,080 | 1,181,305,658 | -0.9 |
| Minnesota | 222,689,787 | 222,689,787 | 1.1 | 205,409,981 | 428,099,768 | 2.0 | 218,351,233 | 646,451,001 | 2.4 |
| Mississippi | 128,546,373 | 128,546,373 | -1.1 | 132,586,823 | 261,133,196 | 7.3 | 152,441,754 | 413,574,950 | 6.6 |
| Missouri | 254,068,100 | 254,068,100 | -13.6 | 239,290,506 | 493,358,606 | -5.8 | 239,290,506 | 732,649,112 | -6.6 |
| Montana | 36,191,351 | 36,191,351 | -0.5 | 34,573,578 | 70,764,929 | 1.5 | 39,738,373 | 110,503,302 | 5.4 |
| Nebraska | 68,194,908 | 68,194,908 | -1.8 | 63,945,262 | 132,140,170 | 1.1 | 73,615,518 | 205,755,688 | 3.0 |
| Nevada | 87,556,420 | 87,556,420 | 5.5 | 83,101,578 | 170,657,998 | 6.1 | 92,088,120 | 262,746,118 | 6.5 |
| New Hampshire | 60,354,864 | 60,354,864 | -3.4 | 55,420,840 | 115,775,704 | -0.3 | 58,625,541 | 174,401,245 | 0.5 |
| New Jersey | 394,569,343 | 394,569,343 | 18.8 | 335,661,952 | 730,231,295 | 15.8 | 379,672,762 | 1,109,904,057 | 9.7 |
| New Mexico | 44,515,859 | 44,515,859 | -28.2 | 121,945,664 | 166,461,523 | 6.8 | 70,191,297 | 236,652,820 | -0.1 |
| New York | 471,712,905 | 471,712,905 | -4.6 | 444,834,170 | 916,547,075 | 2.4 | 451,625,724 | 1,368,172,799 | 0.6 |
| North Carolina | 335,345,510 | 335,345,510 | -4.4 | 340,455,371 | 675,800,881 | 2.3 | 383,323,815 | 1,059,124,696 | 4.5 |
| North Dakota | 27,321,087 | 27,321,087 | 0.2 | 27,479,001 | 54,800,088 | 0.9 | 28,615,375 | 83,415,463 | 2.8 |
| Ohio | 416,279,593 | 416,279,593 | -0.8 | 403,467,539 | 819,747,132 | 2.9 | 439,745,250 | 1,259,492,382 | 2.7 |
| Oklahoma | 150,204,025 | 150,204,025 | 5.2 | 144,038,667 | 294,242,692 | 6.0 | 160,128,602 | 454,371,294 | 4.1 |
| Oregon | 97,072,149 | 97,072,149 | -18.3 | 131,038,304 | 228,110,453 | -4.7 | 131,685,936 | 359,796,389 | -0.1 |
| Pennsylvania | 414,982,448 | 414,982,448 | 0.4 | 394,445,408 | 809,427,856 | 3.6 | 430,464,773 | 1,239,892,629 | 3.6 |
| Rhode Island | 35,184,443 | 35,184,443 | 1.8 | 31,294,112 | 66,478,555 | 2.3 | 35,567,707 | 102,046,262 | 3.1 |
| South Carolina | 185,045,865 | 185,045,865 | 0.4 | 184,317,224 | 369,363,089 | 2.8 | 211,544,977 | 580,908,066 | 4.6 |
| South Dakota | 33,308,650 | 33,308,650 | -2.5 | 30,810,249 | 64,118,899 | -0.5 | 33,682,062 | 97,800,961 | 0.7 |
| Tennessee | 239,209,372 | 239,209,372 | -7.5 | 220,452,198 | 459,661,570 | 0.9 | 266,480,360 | 726,141,930 | 7.4 |
| Texas | 970,714,829 | 970,714,829 | 5.1 | 890,314,227 | 1,861,029,056 | 5.5 | 996,685,050 | 2,857,714,106 | 4.7 |
| Utah | 86,976,350 | 86,976,350 | 17.2 | 78,067,066 | 165,043,416 | 9.0 | 91,927,575 | 256,970,991 | 7.4 |
| Vermont | 30,216,604 | 30,216,604 | -1.7 | 28,222,626 | 58,439,230 | 1.5 | 28,241,706 | 86,680,936 | 1.6 |
| Virginia | 313,325,145 | 313,325,145 | 3.1 | 304,154,238 | 617,479,383 | 7.8 | 270,313,524 | 887,792,907 | -0.4 |
| Washington | 203,886,484 | 203,886,484 | -6.8 | 179,170,835 | 383,057,319 | -9.9 | 263,662,651 | 646,719,970 | 0.3 |
| West Virginia | 22,222,376 | 22,222,376 | -52.0 | 105,449,801 | 127,672,177 | 11.0 | 73,593,439 | 201,265,616 | 8.0 |
| Wisconsin | 211,421,047 | 211,421,047 | 2.6 | 189,647,502 | 401,068,549 | 3.7 | 211,537,690 | 612,606,239 | 3.9 |
| Wyoming | 25,098,575 | 25,098,575 | 4.6 | 28,754,103 | 53,852,678 | 19.3 | 32,036,844 | 85,889,522 | 12.0 |
| U.S. Totals 2/ | 11,096,871,442 | 11,096,871,442 | -0.3 | 11,023,352,728 | 22,120,224,170 | 3.7 | 11,687,160,614 | 33,807,384,784 | 3.7 |
| Puerto Rico | 90,105,871 | 90,105,871 | -1.1 | 103,673,335 | 193,779,206 | 10.2 | 0 | 0 | 0.0 |
| Grand Total 2/ | 11,186,977,313 | 11,186,977,313 | -0.3 | 11,127,026,063 | 22,314,003,376 | 3.7 | 11,687,160,614 | 33,807,384,784 | 3.7 |
| Monthly Motor Fuel Reported by States | December 2004 |
| Created On: 10/21/2005 | (GALLONS) | TABLE MF-33G Sheet 2 of 4 December 2004 Reporting Period |
| STATE |
APRIL 2004 (51 Entities) |
CALENDAR YEAR CUMULATIVE |
MAY 2004 (51 Entities) |
CALENDAR YEAR CUMULATIVE |
JUNE 2004 (51 Entities) |
CALENDAR YEAR CUMULATIVE |
|||
|---|---|---|---|---|---|---|---|---|---|
| VOLUME | VOLUME |
PERCENT CHANGE |
VOLUME | VOLUME |
PERCENT CHANGE |
VOLUME | VOLUME |
PERCENT CHANGE | |
|
1/ Exports and dealer transfers are excluded where possible. Cumulative figures include revisions of data for prior months. Volume includes both gasoline and gasohol. 2/ Percent change is from comparable period of prior year and includes only the States shown. Totals include only those States for which data are shown. For information, call the Office of Highway Policy Information, Federal Highway Administration at (202) 366-0170. |
|||||||||
| Alabama | 215,240,463 | 832,888,255 | 4.7 | 224,117,944 | 1,057,006,199 | 4.0 | 217,307,984 | 1,274,314,183 | 4.1 |
| Alaska | 17,225,214 | 85,810,825 | -1.7 | 26,007,168 | 111,817,993 | -3.9 | 28,164,276 | 139,982,269 | -3.5 |
| Arizona | 229,054,422 | 926,157,634 | 6.1 | 231,059,898 | 1,157,217,532 | 5.2 | 223,741,035 | 1,380,958,567 | 4.9 |
| Arkansas | 124,098,488 | 484,000,332 | 5.1 | 128,558,100 | 612,558,432 | 3.8 | 125,831,534 | 738,389,966 | 3.2 |
| California | 1,326,800,026 | 5,232,527,200 | 4.5 | 1,365,227,161 | 6,597,754,361 | 3.7 | 1,303,872,219 | 7,901,626,580 | 2.9 |
| Colorado | 173,726,301 | 696,165,225 | 6.2 | 183,869,846 | 880,035,071 | 4.8 | 181,545,770 | 1,061,580,841 | 3.9 |
| Connecticut | 157,973,151 | 624,529,322 | 15.6 | 175,354,456 | 799,883,778 | 16.9 | 165,493,519 | 965,377,297 | 16.9 |
| Delaware | 35,588,223 | 137,385,001 | 8.6 | 34,712,818 | 172,097,819 | 3.4 | 36,880,053 | 208,977,872 | 2.8 |
| District of Columbia | 12,547,838 | 55,339,352 | 5.5 | 13,860,750 | 69,200,102 | 2.5 | 12,684,330 | 81,884,432 | 2.3 |
| Florida | 773,142,006 | 2,869,356,001 | 5.8 | 724,892,580 | 3,594,248,581 | 5.6 | 724,881,104 | 4,319,129,685 | 5.2 |
| Georgia | 402,299,684 | 1,675,155,678 | 3.1 | 427,367,846 | 2,102,523,524 | 2.3 | 445,366,297 | 2,547,889,821 | 2.7 |
| Hawaii | 34,551,362 | 149,663,923 | 4.3 | 44,575,376 | 194,239,299 | 6.3 | 30,449,702 | 224,689,001 | 0.2 |
| Idaho | 44,423,837 | 187,531,538 | -1.5 | 54,207,532 | 241,739,070 | 4.3 | 54,862,677 | 296,601,747 | 4.0 |
| Illinois | 494,349,322 | 1,730,693,729 | 5.3 | 459,591,105 | 2,190,284,834 | 4.3 | 448,383,483 | 2,638,668,317 | 3.7 |
| Indiana | 276,016,403 | 1,052,995,230 | 2.9 | 284,834,970 | 1,337,830,200 | 2.1 | 282,808,572 | 1,620,638,772 | 2.0 |
| Iowa | 139,731,188 | 518,701,108 | 3.1 | 139,337,879 | 658,038,987 | 1.7 | 149,533,703 | 807,572,690 | 2.4 |
| Kansas | 112,904,605 | 446,857,885 | 0.7 | 117,344,653 | 564,202,538 | -0.3 | 115,141,193 | 679,343,731 | -1.3 |
| Kentucky | 201,461,619 | 743,914,607 | 5.1 | 203,367,845 | 947,282,452 | 4.7 | 216,325,209 | 1,163,607,661 | 6.2 |
| Louisiana | 194,208,848 | 782,381,770 | 0.0 | 211,732,484 | 994,114,254 | -3.6 | 194,381,874 | 1,188,496,128 | -3.3 |
| Maine | 55,484,607 | 225,130,649 | -11.1 | 60,544,497 | 285,675,146 | -9.0 | 60,544,497 | 346,219,643 | -8.4 |
| Maryland | 221,888,270 | 862,297,149 | 5.9 | 238,956,231 | 1,101,253,380 | 5.2 | 227,407,557 | 1,328,660,937 | 4.4 |
| Massachusetts | 231,871,466 | 921,742,605 | 1.9 | 247,711,207 | 1,169,453,812 | 1.6 | 246,261,143 | 1,415,714,955 | 1.5 |
| Michigan | 422,372,227 | 1,603,677,885 | 4.0 | 427,476,668 | 2,031,154,553 | 1.5 | 406,874,118 | 2,438,028,671 | -1.4 |
| Minnesota | 223,236,218 | 869,687,219 | 2.8 | 233,692,785 | 1,103,380,004 | 1.4 | 243,278,120 | 1,346,658,124 | 1.2 |
| Mississippi | 142,652,885 | 556,227,835 | 10.7 | 137,894,645 | 694,122,480 | 2.6 | 136,440,542 | 830,563,022 | 2.3 |
| Missouri | 281,555,174 | 1,014,204,286 | -3.3 | 284,071,300 | 1,298,275,586 | -2.5 | 285,241,195 | 1,583,516,781 | -1.5 |
| Montana | 39,890,084 | 150,393,386 | 5.6 | 41,256,491 | 191,649,877 | 2.3 | 45,974,219 | 237,624,096 | 1.2 |
| Nebraska | 72,766,336 | 278,522,024 | 3.5 | 74,274,614 | 352,796,638 | 1.5 | 76,390,653 | 429,187,291 | 0.7 |
| Nevada | 90,419,713 | 353,165,831 | 6.7 | 93,692,007 | 446,857,838 | 5.7 | 91,306,527 | 538,164,365 | 4.8 |
| New Hampshire | 56,597,486 | 230,998,731 | 1.1 | 61,828,558 | 292,827,289 | 1.4 | 63,481,858 | 356,309,147 | 1.9 |
| New Jersey | 397,045,286 | 1,506,949,343 | 11.2 | 410,162,286 | 1,917,111,629 | 12.0 | 389,823,962 | 2,306,935,591 | 10.9 |
| New Mexico | 82,000,382 | 318,653,202 | 0.0 | 91,880,532 | 410,533,734 | 5.4 | 92,489,688 | 503,023,422 | 3.8 |
| New York | 488,083,610 | 1,856,256,409 | 1.6 | 516,057,786 | 2,372,314,195 | 1.4 | 499,908,902 | 2,872,223,097 | 1.8 |
| North Carolina | 366,911,491 | 1,426,036,187 | 4.4 | 425,388,034 | 1,851,424,221 | 5.9 | 353,520,836 | 2,204,945,057 | 4.2 |
| North Dakota | 30,583,637 | 113,999,100 | 3.7 | 30,198,458 | 144,197,558 | 1.5 | 33,138,538 | 177,336,096 | 1.7 |
| Ohio | 437,524,897 | 1,697,017,279 | 2.3 | 465,348,928 | 2,162,366,207 | 1.9 | 462,703,087 | 2,625,069,294 | 1.9 |
| Oklahoma | 159,483,223 | 613,854,517 | 2.6 | 183,970,485 | 797,825,002 | 5.4 | 162,052,352 | 959,877,354 | 8.1 |
| Oregon | 127,418,936 | 487,215,325 | 1.2 | 137,946,094 | 625,161,419 | 0.6 | 135,912,285 | 761,073,704 | 0.1 |
| Pennsylvania | 438,912,651 | 1,678,805,280 | 3.2 | 457,831,728 | 2,136,637,008 | 2.5 | 450,144,319 | 2,586,781,327 | 2.4 |
| Rhode Island | 31,940,766 | 133,987,028 | 0.9 | 36,333,761 | 170,320,789 | 0.9 | 34,424,399 | 204,745,188 | 0.5 |
| South Carolina | 216,955,975 | 797,864,041 | 5.6 | 214,746,598 | 1,012,610,639 | 5.1 | 213,582,058 | 1,226,192,697 | 5.2 |
| South Dakota | 35,033,291 | 132,834,252 | 1.1 | 35,716,207 | 168,550,459 | -2.2 | 41,106,185 | 209,656,644 | -1.9 |
| Tennessee | 262,188,431 | 988,330,361 | 3.8 | 267,730,390 | 1,256,060,751 | 1.6 | 260,825,064 | 1,516,885,815 | 0.6 |
| Texas | 973,312,437 | 3,831,026,543 | 4.1 | 1,006,869,838 | 4,837,896,381 | 3.1 | 959,263,681 | 5,797,160,062 | 2.4 |
| Utah | 86,136,799 | 343,107,790 | 6.5 | 87,097,419 | 430,205,209 | 4.7 | 88,799,503 | 519,004,712 | 3.9 |
| Vermont | 26,381,638 | 113,062,574 | 2.4 | 29,317,999 | 142,380,573 | 1.6 | 30,382,165 | 172,762,738 | 1.7 |
| Virginia | 425,717,745 | 1,313,510,652 | -0.8 | 325,020,935 | 1,638,531,587 | 5.1 | 343,511,493 | 1,982,043,080 | 2.0 |
| Washington | 228,726,507 | 875,446,477 | 1.1 | 229,706,960 | 1,105,153,437 | -0.3 | 228,792,955 | 1,333,946,392 | -1.3 |
| West Virginia | 38,989,471 | 240,255,087 | -3.2 | 106,546,085 | 346,801,172 | 13.4 | 42,148,411 | 388,949,583 | -2.0 |
| Wisconsin | 212,454,323 | 825,060,562 | 4.7 | 219,114,019 | 1,044,174,581 | 3.0 | 230,654,551 | 1,274,829,132 | 2.6 |
| Wyoming | 19,470,933 | 105,360,455 | 8.5 | 27,840,798 | 133,201,253 | 12.6 | 13,963,723 | 147,164,976 | -1.3 |
| U.S. Totals 2/ | 11,889,349,895 | 45,696,734,679 | 3.8 | 12,256,244,754 | 57,952,979,433 | 3.4 | 11,908,003,120 | 69,860,982,553 | 2.8 |
| Puerto Rico | 0 | 0 | 0.0 | 0 | 0 | 0.0 | 0 | 0 | 0.0 |
| Grand Total 2/ | 11,889,349,895 | 45,696,734,679 | 3.8 | 12,256,244,754 | 57,952,979,433 | 3.4 | 11,908,003,120 | 69,860,982,553 | 2.8 |
| Monthly Motor Fuel Reported by States | December 2004 |
| Created On: 10/21/2005 | (GALLONS) | TABLE MF-33G Sheet 3 of 4 December 2004 Reporting Period |
| STATE |
JULY 2004 (51 Entities) |
CALENDAR YEAR CUMULATIVE |
AUGUST 2004 (51 Entities) |
CALENDAR YEAR CUMULATIVE |
SEPTEMBER 2004 (51 Entities) |
CALENDAR YEAR CUMULATIVE |
|||
|---|---|---|---|---|---|---|---|---|---|
| VOLUME | VOLUME |
PERCENT CHANGE |
VOLUME | VOLUME |
PERCENT CHANGE |
VOLUME | VOLUME |
PERCENT CHANGE | |
|
1/ Exports and dealer transfers are excluded where possible. Cumulative figures include revisions of data for prior months. Volume includes both gasoline and gasohol. 2/ Percent change is from comparable period of prior year and includes only the States shown. Totals include only those States for which data are shown. For information, call the Office of Highway Policy Information, Federal Highway Administration at (202) 366-0170. |
|||||||||
| Alabama | 211,664,222 | 1,485,978,405 | 2.6 | 226,928,625 | 1,712,907,030 | 2.6 | 262,566,701 | 1,975,473,731 | 4.3 |
| Alaska | 31,356,143 | 171,338,412 | -1.7 | 29,896,449 | 201,234,861 | -2.9 | 27,025,462 | 228,260,323 | -1.8 |
| Arizona | 226,834,518 | 1,607,793,085 | 4.4 | 235,233,107 | 1,843,026,192 | 4.2 | 223,840,547 | 2,066,866,739 | 4.5 |
| Arkansas | 132,530,262 | 870,920,228 | 2.7 | 127,848,598 | 998,768,826 | 2.1 | 122,555,416 | 1,121,324,242 | 1.9 |
| California | 1,370,903,067 | 9,272,529,647 | 2.4 | 1,385,346,996 | 10,657,876,643 | 2.2 | 1,311,230,424 | 11,969,107,067 | 2.0 |
| Colorado | 196,622,873 | 1,258,203,714 | 4.1 | 195,146,126 | 1,453,349,840 | 5.1 | 184,218,371 | 1,637,568,211 | 5.6 |
| Connecticut | 173,425,393 | 1,138,802,690 | 18.1 | 145,385,198 | 1,284,187,888 | 15.4 | 137,840,655 | 1,422,028,543 | 14.2 |
| Delaware | 39,617,633 | 248,595,505 | 2.9 | 39,657,039 | 288,252,544 | 3.0 | 35,876,746 | 324,129,290 | 1.7 |
| District of Columbia | 12,989,672 | 94,874,104 | 0.9 | 12,539,739 | 107,413,843 | -0.1 | 12,566,870 | 119,980,713 | 0.1 |
| Florida | 687,557,968 | 5,006,687,653 | 5.0 | 663,009,971 | 5,669,697,624 | 3.8 | 776,586,295 | 6,446,283,919 | 4.7 |
| Georgia | 440,143,365 | 2,988,033,186 | 2.4 | 414,632,802 | 3,402,665,988 | 1.3 | 412,578,166 | 3,815,244,154 | 0.9 |
| Hawaii | 49,260,014 | 273,949,015 | 3.2 | 37,874,642 | 311,823,657 | 1.0 | 29,825,024 | 341,648,681 | -1.5 |
| Idaho | 52,635,643 | 349,237,390 | 3.0 | 55,243,071 | 404,480,461 | 1.9 | 59,469,630 | 463,950,091 | 0.6 |
| Illinois | 455,610,975 | 3,094,279,292 | 3.3 | 447,687,975 | 3,541,967,267 | 2.6 | 417,990,709 | 3,959,957,976 | 2.1 |
| Indiana | 291,398,571 | 1,912,037,343 | 1.6 | 289,456,646 | 2,201,493,989 | 1.1 | 272,743,568 | 2,474,237,557 | 1.0 |
| Iowa | 147,377,178 | 954,949,868 | 1.9 | 146,918,730 | 1,101,868,598 | 1.6 | 142,168,665 | 1,244,037,263 | 2.0 |
| Kansas | 118,173,920 | 797,517,651 | -2.2 | 115,332,078 | 912,849,729 | -2.3 | 112,577,871 | 1,025,427,600 | -1.9 |
| Kentucky | 201,519,611 | 1,365,127,272 | 5.2 | 200,112,209 | 1,565,239,481 | 4.5 | 187,973,580 | 1,753,213,061 | 4.0 |
| Louisiana | 212,587,924 | 1,401,084,052 | -2.4 | 197,168,504 | 1,598,252,556 | -3.3 | 245,416,154 | 1,843,668,710 | -1.1 |
| Maine | 66,617,243 | 412,836,886 | -11.5 | 71,238,532 | 484,075,418 | -10.7 | 62,841,255 | 546,916,673 | -9.3 |
| Maryland | 234,050,551 | 1,562,711,488 | 3.9 | 233,249,962 | 1,795,961,450 | 2.8 | 226,370,038 | 2,022,331,488 | 2.8 |
| Massachusetts | 250,310,379 | 1,666,025,334 | 1.1 | 249,833,423 | 1,915,858,757 | 0.6 | 241,397,092 | 2,157,255,849 | 0.8 |
| Michigan | 455,694,610 | 2,893,723,281 | 1.2 | 453,353,279 | 3,347,076,560 | 0.0 | 428,881,817 | 3,775,958,377 | 0.1 |
| Minnesota | 252,593,244 | 1,599,251,368 | 0.9 | 247,042,474 | 1,846,293,842 | 0.4 | 231,891,760 | 2,078,185,602 | 0.2 |
| Mississippi | 145,814,766 | 976,377,788 | 2.5 | 156,519,820 | 1,132,897,608 | 4.3 | 134,882,330 | 1,267,779,938 | 2.9 |
| Missouri | 286,827,020 | 1,870,343,801 | -1.6 | 294,008,382 | 2,164,352,183 | -1.1 | 273,486,158 | 2,437,838,341 | -0.8 |
| Montana | 52,831,331 | 290,455,427 | 0.2 | 50,411,772 | 340,867,199 | -0.4 | 44,238,347 | 385,105,546 | 0.0 |
| Nebraska | 79,656,278 | 508,843,569 | 0.0 | 76,332,790 | 585,176,359 | -0.7 | 71,643,684 | 656,820,043 | -1.2 |
| Nevada | 99,911,334 | 638,075,699 | 4.7 | 99,405,508 | 737,481,207 | 4.6 | 93,335,038 | 830,816,245 | 4.4 |
| New Hampshire | 57,122,983 | 413,432,130 | -1.1 | 66,988,824 | 480,420,954 | -1.2 | 61,544,481 | 541,965,435 | -0.6 |
| New Jersey | 267,319,724 | 2,574,255,315 | 5.3 | 342,956,914 | 2,917,212,229 | 2.8 | 357,762,819 | 3,274,975,048 | 2.5 |
| New Mexico | 73,673,138 | 576,696,560 | 0.6 | 93,479,524 | 670,176,084 | 9.5 | 79,720,434 | 749,896,518 | 4.2 |
| New York | 514,505,978 | 3,386,729,075 | 0.2 | 496,314,077 | 3,883,043,152 | -0.1 | 489,656,118 | 4,372,699,270 | 0.2 |
| North Carolina | 390,399,038 | 2,595,344,095 | 3.4 | 387,946,418 | 2,983,290,513 | 2.6 | 365,851,082 | 3,349,141,595 | 2.4 |
| North Dakota | 34,467,529 | 211,803,625 | 0.3 | 32,797,195 | 244,600,820 | -1.0 | 33,112,322 | 277,713,142 | 0.0 |
| Ohio | 465,121,647 | 3,090,190,941 | 1.4 | 470,983,910 | 3,561,174,851 | 1.0 | 438,513,890 | 3,999,688,741 | 0.8 |
| Oklahoma | 168,203,724 | 1,128,081,078 | 4.9 | 165,294,654 | 1,293,375,732 | 4.5 | 158,226,947 | 1,451,602,679 | 4.6 |
| Oregon | 142,301,559 | 903,375,263 | 0.3 | 145,009,435 | 1,048,384,698 | -0.2 | 128,138,968 | 1,176,523,666 | -0.3 |
| Pennsylvania | 467,135,089 | 3,053,916,416 | 2.0 | 462,425,709 | 3,516,342,125 | 1.4 | 437,175,648 | 3,953,517,773 | 1.4 |
| Rhode Island | 30,082,299 | 234,827,487 | -2.9 | 31,705,915 | 266,533,402 | -4.4 | 33,478,866 | 300,012,268 | -4.1 |
| South Carolina | 239,097,822 | 1,465,290,519 | 6.3 | 212,991,914 | 1,678,282,433 | 5.5 | 233,044,596 | 1,911,327,029 | 7.0 |
| South Dakota | 43,805,195 | 253,461,839 | 2.8 | 43,587,590 | 297,049,429 | 1.7 | 35,777,030 | 332,826,459 | 0.7 |
| Tennessee | 270,278,917 | 1,787,164,732 | 0.5 | 278,461,837 | 2,065,626,569 | 0.8 | 259,209,567 | 2,324,836,136 | 0.2 |
| Texas | 1,003,073,527 | 6,800,233,589 | 2.1 | 1,003,690,755 | 7,803,924,344 | 1.7 | 959,385,018 | 8,763,309,362 | 1.7 |
| Utah | 93,746,262 | 612,750,974 | 3.0 | 93,432,430 | 706,183,404 | 2.2 | 84,233,663 | 790,417,067 | 2.0 |
| Vermont | 32,677,474 | 205,440,212 | 1.3 | 33,064,924 | 238,505,136 | 1.0 | 29,926,433 | 268,431,569 | 1.0 |
| Virginia | 342,140,887 | 2,324,183,967 | 0.9 | 346,474,684 | 2,670,658,651 | 1.5 | 338,723,849 | 3,009,382,500 | 1.7 |
| Washington | 243,733,493 | 1,577,679,885 | -1.3 | 243,384,755 | 1,821,064,640 | -1.5 | 231,303,477 | 2,052,368,117 | -1.2 |
| West Virginia | 108,035,469 | 496,985,052 | 3.1 | 76,408,387 | 573,393,439 | 3.3 | 39,346,306 | 612,739,745 | -2.4 |
| Wisconsin | 228,728,950 | 1,503,558,082 | 0.7 | 237,341,756 | 1,740,899,838 | 0.2 | 223,912,883 | 1,964,812,721 | 1.3 |
| Wyoming | 32,791,159 | 179,956,135 | 1.9 | 35,286,215 | 215,242,350 | 4.9 | 34,140,876 | 249,383,226 | 1.0 |
| U.S. Totals 2/ | 12,224,957,571 | 82,085,940,124 | 2.3 | 12,196,842,269 | 94,282,782,393 | 1.8 | 11,836,203,646 | 106,118,986,039 | 1.8 |
| Puerto Rico | 0 | 0 | 0.0 | 0 | 0 | 0.0 | 0 | 0 | 0.0 |
| Grand Total 2/ | 12,224,957,571 | 82,085,940,124 | 2.3 | 12,196,842,269 | 94,282,782,393 | 1.8 | 11,836,203,646 | 106,118,986,039 | 1.8 |
| Monthly Motor Fuel Reported by States | December 2004 |
| Created On: 10/21/2005 | (GALLONS) | TABLE MF-33G Sheet 4 of 4 December 2004 Reporting Period |
| STATE |
OCTOBER 2004 (50 Entities) |
CALENDAR YEAR CUMULATIVE |
NOVEMBER 2004 (50 Entities) |
CALENDAR YEAR CUMULATIVE |
DECEMBER 2004 (50 Entities) |
CALENDAR YEAR CUMULATIVE |
|||
|---|---|---|---|---|---|---|---|---|---|
| VOLUME | VOLUME |
PERCENT CHANGE |
VOLUME | VOLUME |
PERCENT CHANGE |
VOLUME | VOLUME |
PERCENT CHANGE | |
|
1/ Exports and dealer transfers are excluded where possible. Cumulative figures include revisions of data for prior months. Volume includes both gasoline and gasohol. 2/ Percent change is from comparable period of prior year and includes only the States shown. Totals include only those States for which data are shown. For information, call the Office of Highway Policy Information, Federal Highway Administration at (202) 366-0170. |
|||||||||
| Alabama | 219,914,096 | 2,195,387,827 | 4.3 | 211,082,278 | 2,406,470,105 | 4.2 | 224,310,497 | 2,630,780,602 | 4.1 |
| Alaska | 23,945,858 | 252,206,181 | -2.3 | 27,123,091 | 279,329,272 | -0.2 | 23,772,332 | 303,101,604 | 2.2 |
| Arizona | 233,556,669 | 2,300,423,408 | 7.1 | 227,225,826 | 2,527,649,234 | 6.1 | 238,717,987 | 2,766,367,221 | 4.6 |
| Arkansas | 19,516,050 | 1,140,840,292 | 2.6 | 221,412,058 | 1,362,252,350 | 1.0 | 125,678,928 | 1,487,931,278 | 0.9 |
| California | 1,330,720,092 | 13,299,827,159 | 1.6 | 1,281,264,889 | 14,581,092,048 | 1.5 | 1,341,862,031 | 15,922,954,079 | 1.5 |
| Colorado | 182,423,160 | 1,819,991,371 | 5.0 | 170,518,797 | 1,990,510,168 | 4.6 | 184,771,195 | 2,175,281,363 | 4.5 |
| Connecticut | 145,058,755 | 1,567,087,298 | 12.2 | 138,160,703 | 1,705,248,001 | 9.7 | 155,660,053 | 1,860,908,054 | 7.0 |
| Delaware | 36,311,402 | 360,440,692 | 1.5 | 34,088,910 | 394,529,602 | 0.9 | 36,773,015 | 431,302,617 | 1.3 |
| District of Columbia | 13,412,579 | 133,393,292 | 0.2 | 12,856,775 | 146,250,067 | 0.1 | 12,417,484 | 158,667,551 | 0.5 |
| Florida | 658,248,230 | 7,104,532,149 | 4.3 | 731,135,748 | 7,835,667,897 | 4.4 | 713,759,495 | 8,549,427,392 | 4.5 |
| Georgia | 435,412,081 | 4,250,656,235 | 0.9 | 419,051,824 | 4,669,708,059 | 0.5 | 444,724,278 | 5,114,432,337 | 1.4 |
| Hawaii | 44,561,439 | 386,210,120 | 1.5 | 40,043,026 | 426,253,146 | 2.4 | 34,352,557 | 460,605,703 | 1.4 |
| Idaho | 62,456,360 | 526,406,451 | 0.9 | 64,204,926 | 590,611,377 | 2.7 | 55,447,790 | 646,059,167 | 2.7 |
| Illinois | 466,863,315 | 4,426,821,291 | 2.5 | 407,260,523 | 4,834,081,814 | 1.7 | 478,047,710 | 5,312,129,524 | 2.2 |
| Indiana | 276,814,945 | 2,751,052,502 | 0.6 | 267,663,498 | 3,018,716,000 | 0.7 | 281,268,669 | 3,299,984,669 | 0.7 |
| Iowa | 142,930,563 | 1,386,967,826 | 1.7 | 134,316,352 | 1,521,284,178 | 1.8 | 150,466,809 | 1,671,750,987 | 2.3 |
| Kansas | 112,098,741 | 1,137,526,341 | -2.3 | 108,815,584 | 1,246,341,925 | -2.1 | 118,724,390 | 1,365,066,315 | -2.3 |
| Kentucky | 164,305,616 | 1,917,518,677 | 2.0 | 180,430,723 | 2,097,949,400 | 2.2 | 241,808,785 | 2,339,758,185 | 4.1 |
| Louisiana | 191,387,307 | 2,035,056,017 | -1.4 | 185,482,172 | 2,220,538,189 | -1.7 | 202,445,420 | 2,422,983,609 | -2.1 |
| Maine | 62,362,637 | 609,279,310 | -8.4 | 56,397,633 | 665,676,943 | -7.7 | 58,929,081 | 724,606,024 | -7.3 |
| Maryland | 228,482,714 | 2,250,814,202 | 2.3 | 211,043,418 | 2,461,857,620 | 1.9 | 235,660,128 | 2,697,517,748 | 2.1 |
| Massachusetts | 246,444,188 | 2,403,700,037 | 0.9 | 237,818,326 | 2,641,518,363 | 0.7 | 247,913,115 | 2,889,431,478 | 1.2 |
| Michigan | 415,288,428 | 4,191,246,805 | -0.4 | 415,052,677 | 4,606,299,482 | -0.2 | 430,823,465 | 5,037,122,947 | -0.8 |
| Minnesota | 235,239,552 | 2,313,425,154 | 0.1 | 221,053,249 | 2,534,478,403 | 0.3 | 237,110,842 | 2,771,589,245 | 0.5 |
| Mississippi | 120,897,515 | 1,388,677,453 | 0.7 | 144,866,546 | 1,533,543,999 | 2.4 | 146,274,059 | 1,679,818,058 | 1.8 |
| Missouri | 273,567,110 | 2,711,405,451 | -1.0 | 265,353,252 | 2,976,758,703 | -0.8 | 284,165,642 | 3,260,924,345 | -0.4 |
| Montana | 42,356,390 | 427,461,936 | -1.1 | 39,442,506 | 466,904,442 | -0.8 | 39,239,563 | 506,144,005 | -0.7 |
| Nebraska | 73,131,408 | 729,951,451 | -1.3 | 70,869,715 | 800,821,166 | -1.0 | 78,558,739 | 879,379,905 | -0.6 |
| Nevada | 94,463,205 | 925,279,450 | 4.2 | 88,449,494 | 1,013,728,944 | 4.2 | 91,639,155 | 1,105,368,099 | 4.0 |
| New Hampshire | 64,506,392 | 606,471,827 | -0.2 | 58,440,350 | 664,912,177 | 0.1 | 63,161,865 | 728,074,042 | 0.4 |
| New Jersey | 367,451,238 | 3,642,426,286 | 4.6 | 308,142,819 | 3,950,569,105 | 3.3 | 442,033,305 | 4,392,602,410 | 4.6 |
| New Mexico | 74,841,731 | 824,738,249 | 8.7 | 66,074,617 | 890,812,866 | -0.6 | 96,413,164 | 987,226,030 | 1.7 |
| New York | 517,524,226 | 4,890,223,496 | 0.6 | 438,393,505 | 5,328,617,001 | -0.7 | 501,078,958 | 5,829,695,959 | -0.9 |
| North Carolina | 377,443,163 | 3,726,584,758 | 2.0 | 374,005,041 | 4,100,589,799 | 2.2 | 366,852,597 | 4,467,442,396 | 1.9 |
| North Dakota | 32,234,209 | 309,947,351 | 0.1 | 30,717,266 | 340,664,617 | -0.4 | 27,781,326 | 368,445,943 | -1.3 |
| Ohio | 450,584,782 | 4,450,273,523 | 0.5 | 432,208,361 | 4,882,481,884 | 0.5 | 456,371,161 | 5,338,853,045 | 0.7 |
| Oklahoma | 152,921,829 | 1,604,524,508 | 3.7 | 180,637,959 | 1,785,162,467 | 5.4 | 140,851,290 | 1,926,013,757 | 4.0 |
| Oregon | 132,663,467 | 1,309,187,133 | 1.6 | 124,513,669 | 1,433,700,802 | -0.4 | 129,040,186 | 1,562,740,988 | 0.0 |
| Pennsylvania | 453,576,763 | 4,407,094,536 | 1.1 | 432,543,758 | 4,839,638,294 | 1.0 | 461,318,030 | 5,300,956,324 | 1.3 |
| Rhode Island | 0 | 0 | 0.0 | 0 | 0 | 0.0 | 0 | 0 | 0.0 |
| South Carolina | 249,236,045 | 2,160,563,074 | 8.5 | 230,156,279 | 2,390,719,353 | 9.5 | 223,096,603 | 2,613,815,956 | 9.4 |
| South Dakota | 37,169,565 | 369,996,024 | 0.0 | 35,176,821 | 405,172,845 | 0.2 | 36,986,443 | 442,159,288 | 0.3 |
| Tennessee | 277,034,385 | 2,601,870,521 | 1.5 | 254,146,683 | 2,856,017,204 | 0.7 | 264,247,266 | 3,120,264,470 | 0.8 |
| Texas | 983,670,861 | 9,746,980,223 | 1.6 | 936,614,210 | 10,683,594,433 | 1.4 | 1,002,691,222 | 11,686,285,655 | 1.5 |
| Utah | 88,209,167 | 878,626,234 | 0.5 | 100,241,530 | 978,867,764 | 2.5 | 88,412,470 | 1,067,280,234 | 2.0 |
| Vermont | 31,123,198 | 299,554,767 | 0.5 | 28,151,438 | 327,706,205 | 1.1 | 30,176,044 | 357,882,249 | 1.2 |
| Virginia | 333,099,358 | 3,342,481,858 | 1.0 | 332,418,725 | 3,674,900,583 | 1.1 | 343,953,765 | 4,018,854,348 | 1.2 |
| Washington | 229,813,508 | 2,282,181,625 | -1.4 | 224,313,455 | 2,506,495,080 | -1.1 | 230,374,857 | 2,736,869,937 | -0.8 |
| West Virginia | 103,056,080 | 715,795,825 | 7.3 | 45,220,654 | 761,016,479 | -0.6 | 100,304,832 | 861,321,311 | 2.9 |
| Wisconsin | 213,126,796 | 2,177,939,517 | 0.4 | 210,268,620 | 2,388,208,137 | 0.4 | 230,154,841 | 2,618,362,978 | 0.9 |
| Wyoming | 40,942,498 | 290,325,724 | 1.0 | 35,876,282 | 326,202,006 | 1.5 | 26,679,506 | 352,881,512 | 0.1 |
| U.S. Totals 2/ | 11,762,399,666 | 117,581,373,437 | 1.8 | 11,490,746,561 | 129,072,119,998 | 1.6 | 12,177,302,945 | 141,249,422,943 | 1.7 |
| Puerto Rico | 0 | 0 | 0.0 | 0 | 0 | 0.0 | 0 | 0 | 0.0 |
| Grand Total 2/ | 11,762,399,666 | 117,581,373,437 | 1.8 | 11,490,746,561 | 129,072,119,998 | 1.6 | 12,177,302,945 | 141,249,422,943 | 1.7 |
| Monthly Motor Fuel Reported by States | December 2004 |
| Created On: 10/21/2005 | (GALLONS) | TABLE MF-33GA December 2004 Reporting Period |
|
STATE |
JANUARY | FEBRUARY | MARCH | APRIL | MAY | JUNE | JULY | AUGUST | SEPTEMBER | OCTOBER | NOVEMBER | DECEMBER | TOTAL |
|---|---|---|---|---|---|---|---|---|---|---|---|---|---|
|
1/ Exports and dealer transfers are excluded where possible. Cumulative figures include revisions of data for prior months. Volume includes both gasoline and gasohol. 2/ Percent change is from comparable period of prior year and includes only the States shown. Totals include only those States for which data are shown. For information, call the Office of Highway Policy Information, Federal Highway Administration at (202) 366-0170. |
|||||||||||||
| Alabama | 200,885,422 | 185,781,187 | 204,027,376 | 205,002,420 | 220,881,405 | 207,748,831 | 223,408,552 | 221,595,075 | 224,135,336 | 211,066,513 | 204,478,392 | 218,680,022 | 2,527,690,531 |
| Alaska | 22,328,362 | 21,937,520 | 22,603,496 | 20,406,719 | 29,064,505 | 28,698,689 | 29,206,049 | 33,089,940 | 25,014,394 | 25,839,309 | 21,745,077 | 16,530,457 | 296,464,517 |
| Arizona | 221,420,065 | 204,240,027 | 227,310,352 | 219,538,355 | 227,310,010 | 216,943,072 | 223,914,918 | 228,445,231 | 209,186,059 | 168,715,921 | 236,389,799 | 261,416,683 | 2,644,830,492 |
| Arkansas | 116,245,755 | 103,886,848 | 117,714,360 | 122,645,240 | 129,723,598 | 124,936,416 | 132,898,394 | 130,046,060 | 122,589,980 | 10,933,140 | 237,653,122 | 125,863,480 | 1,475,136,393 |
| California | 1,262,606,251 | 1,181,079,757 | 1,292,238,567 | 1,272,053,275 | 1,355,715,510 | 1,311,621,623 | 1,375,844,930 | 1,376,055,572 | 1,303,470,691 | 1,353,579,289 | 1,279,804,495 | 1,324,193,657 | 15,688,263,617 |
| Colorado | 168,128,374 | 157,227,176 | 161,723,168 | 168,582,533 | 183,981,172 | 182,403,496 | 186,137,448 | 175,122,878 | 167,244,135 | 181,963,523 | 169,610,056 | 179,191,263 | 2,081,315,222 |
| Connecticut | 143,528,491 | 125,700,629 | 134,474,556 | 136,743,539 | 143,743,216 | 141,838,452 | 137,917,965 | 148,419,775 | 133,149,367 | 151,339,889 | 158,052,556 | 184,969,117 | 1,739,877,552 |
| Delaware | 31,535,902 | 28,760,844 | 33,483,646 | 32,713,400 | 39,920,909 | 36,870,252 | 38,320,879 | 38,276,963 | 38,809,745 | 36,574,329 | 35,775,603 | 34,794,353 | 425,836,825 |
| District of Columbia | 11,918,245 | 12,778,818 | 14,719,839 | 13,053,889 | 15,072,574 | 12,537,781 | 13,984,881 | 13,462,940 | 12,380,965 | 13,167,758 | 13,010,264 | 11,735,385 | 157,823,339 |
| Florida | 669,338,970 | 678,686,177 | 638,415,807 | 726,527,955 | 689,920,068 | 704,016,969 | 662,479,393 | 692,561,130 | 693,561,220 | 655,275,301 | 697,679,486 | 673,010,019 | 8,181,472,495 |
| Georgia | 403,938,227 | 378,139,196 | 425,723,416 | 417,070,562 | 430,109,759 | 426,631,860 | 436,112,913 | 441,800,102 | 420,921,411 | 432,580,786 | 433,759,396 | 395,860,930 | 5,042,648,558 |
| Hawaii | 37,342,458 | 28,208,585 | 45,749,469 | 32,168,723 | 39,284,818 | 41,588,439 | 41,042,004 | 43,403,325 | 38,032,357 | 33,669,987 | 35,916,795 | 37,715,568 | 454,122,528 |
| Idaho | 49,335,850 | 48,552,859 | 49,429,304 | 43,044,561 | 41,426,931 | 53,453,109 | 53,956,578 | 57,779,456 | 64,227,055 | 60,693,844 | 52,970,866 | 54,488,427 | 629,358,840 |
| Illinois | 418,081,071 | 390,876,830 | 407,446,066 | 426,518,648 | 456,908,346 | 444,002,187 | 452,573,560 | 454,469,389 | 426,405,493 | 442,830,759 | 435,246,580 | 442,692,381 | 5,198,051,310 |
| Indiana | 258,873,102 | 231,556,206 | 263,834,934 | 268,621,436 | 286,801,827 | 278,862,724 | 293,724,518 | 294,890,048 | 273,601,636 | 284,398,957 | 263,932,470 | 277,706,522 | 3,276,804,380 |
| Iowa | 129,230,399 | 116,095,825 | 126,302,181 | 131,597,266 | 144,122,766 | 140,974,445 | 148,874,335 | 147,330,164 | 135,551,682 | 143,042,468 | 130,642,150 | 139,954,434 | 1,633,718,115 |
| Kansas | 113,888,070 | 100,925,047 | 116,718,152 | 112,194,773 | 122,382,652 | 121,856,427 | 127,319,474 | 119,027,540 | 111,102,051 | 118,569,614 | 109,627,385 | 123,965,649 | 1,397,576,834 |
| Kentucky | 174,542,847 | 158,702,727 | 183,623,207 | 190,678,205 | 196,924,419 | 191,099,338 | 202,246,989 | 200,510,846 | 187,505,419 | 194,682,722 | 173,263,953 | 193,641,892 | 2,247,422,564 |
| Louisiana | 170,690,551 | 215,979,682 | 197,949,003 | 198,048,324 | 248,486,709 | 198,440,121 | 206,480,544 | 215,888,267 | 211,321,830 | 200,866,570 | 194,917,763 | 216,678,356 | 2,475,747,720 |
| Maine | 82,879,251 | 62,031,825 | 55,188,472 | 53,199,597 | 60,734,023 | 64,133,793 | 88,472,593 | 75,137,966 | 61,171,101 | 62,547,341 | 55,357,363 | 60,535,447 | 781,388,772 |
| Maryland | 202,881,880 | 176,065,791 | 216,539,030 | 218,906,261 | 232,893,143 | 225,617,218 | 231,056,231 | 243,879,150 | 219,393,075 | 233,008,600 | 215,276,643 | 226,540,255 | 2,642,057,277 |
| Massachusetts | 231,292,395 | 208,151,046 | 221,138,704 | 244,316,192 | 246,597,087 | 243,634,228 | 252,672,751 | 256,944,453 | 235,427,319 | 242,934,198 | 239,047,380 | 234,030,867 | 2,856,186,620 |
| Michigan | 413,644,526 | 369,252,134 | 408,813,767 | 350,400,728 | 459,374,066 | 470,539,685 | 386,690,598 | 489,784,457 | 425,285,762 | 432,895,022 | 409,326,243 | 459,197,927 | 5,075,204,915 |
| Minnesota | 220,207,401 | 199,578,862 | 211,486,498 | 214,794,005 | 241,722,682 | 242,322,559 | 254,516,238 | 254,451,208 | 233,957,649 | 237,200,875 | 217,350,102 | 229,815,073 | 2,757,403,152 |
| Mississippi | 130,013,235 | 113,452,849 | 144,675,073 | 114,495,598 | 174,081,374 | 135,472,124 | 140,165,805 | 133,524,849 | 146,363,071 | 146,168,192 | 119,533,621 | 152,594,939 | 1,650,540,730 |
| Missouri | 294,132,139 | 229,572,600 | 260,866,337 | 263,875,055 | 283,044,297 | 276,559,517 | 292,966,615 | 287,799,559 | 268,662,130 | 280,287,260 | 263,933,436 | 272,381,139 | 3,274,080,084 |
| Montana | 36,368,931 | 33,333,941 | 35,144,088 | 37,638,260 | 44,820,934 | 47,473,429 | 54,989,750 | 52,374,903 | 42,823,803 | 47,278,670 | 38,610,258 | 38,754,255 | 509,611,222 |
| Nebraska | 69,434,006 | 61,295,147 | 69,106,601 | 69,318,562 | 78,598,869 | 78,455,522 | 82,428,614 | 80,466,145 | 75,359,147 | 75,037,035 | 69,733,638 | 75,317,954 | 884,551,240 |
| Nevada | 83,004,838 | 77,892,424 | 85,742,393 | 84,356,512 | 91,584,745 | 90,805,879 | 96,188,826 | 95,701,846 | 90,277,761 | 92,529,944 | 85,063,579 | 89,408,836 | 1,062,557,583 |
| New Hampshire | 62,511,024 | 53,614,132 | 57,446,941 | 54,887,564 | 60,280,454 | 60,978,933 | 68,222,031 | 68,327,435 | 58,869,368 | 62,721,812 | 56,338,997 | 61,335,201 | 725,533,892 |
| New Jersey | 332,181,571 | 298,657,581 | 380,656,695 | 343,723,543 | 356,281,190 | 368,666,019 | 364,199,514 | 394,576,238 | 356,297,962 | 286,555,171 | 342,266,505 | 374,250,486 | 4,198,312,475 |
| New Mexico | 61,984,109 | 93,910,691 | 80,995,675 | 81,775,143 | 70,936,489 | 95,029,353 | 88,522,740 | 38,784,508 | 107,398,979 | 39,215,679 | 137,507,228 | 74,874,860 | 970,935,454 |
| New York | 494,706,226 | 400,380,329 | 464,433,235 | 467,898,920 | 512,946,644 | 479,751,866 | 560,027,929 | 507,483,676 | 474,953,507 | 500,441,247 | 504,578,928 | 513,185,264 | 5,880,787,771 |
| North Carolina | 350,646,559 | 309,802,532 | 352,648,884 | 352,763,967 | 382,431,088 | 368,673,191 | 392,731,628 | 396,929,704 | 364,449,030 | 383,699,955 | 356,886,799 | 373,496,786 | 4,385,160,123 |
| North Dakota | 27,262,004 | 27,045,579 | 26,845,811 | 28,765,304 | 32,217,012 | 32,208,256 | 36,752,073 | 36,048,530 | 30,689,154 | 31,914,233 | 32,317,322 | 31,229,492 | 373,294,770 |
| Ohio | 419,783,041 | 376,965,417 | 429,682,208 | 431,948,345 | 464,289,462 | 453,298,965 | 471,830,182 | 477,949,555 | 443,040,753 | 460,322,113 | 426,747,863 | 446,328,591 | 5,302,186,495 |
| Oklahoma | 142,846,395 | 134,664,391 | 158,827,319 | 161,951,418 | 158,975,995 | 130,567,197 | 187,939,385 | 161,514,244 | 150,160,864 | 159,385,464 | 147,615,670 | 157,493,420 | 1,851,941,762 |
| Oregon | 118,874,503 | 120,370,706 | 121,069,278 | 121,049,314 | 140,009,612 | 139,065,264 | 140,254,538 | 149,340,759 | 129,947,119 | 108,812,025 | 150,871,982 | 122,777,631 | 1,562,442,731 |
| Pennsylvania | 413,168,517 | 367,850,913 | 416,186,888 | 429,643,142 | 458,023,812 | 440,616,030 | 469,428,916 | 474,332,594 | 430,870,684 | 459,499,638 | 433,136,920 | 439,879,175 | 5,232,637,229 |
| Rhode Island | 34,574,946 | 30,378,744 | 33,989,365 | 33,899,119 | 35,998,158 | 34,948,079 | 38,031,148 | 37,065,239 | 34,077,319 | 35,623,229 | 33,662,965 | 32,831,547 | 415,079,858 |
| South Carolina | 184,286,830 | 174,967,999 | 196,203,860 | 200,423,469 | 208,001,016 | 202,176,521 | 212,270,021 | 212,259,683 | 196,166,713 | 205,174,395 | 191,297,742 | 206,076,937 | 2,389,305,186 |
| South Dakota | 34,176,231 | 30,282,336 | 32,639,118 | 34,276,791 | 40,937,840 | 41,428,938 | 32,777,545 | 45,592,008 | 38,387,122 | 39,512,639 | 34,537,248 | 36,143,638 | 440,691,454 |
| Tennessee | 258,671,073 | 196,703,337 | 220,735,842 | 276,332,007 | 284,082,691 | 271,196,639 | 269,839,382 | 272,422,683 | 270,164,628 | 244,364,305 | 273,058,689 | 258,766,436 | 3,096,337,712 |
| Texas | 923,631,394 | 840,241,321 | 965,094,864 | 950,296,699 | 1,015,048,374 | 968,079,830 | 997,891,242 | 1,011,445,406 | 943,471,870 | 982,457,752 | 939,496,882 | 980,116,729 | 11,517,272,363 |
| Utah | 74,238,159 | 77,171,637 | 87,888,674 | 82,756,923 | 88,883,034 | 88,518,946 | 95,408,222 | 96,120,257 | 84,308,277 | 98,717,665 | 80,782,268 | 91,424,243 | 1,046,218,305 |
| Vermont | 30,749,294 | 26,798,621 | 27,752,619 | 25,140,555 | 29,766,187 | 29,701,536 | 32,987,377 | 33,299,569 | 29,609,607 | 32,146,179 | 26,323,644 | 29,262,494 | 353,537,682 |
| Virginia | 304,039,460 | 268,876,397 | 318,070,163 | 433,020,627 | 235,212,797 | 383,753,051 | 359,349,309 | 329,965,996 | 327,279,047 | 350,299,951 | 325,146,606 | 337,293,185 | 3,972,306,589 |
| Washington | 218,848,024 | 206,267,297 | 219,783,380 | 220,599,007 | 242,505,168 | 243,532,908 | 247,122,689 | 250,605,096 | 228,215,134 | 237,009,066 | 219,647,253 | 226,017,398 | 2,760,152,420 |
| West Virginia | 46,296,468 | 68,753,149 | 71,311,329 | 61,727,129 | 57,683,136 | 91,316,989 | 84,995,932 | 73,115,741 | 72,815,633 | 39,382,622 | 97,893,109 | 71,452,596 | 836,743,833 |
| Wisconsin | 206,064,030 | 180,633,829 | 202,897,258 | 198,715,461 | 225,232,370 | 228,533,230 | 250,742,514 | 243,915,878 | 201,966,935 | 231,594,575 | 207,438,094 | 218,547,091 | 2,596,281,265 |
| Wyoming | 23,987,703 | 21,156,797 | 31,539,187 | 20,451,402 | 21,132,839 | 30,785,099 | 27,471,025 | 28,633,137 | 41,758,433 | 40,465,765 | 33,934,300 | 31,110,444 | 352,426,131 |
| U.S. Total | 11,131,244,575 | 10,205,236,294 | 11,268,886,455 | 11,400,556,442 | 12,036,107,782 | 11,922,365,025 | 12,295,387,687 | 12,341,967,173 | 11,611,829,782 | 11,598,993,296 | 11,649,195,485 | 11,865,558,931 | 139,327,328,927 |
| Puerto Rico | 91,070,552 | 84,756,152 | 115,928,755 | 87,527,954 | 98,704,357 | 80,139,143 | 100,919,340 | 106,183,155 | 92,659,220 | 105,694,270 | 106,930,208 | 107,011,425 | 1,177,524,531 |
| Grand Total | 11,222,315,127 | 10,289,992,446 | 11,384,815,210 | 11,488,084,396 | 12,134,812,139 | 12,002,504,168 | 12,396,307,027 | 12,448,150,328 | 11,704,489,002 | 11,704,687,566 | 11,756,125,693 | 11,972,570,356 | 140,504,853,458 |
| Monthly Motor Fuel Reported by States | December 2004 |
| Created On: 10/21/2005 | (GALLONS) | TABLE MF-33SF December 2004 Reporting Period |
| STATE |
JANUARY (52 Entities) |
FEBRUARY (52 Entities) |
MARCH (51 Entities) |
APRIL (51 Entities) |
MAY (51 Entities) |
JUNE (51 Entities) |
JULY (51 Entities) |
AUGUST (51 Entities) |
SEPTEMBER (51 Entities) |
OCTOBER (50 Entities) |
NOVEMBER (50 Entities) |
DECEMBER (50 Entities) |
TOTAL 2/ |
|---|---|---|---|---|---|---|---|---|---|---|---|---|---|
|
1/ This table shows gross volume of special fuels (primarily diesel fuel with small amounts of liquefied petroleum gas) reported by the State motor fuel tax agencies. To the extent possible, fuel consumed by Federal, State, and local government agencies and all nonhighway use has been excluded from this table. Further adjustments may be made during the year-end analysis. In many cases, the data reflect retail sales, but a number of States tax special fuels at the wholesale level. In some cases, corrections for interstate motor carrier use have not been made. When interstate motor carrier fuel volume is reported quarterly to FHWA, the volume is shown in the third month of the quarter. Highway use of special fuels is reported in table MF-21 in the annual report, Highway Statistics. 2/ Totals include only those States for which data are shown. |
|||||||||||||
| Alabama | 50,475,048 | 79,200,628 | 64,283,914 | 57,476,804 | 55,494,768 | 82,943,376 | 54,659,020 | 55,908,236 | 86,144,421 | 65,498,997 | 74,498,208 | 64,150,345 | 790,733,765 |
| Alaska | 9,545,182 | 13,434,967 | 17,776,975 | 12,045,882 | 11,870,943 | 17,598,470 | 28,500,973 | 31,071,215 | 23,339,009 | 11,488,364 | 17,808,410 | 15,252,196 | 209,732,586 |
| Arizona | 67,095,006 | 51,908,753 | 63,183,703 | 63,654,110 | 63,457,328 | 62,573,688 | 64,759,906 | 72,033,068 | 62,282,401 | 72,457,644 | 62,571,816 | 74,813,452 | 780,790,875 |
| Arkansas | 44,288,548 | 43,898,985 | 60,011,758 | 48,813,710 | 48,497,145 | 55,295,022 | 50,318,316 | 47,310,487 | 57,652,128 | 21,003,598 | 73,072,565 | 51,831,798 | 601,994,060 |
| California | 209,442,771 | 183,525,057 | 265,715,656 | 252,868,796 | 227,586,297 | 277,955,773 | 251,676,485 | 242,883,482 | 284,263,718 | 212,859,502 | 205,899,016 | 294,060,727 | 2,908,737,280 |
| Colorado | 34,959,339 | 36,136,829 | 41,156,989 | 41,880,172 | 41,547,681 | 44,380,295 | 45,510,529 | 45,128,197 | 46,479,176 | 44,869,003 | 41,600,508 | 44,383,721 | 508,032,439 |
| Connecticut | 19,413,458 | 17,440,816 | 27,774,474 | 19,571,311 | 18,141,596 | 32,881,157 | 21,183,619 | 21,841,868 | 32,751,281 | 20,398,825 | 21,491,290 | 32,923,599 | 285,813,294 |
| Delaware | 5,123,560 | 4,922,734 | 5,554,125 | 5,567,202 | 5,580,730 | 5,713,251 | 5,362,746 | 5,437,176 | 5,731,210 | 5,672,123 | 5,612,842 | 5,315,778 | 65,593,477 |
| District of Columbia | 2,145,538 | 1,901,958 | 2,413,770 | 1,863,527 | 1,840,614 | 2,000,905 | 2,069,710 | 2,194,882 | 2,083,808 | 1,821,986 | 1,974,435 | 2,102,277 | 24,413,410 |
| Florida | 104,516,569 | 138,181,073 | 120,686,583 | 141,986,296 | 134,004,436 | 131,715,284 | 128,667,751 | 113,166,908 | 149,112,619 | 133,766,950 | 138,112,123 | 142,390,392 | 1,576,306,984 |
| Georgia | 116,983,108 | 145,716,085 | 108,469,463 | 133,774,532 | 77,588,907 | 147,677,914 | 112,263,617 | 95,380,688 | 139,764,345 | 148,992,942 | 106,951,051 | 128,418,601 | 1,461,981,253 |
| Hawaii | 3,334,484 | 3,331,665 | 3,294,727 | 3,029,121 | 3,679,312 | 4,116,111 | 3,804,162 | 4,570,445 | 3,790,533 | 4,083,130 | 3,956,619 | 3,009,278 | 43,999,587 |
| Idaho | 20,301,844 | 14,187,216 | 19,851,040 | 18,317,356 | 16,735,864 | 23,054,432 | 20,372,976 | 16,102,356 | 23,868,140 | 24,195,380 | 17,830,548 | 24,616,660 | 239,433,812 |
| Illinois | 90,395,639 | 85,740,660 | 136,014,013 | 102,548,251 | 91,698,076 | 169,295,951 | 91,094,974 | 95,203,187 | 153,306,870 | 98,828,050 | 93,432,089 | 193,874,485 | 1,401,432,245 |
| Indiana | 98,924,284 | 109,510,436 | 99,846,284 | 111,251,358 | 116,910,838 | 93,314,036 | 98,319,279 | 117,337,641 | 87,686,643 | 114,706,694 | 115,297,007 | 86,883,141 | 1,249,987,641 |
| Iowa | 44,803,775 | 40,797,300 | 35,532,130 | 51,508,719 | 48,119,280 | 41,504,942 | 48,496,448 | 51,166,504 | 52,971,330 | 54,630,893 | 49,761,293 | 54,446,842 | 573,739,456 |
| Kansas | 29,935,728 | 25,141,946 | 42,788,342 | 34,178,727 | 31,632,502 | 29,535,387 | 53,650,661 | 29,721,355 | 35,344,556 | 33,752,563 | 24,508,045 | 44,601,058 | 414,790,870 |
| Kentucky | 68,352,913 | 60,819,791 | 78,457,762 | 65,784,439 | 86,464,343 | 81,043,873 | 63,659,464 | 68,862,894 | 75,731,169 | 68,651,810 | 66,025,732 | 73,228,889 | 857,083,079 |
| Louisiana | 48,409,244 | 51,610,789 | 62,602,154 | 54,579,593 | 56,954,092 | 64,823,279 | 57,665,874 | 60,764,250 | 54,413,050 | 60,192,558 | 60,093,633 | 61,487,991 | 693,596,507 |
| Maine | 12,329,139 | 14,659,527 | 13,446,397 | 13,955,515 | 14,577,984 | 14,577,984 | 16,724,494 | 13,402,022 | 15,840,764 | 14,916,537 | 17,297,791 | 13,627,171 | 175,355,325 |
| Maryland | 42,228,071 | 40,255,848 | 46,424,226 | 43,485,124 | 47,872,565 | 43,985,254 | 47,727,042 | 48,753,233 | 44,735,645 | 46,140,010 | 43,760,442 | 45,723,668 | 541,091,128 |
| Massachusetts | 31,521,507 | 34,115,452 | 34,074,610 | 35,874,028 | 37,778,062 | 34,169,749 | 34,291,433 | 37,988,825 | 34,322,859 | 34,705,760 | 40,085,981 | 36,105,212 | 425,033,478 |
| Michigan | 75,479,574 | 81,948,171 | 68,972,275 | 86,209,043 | 87,107,762 | 81,154,484 | 84,929,826 | 89,528,371 | 78,173,859 | 88,420,289 | 87,937,052 | 69,130,711 | 978,991,417 |
| Minnesota | 53,846,071 | 47,472,946 | 50,251,231 | 53,498,868 | 55,932,905 | 53,349,033 | 57,635,045 | 59,094,264 | 59,398,901 | 61,807,447 | 56,624,365 | 55,554,706 | 664,465,782 |
| Mississippi | 42,048,190 | 49,160,342 | 53,950,935 | 55,872,745 | 49,637,365 | 44,871,474 | 52,480,648 | 58,304,603 | 51,552,782 | 46,675,180 | 42,324,589 | 53,187,439 | 600,066,292 |
| Missouri | 84,020,834 | 71,400,218 | 71,400,218 | 90,403,660 | 78,818,368 | 89,744,475 | 85,434,831 | 85,967,405 | 94,096,412 | 95,778,355 | 84,223,797 | 88,228,568 | 1,019,517,141 |
| Montana | 17,355,233 | 14,563,939 | 16,721,086 | 18,884,288 | 17,354,403 | 18,171,379 | 23,605,290 | 20,341,659 | 20,095,499 | 23,390,127 | 15,278,281 | 17,874,455 | 223,635,639 |
| Nebraska | 26,814,956 | 25,442,892 | 38,187,916 | 32,315,505 | 33,864,361 | 39,394,993 | 32,481,097 | 31,977,701 | 36,344,083 | 35,249,990 | 34,233,286 | 37,785,616 | 404,092,396 |
| Nevada | 24,310,722 | 22,233,656 | 21,241,349 | 30,379,160 | 29,942,674 | 30,883,526 | 29,903,529 | 31,157,990 | 27,981,486 | 33,301,481 | 31,516,563 | 19,266,166 | 332,118,302 |
| New Hampshire | 8,929,253 | 7,323,681 | 8,126,234 | 7,809,478 | 10,178,656 | 9,262,748 | 9,086,651 | 10,993,178 | 10,319,097 | 9,194,713 | 9,710,339 | 11,197,069 | 112,131,097 |
| New Jersey | 64,171,653 | 75,525,967 | 72,960,753 | 77,490,782 | 83,817,252 | 78,650,614 | 76,452,847 | 85,729,460 | 63,252,222 | 74,453,939 | 71,099,520 | 74,932,372 | 898,537,381 |
| New Mexico | 14,524,868 | 62,818,725 | 37,564,524 | 38,179,407 | 46,568,255 | 39,420,533 | 26,784,724 | 44,486,172 | 39,380,757 | 49,156,894 | 27,955,447 | 40,160,300 | 467,000,606 |
| New York | 119,462,802 | 105,057,570 | 142,372,758 | 103,602,893 | 98,020,796 | 140,043,644 | 95,585,967 | 96,445,931 | 148,244,429 | 102,388,282 | 104,657,771 | 159,640,988 | 1,415,523,831 |
| North Carolina | 93,211,598 | 88,803,816 | 87,019,215 | 102,435,291 | 70,431,729 | 97,681,585 | 91,329,684 | 88,403,122 | 96,946,264 | 97,163,836 | 93,764,413 | 94,068,624 | 1,101,259,177 |
| North Dakota | 9,112,184 | 13,513,686 | 11,904,149 | 14,474,901 | 12,860,453 | 12,741,462 | 13,758,085 | 13,255,391 | 13,529,730 | 16,426,630 | 15,610,167 | 9,868,267 | 157,055,105 |
| Ohio | 134,981,543 | 114,792,159 | 135,421,748 | 138,753,600 | 118,810,025 | 144,268,545 | 132,246,096 | 128,711,285 | 143,528,612 | 141,027,206 | 121,078,612 | 135,401,002 | 1,589,020,433 |
| Oklahoma | 27,283,351 | -4,741,748 | 87,218,319 | 117,555,613 | -27,334,053 | 97,482,084 | 79,456,014 | 6,085,673 | 110,208,508 | 65,531,106 | -19,074,653 | 105,347,889 | 645,018,103 |
| Oregon | 40,774,535 | 41,243,119 | 43,023,247 | 43,077,061 | 43,043,784 | 44,271,283 | 45,307,925 | 45,671,647 | 45,914,015 | 43,860,043 | 43,610,305 | 44,937,781 | 524,734,745 |
| Pennsylvania | 106,012,213 | 101,250,045 | 136,120,454 | 117,227,539 | 115,380,992 | 138,946,823 | 115,948,370 | 119,025,713 | 135,799,667 | 117,575,848 | 112,962,427 | 136,870,753 | 1,453,120,844 |
| Rhode Island | 8,742,260 | 4,611,841 | 4,411,709 | 4,209,683 | 2,860,056 | 5,571,548 | 4,740,285 | 4,958,768 | 4,703,970 | 0 | 0 | 0 | 44,810,120 |
| South Carolina | 43,150,530 | 52,530,113 | 62,986,142 | 58,959,046 | 59,908,482 | 60,950,530 | 59,040,315 | 57,723,665 | 63,853,632 | 67,926,847 | 60,142,201 | 62,948,749 | 710,120,252 |
| South Dakota | 13,773,261 | 11,963,377 | 13,938,615 | 14,692,879 | 13,677,598 | 15,353,211 | 15,491,708 | 15,369,510 | 14,276,861 | 17,218,323 | 16,111,565 | 14,519,604 | 176,386,512 |
| Tennessee | 67,650,580 | 87,871,376 | 68,900,216 | 85,067,783 | 77,038,539 | 96,597,672 | 84,312,672 | 90,839,697 | 80,760,500 | 89,832,301 | 83,940,998 | 78,663,138 | 991,475,472 |
| Texas | 288,646,028 | 261,765,354 | 274,382,571 | 289,322,527 | 286,095,602 | 272,636,769 | 301,246,404 | 319,406,232 | 287,239,946 | 309,270,623 | 285,469,869 | 304,097,451 | 3,479,579,376 |
| Utah | 28,101,907 | 27,337,163 | 21,687,161 | 19,369,874 | 37,394,013 | 43,326,968 | 16,766,932 | 49,759,954 | 26,870,050 | 26,870,050 | 48,568,973 | 21,590,852 | 367,643,897 |
| Vermont | 4,596,496 | 4,087,297 | 6,381,699 | 5,150,633 | 2,520,701 | 10,539,308 | 3,343,424 | 4,281,265 | 4,305,709 | 5,711,732 | 5,133,147 | 6,170,967 | 62,222,378 |
| Virginia | 93,101,104 | 92,598,493 | 48,381,666 | 127,544,337 | 96,798,091 | 75,733,762 | 104,273,684 | 100,621,342 | 106,063,414 | 98,182,283 | 107,156,105 | 66,735,129 | 1,117,189,410 |
| Washington | 38,421,546 | 42,354,213 | 59,322,528 | 48,746,750 | 54,580,468 | 49,910,189 | 55,693,812 | 60,740,332 | 53,925,648 | 49,799,255 | 49,868,020 | 65,333,811 | 628,696,572 |
| West Virginia | 8,886,146 | 36,558,152 | 29,870,553 | 12,235,580 | 38,969,234 | 15,674,804 | 31,754,412 | 18,572,930 | 19,496,833 | 27,047,053 | 20,504,646 | 35,205,351 | 294,775,694 |
| Wisconsin | 56,351,728 | 51,391,397 | 57,044,515 | 55,862,399 | 63,525,243 | 63,210,571 | 69,531,437 | 64,479,818 | 64,895,973 | 57,848,336 | 61,257,546 | 63,206,974 | 728,605,937 |
| Wyoming | 28,998,547 | 29,212,617 | 33,545,480 | 23,818,475 | 31,106,753 | 26,409,186 | 43,268,555 | 34,876,184 | 36,983,323 | 39,209,043 | 32,764,382 | 36,457,855 | 396,650,400 |
| U.S. Total | 2,777,284,468 | 2,816,529,092 | 3,112,668,361 | 3,187,164,373 | 2,926,943,870 | 3,356,409,336 | 3,142,669,748 | 3,113,038,181 | 3,409,757,857 | 3,183,950,531 | 2,986,071,177 | 3,401,629,868 | 37,414,116,862 |
| Puerto Rico | 13,234,950 | 19,294,850 | 0 | 0 | 0 | 0 | 0 | 0 | 0 | 0 | 0 | 0 | 32,529,800 |
| Grand Total | 2,790,519,418 | 2,835,823,942 | 3,112,668,361 | 3,187,164,373 | 2,926,943,870 | 3,356,409,336 | 3,142,669,748 | 3,113,038,181 | 3,409,757,857 | 3,183,950,531 | 2,986,071,177 | 3,401,629,868 | 37,446,646,662 |
| Monthly Motor Fuel Reported by States | December 2004 |
| Created On: 10/21/2005 | (GALLONS) | TABLE MF-33SF December 2004 Reporting Period |
| STATE |
JANUARY (52 Entities) |
FEBRUARY (52 Entities) |
MARCH (52 Entities) |
APRIL (52 Entities) |
MAY (52 Entities) |
JUNE (52 Entities) |
JULY (52 Entities) |
AUGUST (52 Entities) |
SEPTEMBER (52 Entities) |
OCTOBER (52 Entities) |
NOVEMBER (52 Entities) |
DECEMBER (52 Entities) |
TOTAL 2/ |
|---|---|---|---|---|---|---|---|---|---|---|---|---|---|
|
1/ This table shows gross volume of special fuels (primarily diesel fuel with small amounts of liquefied petroleum gas) reported by the State motor fuel tax agencies. To the extent possible, fuel consumed by Federal, State, and local government agencies and all nonhighway use has been excluded from this table. Further adjustments may be made during the year-end analysis. In many cases, the data reflect retail sales, but a number of States tax special fuels at the wholesale level. In some cases, corrections for interstate motor carrier use have not been made. When interstate motor carrier fuel volume is reported quarterly to FHWA, the volume is shown in the third month of the quarter. Highway use of special fuels is reported in table MF-21 in the annual report, Highway Statistics. 2/ Totals include only those States for which data are shown. |
|||||||||||||
| Alabama | 49,620,262 | 86,590,596 | 52,769,103 | 46,482,465 | 65,371,489 | 58,001,553 | 52,016,912 | 73,534,145 | 59,530,537 | 51,983,021 | 80,247,168 | 58,835,957 | 734,983,208 |
| Alaska | 18,782,227 | 12,163,381 | 11,375,232 | 1,383,418 | 12,157,799 | -42,197,071 | 21,344,402 | 19,165,724 | 21,922,234 | 9,086,820 | 7,494,529 | -339,171 | 92,339,524 |
| Arizona | 59,526,407 | 50,099,005 | 62,728,817 | 62,842,404 | 57,254,865 | 66,659,290 | 60,393,847 | 59,827,581 | 57,149,306 | 64,726,446 | 68,632,338 | 64,173,560 | 734,013,866 |
| Arkansas | 45,444,908 | 45,714,254 | 47,154,430 | 53,673,327 | 49,332,804 | 51,350,467 | 50,015,601 | 47,301,563 | 51,909,303 | 5,127,907 | 94,392,097 | 49,192,431 | 590,609,092 |
| California | 206,688,200 | 183,698,432 | 201,228,341 | 228,572,956 | 225,969,961 | 232,016,714 | 255,650,676 | 231,072,678 | 240,032,813 | 257,957,962 | 165,978,811 | 259,387,532 | 2,688,255,076 |
| Colorado | 35,290,446 | 33,328,729 | 37,368,685 | 35,665,765 | 41,619,096 | 43,735,675 | 43,032,249 | 42,758,302 | 43,371,015 | 42,706,418 | 36,104,442 | 40,405,307 | 475,386,129 |
| Connecticut | 18,725,631 | 16,279,224 | 28,416,510 | 17,583,199 | 12,773,680 | 30,557,283 | 21,366,640 | 21,546,084 | 26,946,226 | 23,652,057 | 20,196,118 | 29,004,879 | 267,047,531 |
| Delaware | 5,923,723 | 6,254,343 | 5,069,110 | 4,796,751 | 5,614,752 | 4,895,887 | 4,956,396 | 4,821,608 | 5,817,277 | 5,804,912 | 4,890,355 | 4,940,605 | 63,785,719 |
| District of Columbia | 2,871,725 | 1,951,740 | 2,244,672 | 2,029,863 | 2,187,056 | 2,067,354 | 2,412,502 | 2,415,673 | 1,591,801 | 2,004,904 | 1,820,336 | 2,112,480 | 25,710,106 |
| Florida | 112,165,790 | 124,542,255 | 117,165,380 | 116,397,058 | 123,480,814 | 118,850,746 | 114,415,878 | 118,307,128 | 117,527,352 | 120,415,202 | 130,879,803 | 118,516,039 | 1,432,663,445 |
| Georgia | 158,891,009 | 100,249,100 | 100,754,531 | 135,249,989 | 79,390,786 | 121,427,194 | 113,502,533 | 106,245,031 | 125,105,066 | 171,028,421 | 114,934,918 | 110,002,158 | 1,436,780,736 |
| Hawaii | 2,865,119 | 1,676,842 | 4,026,285 | 2,566,970 | 2,904,826 | 3,269,403 | 3,015,852 | 3,524,113 | 3,208,562 | 2,877,471 | 3,427,504 | 3,297,621 | 36,660,568 |
| Idaho | 20,786,384 | 14,404,556 | 19,947,520 | 16,845,192 | 13,218,288 | 18,638,280 | 20,933,064 | 17,166,912 | 25,073,668 | 22,421,912 | 15,685,400 | 24,924,712 | 230,045,888 |
| Illinois | 86,289,866 | 77,054,953 | 147,093,497 | 92,725,182 | 88,646,845 | 172,979,442 | 94,991,987 | 105,786,395 | 188,499,238 | 104,787,536 | 94,066,305 | 154,084,655 | 1,407,005,901 |
| Indiana | 100,141,190 | 95,797,920 | 94,827,499 | 98,605,840 | 108,130,037 | 70,966,040 | 96,968,121 | 106,226,098 | 83,819,927 | 114,468,102 | 99,940,481 | 91,708,328 | 1,161,599,583 |
| Iowa | 44,303,998 | 38,238,113 | 33,315,250 | 43,988,735 | 45,472,517 | 37,399,450 | 46,992,823 | 48,045,648 | 39,702,999 | 52,747,751 | 45,885,057 | 35,711,381 | 511,803,722 |
| Kansas | 32,718,775 | 26,951,414 | 33,384,610 | 31,120,187 | 32,818,589 | 33,726,186 | 36,945,443 | 34,471,309 | 30,902,435 | 37,998,134 | 16,689,632 | 57,178,072 | 404,904,786 |
| Kentucky | 62,677,716 | 58,934,510 | 70,475,418 | 62,841,873 | 61,829,722 | 69,246,474 | 61,990,553 | 68,501,221 | 73,185,405 | 71,744,744 | 60,436,870 | 67,666,349 | 789,530,855 |
| Louisiana | 50,889,361 | 54,356,327 | 50,500,895 | 51,834,454 | 79,159,156 | 59,837,334 | 52,603,220 | 51,704,086 | 57,580,624 | 56,075,155 | 56,988,276 | 55,691,501 | 677,220,389 |
| Maine | 11,128,044 | 17,451,535 | 9,757,462 | 18,325,740 | 16,203,240 | 21,625,932 | 20,074,178 | 21,064,230 | 16,628,379 | 16,783,279 | 20,195,975 | 13,599,704 | 202,837,698 |
| Maryland | 37,309,259 | 41,047,084 | 42,081,985 | 41,355,743 | 44,939,486 | 43,001,555 | 42,887,082 | 46,473,800 | 42,231,781 | 45,229,761 | 42,283,675 | 43,074,986 | 511,916,197 |
| Massachusetts | 34,220,354 | 35,629,488 | 14,862,965 | 44,822,916 | 38,179,599 | 34,441,170 | 34,626,009 | 36,520,165 | 33,126,890 | 32,756,598 | 38,574,188 | 36,648,915 | 414,409,257 |
| Michigan | 83,886,738 | 66,928,607 | 57,965,705 | 91,032,708 | 87,721,490 | 76,918,023 | 75,545,630 | 89,021,447 | 76,179,356 | 88,046,728 | 75,051,869 | 77,397,810 | 945,696,111 |
| Minnesota | 49,926,947 | 44,148,730 | 48,558,537 | 49,536,665 | 54,548,936 | 55,134,218 | 56,536,712 | 57,558,449 | 59,408,231 | 65,885,401 | 51,020,720 | 53,042,124 | 645,305,670 |
| Mississippi | 46,998,476 | 38,673,877 | 47,417,232 | 36,186,396 | 65,083,629 | 48,812,507 | 49,389,706 | 55,925,191 | 52,449,402 | 58,230,091 | 42,078,451 | 51,977,108 | 593,222,066 |
| Missouri | 82,585,001 | 66,746,678 | 77,523,882 | 84,799,638 | 76,204,980 | 77,750,584 | 84,753,719 | 79,530,968 | 88,312,846 | 94,080,245 | 77,236,159 | 83,582,118 | 973,106,818 |
| Montana | 17,833,145 | 12,477,953 | 13,319,268 | 17,108,548 | 16,293,019 | 16,564,717 | 22,964,196 | 20,987,824 | 17,981,824 | 22,170,490 | 17,394,241 | 15,617,036 | 210,712,261 |
| Nebraska | 27,422,442 | 24,132,229 | 34,183,836 | 28,257,357 | 28,141,878 | 34,905,455 | 30,499,088 | 29,045,025 | 43,084,086 | 33,650,385 | 28,409,593 | 36,329,728 | 378,061,102 |
| Nevada | 24,498,327 | 21,079,943 | 20,719,517 | 24,710,518 | 27,916,051 | 23,402,831 | 28,237,783 | 29,486,077 | 23,882,091 | 31,683,825 | 24,527,001 | 17,969,345 | 298,113,309 |
| New Hampshire | 9,704,783 | 7,316,869 | 7,604,502 | 8,254,936 | 8,254,936 | 8,193,733 | 8,187,019 | 9,594,879 | 8,694,151 | 9,549,134 | 7,866,878 | 8,897,009 | 102,118,829 |
| New Jersey | 31,916,826 | 78,377,735 | 99,937,125 | 68,851,836 | 72,028,428 | 73,289,344 | 57,883,231 | 96,016,558 | 68,626,709 | 53,254,791 | 80,621,728 | 87,875,762 | 868,680,073 |
| New Mexico | 16,418,500 | 54,610,055 | 35,237,926 | 32,286,553 | 37,064,848 | 37,826,539 | 36,000,210 | 18,285,282 | 48,841,545 | 16,142,345 | 67,457,751 | 40,103,530 | 440,275,084 |
| New York | 90,719,031 | 67,853,935 | 116,966,956 | 84,412,448 | 92,270,243 | 136,642,481 | 95,801,395 | 94,482,450 | 133,061,757 | 108,300,629 | 99,109,627 | 143,293,352 | 1,262,914,304 |
| North Carolina | 77,218,305 | 85,456,792 | 84,690,452 | 97,249,589 | 87,040,021 | 86,202,311 | 94,194,434 | 91,463,727 | 79,486,158 | 96,666,171 | 85,490,019 | 75,031,498 | 1,040,189,477 |
| North Dakota | 13,369,544 | 10,505,865 | 10,245,146 | 14,384,030 | 13,253,146 | 10,835,781 | 14,707,442 | 13,703,328 | 13,296,271 | 15,222,909 | 15,239,344 | 15,234,965 | 159,997,771 |
| Ohio | 133,053,636 | 116,684,846 | 116,725,792 | 136,625,028 | 123,756,268 | 126,756,654 | 131,854,399 | 124,598,420 | 128,014,459 | 140,944,492 | 119,084,455 | 121,965,084 | 1,520,063,533 |
| Oklahoma | 85,206,696 | 61,583,988 | 40,132,862 | 139,376,153 | 79,114,256 | 78,904,876 | 111,015,554 | -187,408 | 89,857,448 | 57,739,109 | 13,779,277 | 102,935,567 | 859,458,378 |
| Oregon | 41,693,605 | 38,884,547 | 39,493,572 | 39,551,698 | 41,228,583 | 41,789,474 | 42,294,404 | 42,089,976 | 42,423,091 | 41,904,611 | 40,371,577 | 40,429,234 | 492,154,372 |
| Pennsylvania | 108,184,251 | 93,192,995 | 119,762,308 | 112,224,747 | 111,401,418 | 134,252,243 | 115,478,711 | 114,135,805 | 132,606,059 | 123,153,096 | 105,442,106 | 120,574,105 | 1,390,407,844 |
| Rhode Island | 5,408,173 | 4,176,892 | 4,879,106 | 4,513,595 | 5,673,864 | 5,272,562 | 5,239,442 | 5,039,378 | 4,823,552 | 6,509,944 | 4,329,343 | 4,056,025 | 59,921,876 |
| South Carolina | 55,176,869 | 52,323,254 | 52,539,090 | 40,846,543 | 55,081,783 | 54,838,312 | 52,352,132 | 50,465,647 | 52,522,676 | 59,299,174 | 50,833,583 | 54,131,428 | 630,410,491 |
| South Dakota | 13,970,489 | 11,390,405 | 12,257,252 | 13,633,305 | 14,203,972 | 16,174,969 | 11,575,370 | 16,491,575 | 15,336,998 | 17,045,797 | 15,259,410 | 13,004,149 | 170,343,691 |
| Tennessee | 93,907,607 | 59,314,707 | 75,906,146 | 83,366,383 | 60,572,025 | 84,483,157 | 89,263,869 | 67,437,852 | 84,513,524 | 99,429,377 | 89,699,583 | 79,941,069 | 967,835,299 |
| Texas | 279,571,718 | 244,464,071 | 277,441,023 | 288,019,256 | 293,605,197 | 267,148,599 | 281,143,052 | 290,907,495 | 259,018,399 | 289,936,102 | 249,927,155 | 301,926,904 | 3,323,108,971 |
| Utah | 24,633,892 | 21,343,691 | 36,446,529 | 25,714,912 | 37,916,030 | 26,447,316 | 22,216,420 | 32,385,459 | 31,902,563 | 25,246,695 | 48,091,249 | 19,943,160 | 352,287,916 |
| Vermont | 4,780,254 | 5,199,367 | 6,381,699 | 3,476,011 | 3,461,164 | 8,058,404 | 2,989,034 | 7,214,080 | 7,203,965 | 6,246,017 | 4,195,542 | 7,851,178 | 67,056,715 |
| Virginia | 93,240,758 | 78,230,834 | 71,089,437 | 120,007,979 | 74,233,862 | 67,770,576 | 102,942,568 | 87,085,573 | 61,560,072 | 102,780,752 | 88,770,193 | 70,200,191 | 1,017,912,795 |
| Washington | 38,218,147 | 46,673,819 | 37,246,002 | 46,633,404 | 55,530,170 | 53,115,736 | 48,827,929 | 54,447,116 | 51,712,507 | 53,192,515 | 54,696,293 | 43,530,029 | 583,823,667 |
| West Virginia | 15,473,286 | 27,541,030 | 22,211,948 | 18,372,086 | 21,846,217 | 26,793,758 | 21,401,565 | 24,800,165 | 26,052,306 | 13,571,533 | 29,102,117 | 23,654,312 | 270,820,323 |
| Wisconsin | 49,845,654 | 48,433,233 | 52,222,645 | 52,926,393 | 57,585,747 | 55,312,476 | 61,042,694 | 58,945,165 | 61,635,160 | 62,883,536 | 56,559,069 | 59,340,821 | 676,732,593 |
| Wyoming | 24,798,577 | 22,261,300 | 39,233,862 | 21,030,266 | 27,778,667 | 35,796,927 | 29,716,051 | 32,685,396 | 35,952,709 | 34,135,089 | 39,823,039 | 39,674,941 | 382,886,824 |
| U.S. Total | 2,836,922,071 | 2,632,422,048 | 2,844,887,554 | 2,993,099,008 | 2,935,466,235 | 3,021,890,921 | 3,035,189,727 | 2,960,122,393 | 3,143,302,753 | 3,139,285,496 | 2,901,211,650 | 3,129,327,583 | 35,573,127,439 |
| Puerto Rico | 14,233,625 | 17,721,400 | 18,197,550 | 19,527,750 | 21,313,250 | 29,421,575 | 23,241,725 | 27,958,850 | 11,396,650 | 20,534,850 | 20,704,175 | 16,686,025 | 240,937,425 |
| Grand Total | 2,851,155,696 | 2,650,143,448 | 2,863,085,104 | 3,012,626,758 | 2,956,779,485 | 3,051,312,496 | 3,058,431,452 | 2,988,081,243 | 3,154,699,403 | 3,159,820,346 | 2,921,915,825 | 3,146,013,608 | 35,814,064,864 |
| Monthly Motor Fuel Reported by States | December 2004 |
| Created On: 10/21/2005 | (CENTS PER GALLONS) | TABLE MF-121T Sheet 1 of 3 December 2004 Reporting Period |
| STATE | GASOLINE | DIESEL |
LIQUEFIED PETROLEUM GAS |
GASOHOL 2/ | |||||
|---|---|---|---|---|---|---|---|---|---|
| RATE |
EFFECTIVE DATE |
RATE |
EFFECTIVE DATE |
RATE |
EFFECTIVE DATE |
RATE |
EFFECTIVE DATE |
EXEMPTION | |
| Alabama * | 16 | 01/10/1997 | 19 | 01/10/1995 | 16 | 01/10/1997 | |||
| * | 18 | 01/10/2004 | |||||||
| Alaska | 8 | 01/01/2004 | 8 | 01/01/2004 | 8 | 01/01/2004 | |||
| Arizona * | 18 | 01/07/2000 | 26 | 01/07/2000 | 18 | 01/07/2000 | |||
| Arkansas * | 21.7 | 01/09/2001 | 22.7 | 01/09/2001 | 16.5 | 01/04/1991 | 21.7 | 01/09/2001 | |
| California * | 18 | 01/01/1994 | 18 | 01/01/1994 | 6 | 01/01/1966 | 18 | 01/01/1994 | |
| Colorado * | 22 | 01/01/1991 | 20.5 | 01/01/1992 | 20.5 | 01/01/1992 | 22 | 01/01/1991 | |
| Connecticut * | 25 | 01/01/2004 | 26 | 01/01/2004 | 24 | 01/01/2004 | 1 | ||
| * | 25 | 01/07/2004 | |||||||
| Delaware * | 23 | 01/01/1995 | 22 | 01/01/1995 | 22 | 01/01/1995 | 1 | ||
| District of Columbia | 20 | 01/10/2003 | 20 | 01/10/2003 | 20 | 01/10/1994 | 20 | 01/10/1994 | |
| Florida * | 14.3 | 01/01/2004 | 14.3 | 01/01/2004 | 14.1 | 01/01/2003 | 14.3 | 01/01/2004 | |
| Georgia | 7.5 | 01/07/1971 | 7.5 | 01/07/1971 | 7.5 | 01/07/1971 | 7.5 | 01/07/1971 | |
| Hawaii * | 16 | 01/08/1995 | 16 | 01/08/1995 | 5.3 | 01/03/2002 | 16 | 01/07/1991 | |
| * | 5.2 | 01/07/2004 | |||||||
| Idaho * | 25 | 01/01/1996 | 25 | 01/01/1996 | 18.1 | 01/01/1996 | 22.5 | 01/01/1996 | 3 |
| Illinois * | 19 | 01/01/1990 | 21.5 | 01/01/1990 | 19 | 01/01/1990 | 19 | 01/01/1990 | |
| Indiana * | 18 | 01/01/2003 | 16 | 01/01/1993 | 18 | 01/01/2003 | |||
| Iowa * | 20.3 | 01/07/2003 | 22.5 | 01/01/1989 | 20 | 01/01/1989 | 19 | 01/01/1989 | 1 |
| * | 20.5 | 01/07/2004 | |||||||
| Kansas * | 24 | 01/07/2003 | 26 | 01/07/2003 | 23 | 01/07/2003 | 24 | 01/07/2003 | |
| Kentucky * | 16.4 | 01/01/2004 | 13.4 | 01/01/2004 | 16.4 | 01/01/2004 | 16.4 | 01/01/2004 | |
| * | 17.4 | 01/04/2004 | 14.4 | 01/04/2004 | 17.4 | 01/04/2004 | 17.4 | 01/04/2004 | |
| * | 17.4 | 01/07/2004 | 14.4 | 01/07/2004 | 17.4 | 01/07/2004 | 17.4 | 01/07/2004 | |
| Louisiana * | 20 | 01/01/1990 | 20 | 01/01/1990 | 16 | 01/07/1993 | 20 | 01/01/1990 | |
| Maine * | 25 | 01/07/2003 | 26 | 01/07/2003 | 23 | 01/08/1999 | 2 | ||
| Maryland | 24 | 01/05/1993 | 24 | 01/07/1993 | 24 | 01/05/1992 | |||
| Massachusetts | 21 | 01/01/1991 | 21 | 01/01/1991 | 15 | 01/01/2004 | 21 | 01/01/1991 | |
| 16 | 01/04/2004 | ||||||||
| 18 | 01/07/2004 | ||||||||
| 17 | 01/10/2004 | ||||||||
| Michigan * | 19 | 01/08/1997 | 15 | 01/04/2003 | 15 | 01/01/1984 | 19 | 01/08/1997 | |
| Minnesota * | 20 | 01/06/1988 | 20 | 01/06/1988 | 15 | 01/07/1995 | 20 | 01/06/1988 | |
| Mississippi * | 18.4 | 01/08/2000 | 18.4 | 01/08/2000 | 17 | 31/01/1989 | 18.4 | 01/08/2000 | |
| * | 18.4 | 01/08/2004 | 18.4 | 01/08/2004 | 18.4 | 01/08/2004 | |||
| Missouri * | 17 | 01/04/1996 | 17 | 01/04/1996 | 17 | 01/04/1996 | |||
| Montana * | 28 | 01/07/2001 | 28 | 01/07/2001 | 28 | 01/07/2001 | |||
| Nebraska * | 24.8 | 01/01/2004 | 24.8 | 01/01/2004 | 24.8 | 01/01/2004 | 24.8 | 01/01/2004 | |
| Nevada | 24 | 01/07/1995 | 27 | 01/07/1995 | 22 | 01/07/1997 | 24 | 01/07/1995 | |
| New Hampshire * | 18 | 01/01/1998 | 18 | 01/01/1998 | 18 | 01/01/1998 | 18 | 01/01/1998 | |
| New Jersey * | 10.5 | 01/07/1988 | 13.5 | 01/07/1988 | 5.25 | 01/07/1988 | 10.5 | 01/01/1992 | |
| New Mexico * | 18.88 | 01/10/2001 | 19.88 | 01/10/2001 | 12 | 01/01/2002 | 18.88 | 01/10/2001 | |
| * | 22.88 | 01/07/2004 | |||||||
| New York * | 22.65 | 01/01/2004 | 20.85 | 01/01/2004 | 8.05 | 01/01/2002 | 22 | 01/01/2001 | 1 |
| North Carolina * | 24.3 | 01/01/2004 | 24.3 | 01/01/2004 | 24.3 | 01/01/2004 | |||
| * | 24.6 | 01/07/2004 | 24.6 | 01/07/2004 | 24.6 | 01/07/2004 | |||
| North Dakota * | 21 | 01/07/1999 | 21 | 01/07/1999 | 21 | 01/07/1999 | 21 | 01/07/1999 | |
| Ohio * | 24 | 01/07/2003 | 24 | 01/07/2003 | 24 | 01/07/2003 | 24 | 01/07/2003 | |
| * | 26 | 01/07/2004 | 26 | 01/07/2004 | 26 | 01/07/2004 | 26 | 01/07/2004 | |
| Oklahoma * | 16 | 01/10/1996 | 13 | 01/10/1996 | 16 | 01/10/1996 | |||
| Oregon * | 24 | 01/01/1993 | 24 | 01/01/1993 | 18.5 | 09/09/1995 | 24 | 01/09/1993 | |
| Pennsylvania * | 26.2 | 01/01/2004 | 31.2 | 01/01/2004 | 19.2 | 01/01/2004 | 26.2 | 01/01/2004 | |
| Rhode Island * | 30 | 01/01/2004 | 30 | 01/01/2004 | 30 | 01/01/2004 | 30 | 01/01/2004 | |
| South Carolina | 16 | 01/07/1987 | 16 | 01/07/1987 | 16 | 01/07/1987 | |||
| South Dakota * | 22 | 01/04/1999 | 22 | 01/04/1999 | 20 | 01/04/1999 | 20 | 01/04/1999 | 2 |
| Tennessee * | 20 | 01/07/1989 | 17 | 01/04/1990 | 14 | 01/07/1989 | 20 | 01/07/1989 | |
| Texas * | 20 | 01/10/1991 | 20 | 01/10/1991 | 15 | 01/09/1987 | 20 | 01/10/1991 | |
| Utah * | 24 | 01/07/1997 | 24 | 01/07/1997 | 24 | 01/07/1997 | 24 | 01/07/1997 | |
| Vermont * | 20 | 01/07/1999 | 26 | 01/07/2002 | 26 | 01/07/2002 | |||
| Virginia * | 17.5 | 01/07/1992 | 16 | 01/07/1992 | 16 | 01/07/1998 | 17.5 | 01/07/1992 | |
| Washington * | 28 | 01/07/2003 | 28 | 01/07/2003 | 28 | 01/01/2004 | 28 | 01/07/2003 | |
| * | 28 | 03/07/2004 | 28 | 03/07/2004 | |||||
| * | 23 | 03/07/2004 | |||||||
| West Virginia * | 25 | 01/01/2004 | 25 | 01/01/2004 | 25 | 01/01/2004 | 25 | 01/01/2004 | |
| Wisconsin * | 28 | 01/04/2003 | 28 | 01/04/2003 | 21 | 01/04/2003 | 28 | 01/04/2003 | |
| * | 29 | 01/04/2004 | 29 | 01/04/2004 | 21 | 01/04/2004 | 29 | 01/04/2004 | |
| Wyoming * | 14 | 01/07/2002 | 14 | 01/07/1998 | 14 | 01/07/1998 | 14 | 01/07/1998 | |
| Puerto Rico | 16 | 01/07/1975 | 8 | 01/07/1994 | |||||
| Mean | 20.46 | 20.685 | 17.371 | 20.566 | |||||
| Weighted Average | 19.469 | 19.854 | 11.277 | 20.617 | |||||
| Federal Tax | 18.4 | 01/10/1997 | 24.4 | 01/10/1997 | 13.6 | 01/10/1997 | 13.2 | 01/01/2003 | 5 |
| Monthly Motor Fuel Reported by States | December 2004 |
| Created On: 10/21/2005 | TABLE MF-121T Sheet 2 of 3 December 2004 Reporting Period |
|
1/ This table shows motor-fuel tax rates in effect as of January 1, and any subsequent changes that have occurred through the date shown in the title. Only taxes that are levied as a dollar amount per volume of motor fuel are included on sheet 1. Taxes that apply to all pteroleum products without distinguishing motor fuel are omitted. Local option taxes are included only when they have been adapted uniformly Statewide. 2/ The gasohol rates shown are for gasoline blended with 10 percent ethanol. This table displays gasohol exemptions based on tax rates of gasoline and gasohol in effect as of January 1. |
|
For States marked with an asterisk on table MF-121T Sheet 1, see the notes below: |
|
| Alabama | The gasoline, gasohol, and diesel rates include a 2 cents per gallon inspection fee. Alabama-registered LPG vehicles pay an annual fee based on vehicle type in lieu of the volume tax. |
| Arizona | The fuel tax on diesel remains at 18 cents per gallon for light and exempt vehicles, but is set at 27 cents per gallon if used to propel a truck with more than two axles or with a declared gross weight over 26,000 pounds. |
| Arkansas | The gasoline, gasohol, and diesel rates include 0.4 cents per gallon Environmental Assurance Fee. Applicants for LPG user permits must pay a fee in lieu of the volume tax. |
| California | LPG users may pay an annual fee in lieu of the volume tax. |
| Colorado | Owners of LPG vehicles registered in the State must pay an annual fee in lieu of the volume tax. |
| Connecticut | The tax is computed at 5% of the gross earnings from the first sale of a petroleum product in the State. |
| Delaware | The tax rate varies annually based on the average wholesale price of gasoline for the previous year. |
| Florida | Tax rates are variable, adjusted annually. For gasoline and gasohol, in addition to the rates shown, there is a State-imposed State Comprehensive Enhanced Transportation System (SCETS) tax that varies by the county from 0-5.0 cents per gallon. All counties levy the SCETS tax on gasoline, but a few levy less than the maximum rate. LPG vehicles registered in the State pay an annual fee in lieu of the tax on alternative fuels and the SCETS tax. |
| Hawaii | Effective 01/01/02, alternative fuels pay an amount proportional to the diesel tax as follows: .29 for ethanol, .5 for bio-diesel, and .33 for LPG. An additional 1 cent is added to these amounts, and then rounded to the nearest 1 cent. |
| Idaho | LPG users may pay an annual fee based on vehicle weight in lieu of volume tax. |
| Illinois | Motor carriers pay an additional 6.3 cents per gallon on gasoline, 6.5 cents on diesel, and 5.9 cents on LPG. |
| Indiana | Motor carriers pay an additional 11 cents per gallon. LPG vehicles pay an annual fee. |
| Iowa | Effective 07/01/02, motor fuel tax rates will be adjusted annually based on the amounts of ethanol blended gasoline being sold and distributed annually. |
| Kansas | LPG users may pay an annual fee based on mileage and gross vehicle weight in lieu of the volume tax. |
| Kentucky | Tax rates are variable, adjusted quarterly. A 2 percent surtax is imposed on gasoline and 4.7 percent on special fuels for any vehicle with 3 or more axles. The gasoline, gasohol, and diesel rates include 1.4 cents per gallon Petroleum Environmental Assurance Fee. |
| Louisiana | Owners of LPG vehicles of 10,000 pounds or less gross vehicle weight pay an annual fee based on mileage. |
| Maine | Rates are variable, adjusted every February based on past years Consumer Price Index. Rates are efective on the following July 1. |
| Michigan | For vehicles defined under the Motor Carrier Fuel Tax Act, diesel fuel is discounted 6 cents per gallon at the pump; and assessed a 12 cents per gallon surcharge on a quarterly return, with a provision for a 6 cent per gallon refund on fuel purchased in Michigan. |
| Minnesota | There is a credit to the wholesaler of 15 cents per gallon of alcohol used to make gasohol. |
| Mississippi | The gasoline, gasohol, and diesel rates include 0.4 cents per gallon dedicated to the Groundwater Protection Trust Fund. |
| Missouri | LPG vehicles 18,000 pounds or less gross vehicle weight registered in the State pay an annual fee in lieu of the volume tax. |
| Montana | LPG vehicles registed in the State pay an annual fee based on gross weight in lieu of the volume tax. Out-of-State vehicles purchase trip permits. There is an alcohol distiller credit of 30 cents per gallon of alcohol produced in the State with State agricultural products and used to make gasohol. |
| Nebraska | Rates are variable, adjusted quarterly. The gasoline and gasohol include 0.6 cents per gallon and diesel rate includes 0.2 cents per gallon Petroleum Release Remedial Action Fee. Effective 01/01/02, new Nebraska ethanol production facilities may receive an ethanol production credit equal to 18 cents per gallon of ethanol used to fuel motor vehicles. |
| New Hampshire | The gasoline, gasohol, and diesel rates include 0.7 cents per gallon Oil Discharge and Disposal Cleanup Fee. Alternative fuel vehicles pay twice the usual registration fee in lieu of the volume tax. |
| New Jersey | In addition to the rates shown, there is a Petroleum Products Gross Receipts Tax. The tax is computed on a cents-per-gallon basis and is applicable to a wide variety of petroleum products. |
| New Mexico | The gasoline, gasohol, and diesel rates include the Petroleum Products Loading Fee of $150 per 8,000 gallons (1.875 cents per gallon). Owners of LPG-powered vehicles up to 54,000 pounds gross vehicle weight may pay an annual fee in lieu of the volume tax. |
| New York | Rates are variable, adjusted annually. Rates include the Petroleum Business Tax of 14.6 cents per gallon. The gasoline rate includes a 0.5 mill (0.05 cents) per gallon Petroleum Testing Fee. |
| North Carolina | Rates are variable, adjusted semiannually. |
| North Dakota | A special excise tax of 2% is imposed on all sales of special fuel (diesel or LPG) that are exempted from the volume tax if the fuel is sold for use in the State. There is a producer credit of 40 cents per gallon of agriculturally derived alcohol produced in the State and used to make gasohol. |
| Ohio | Commercial vehicles formerly subject to the highway use tax pay an additional 3 cents per gallon. Dealers are refunded 10 cents per gallon of each qualified fuel (ethanol or methanol) blended with unleaded gasoline. |
| Oklahoma | Rates shown include 1 cent per gallon tax dedicated to the Petroleum Underground Tank Release Environmental Cleanup Indemnity Fund. When the Fund reaches specified balance, future tax revenues will be deposited in a highway fund. The gasoline, gasohol, and LPG rates include 0.08 cents for fuel inspection. LPG users may pay an annual fee in lieu of the volume tax. |
| Oregon | The diesel and LPG rates shown are paid by users for vehicles not under the jurisdiction of Public Utility Commissioner. Vehicles under the jurisdiction of the Public Utilities Commissioner and paying motor-carrier fees are exempt from payment of the motor-fuel tax. |
| Pennsylvania | The rates include the Oil Franchise Tax for Maintenance and Construction, a variable rate tax adjusted annually. LPG rate is based on the gasolie gallon equivalent. |
| Rhode Island | Rates includes 1 cent per gallon tax for the Underground Storage Tank Financial Responsibility Fund. |
| South Dakota | There is a credit at the rate of the gasoline tax to distributors blending gasoline with ethanol to product gasohol. There is also a producer incentive payment of 20 cents per gallon. |
| Tennessee | LPG users without permits must pay in advance at the beginning of the fiscal year, others pay quarterly. Fee is based on vehice weight and fuel efficiency. Sales tax rate on aviation fuel is 4.5 percent. |
| Texas | Owners of LPG vehicles registered in the State must pay an annual fee in lieu of the volume tax. |
| Utah | LPG is tax exempt if user purchases annual exemption certificate. |
| Vermont | Diesel vehicles 10,000 pounds and over pay 26 cents per gallon. LPG vehicles are subject to a registration fee 1.75 times the usual fee. The gasoline, gasohol, and diesel rates include 1 cents per gallon for the Petroleum Cleanup Fund. |
| Virginia | Vehicles weighing 26,000 pounds or more having 3 or more axles pay an additional 3.5 cents per gallon. |
| Washington | Owners of LPG vehicles pay an annual fee. |
| West Virginia | Rates are variable, adjusted annually. |
| Wisconsin | Rates are variable, adjusted annually. |
| Wyoming | LPG is subject to sales tax. The gasoline, gasohol, and diesel rates include 1 cent for the Underground Storage Tank Corrective Action Account. |
| Monthly Motor Fuel Reported by States | December 2004 |
| Created On: 10/21/2005 | TABLE MF-121T Sheet 3 of 3 December 2004 Reporting Period |
| STATE | SALES TAX | |
|---|---|---|
| PERCENT | REMARKS | |
| Alabama | 4.0 | Applies to fuel not taxable under volume tax laws. |
| Arizona | 5.0 | Applies to fuel not taxed under the motor-fuel or fuel-use taxes. Liquified petroleum gas sold, used, or stored in State is exempt. |
| Arkansas | 4.5 | Special fuel for municipal buses and gasoline are exempt. |
| California | 6.0 | Applies to sales price including Federal and State motor-fuel taxes. |
| Colorado | 3.0 | Applies to fuel taxable under volume tax laws. |
| Connecticut | 5.0 | A Petroleum Products Gross Earnings tax is applied to many petroleum products, in addition to the per gallon taxes shown on Sheet 1. |
| District of Columbia | 5.8 | Applies to fuel not taxable under volume tax laws. |
| Georgia | 4.0 | A 3-percent second motor fuel tax and a 1-cent sales tax apply to the sales price including Federal motor-fuel tax. |
| Hawaii | 4.0 | Applies to the sales price excluding Federal and State motor fuel taxes. Alcohol fuels are exempt. |
| Idaho | 5.0 | Fuels subject to the motor fuel volume tax are exempt. |
| Indiana | 5.0 | Applies to the sales price excluding Federal and State motor fuel taxes. |
| Iowa | 5.0 | Applies to fuel not taxable under fuel tax laws, including those fuels taxable, then subject to refund. |
| Kansas | 4.9 | Applies to fuels not taxable under the volume tax laws. |
| Kentucky | 6.0 | Applies to sales price, exclusive of Federal tax, of fuels not taxable under the volume tax laws. |
| Louisiana | 4.0 | Fuels subject to volume tax are exempt. Gasohol is exempt if the alcohol is produced in the State. |
| Maine | 6.0 | Applies to motor fuel not taxed at the maximum rate for highway use under the volume tax laws. |
| Maryland | 5.0 | Applies to fuels not taxable under motor fuel tax laws, unless exempt from the sales and use tax by statute. |
| Massachusetts | 5.0 | Applies to fuels not taxable under the volume tax laws. |
| Michigan | 6.0 | Applies to sales price including Federal volume tax, except when used in a passenger vehicle with capacity of 10 or more, for-hire, over regularly scheduled routes in the State. |
| Minnesota | 6.0 | Applies to fuels not taxable under the volume tax laws. |
| Nebraska | 5.0 | Gasoline is exempt. Diesel and alternative fuels subject to the volume tax are exempt. |
| New Mexico | 5.0 | Applies to fuels not taxable under the volume tax laws. Ethanol blends deductible under the gasoline tax laws are exempt. |
| New York | 4.0 | Applies to sales price including Federal motor-fuel tax. |
| North Dakota | 5.0 | Applies to fuels not taxable under the volume tax laws. |
| Ohio | 5.0 | Applies to fuels not taxable under the volume tax laws. |
| Oklahoma | 4.5 | Applies to fuels not taxable under the volume tax laws. |
| Pennsylvania | 6.0 | Applies to fuels not taxable under the volume tax laws. |
| South Carolina | 5.0 | Applies to sales price of aviation gasoline only. |
| South Dakota | 4.0 | Applies to fuels not taxable under the volume tax laws. |
| Tennessee | 6.0 | Gasoline on which the volume tax has been paid and not refunded, and motor fuel subject to the fuel-use tax are exempt. |
| Texas | 6.3 | Applies to fuels not taxed or exempted under other laws. |
| Utah | 4.9 | Applies to fuels not taxable under the volume tax laws. |
| Washington | 6.5 | Applies to fuels not taxable under the volume tax laws. Certain providers of public transportation of handicapped persons are exempt. |
| Wisconsin | 5.0 | Applies to fuels not taxable under the volume tax laws. |
| Wyoming | 4.0 | Applies to sales price of LPG. Gasoline and diesel subject to volume tax are exempt. |
| Monthly Motor Fuel Reported by States | December 2004 |
| Created On: 10/21/2005 | (CENTS PER GALLONS) | December 2004 Reporting Period |
| COUNTRY | GASOLINE | DIESEL |
|---|---|---|
1/ Source for foreign rates is data collected by the U.S. Department
of Energy from various sources. Rates were converted to U.S. currency using
current exchange rates. |
||
| Belgium | 378 | 248 |
| France | 384 | 290 |
| Germany | 408 | 306 |
| Italy | 377 | 290 |
| Japan | 228 | 130 |
| Netherlands | 434 | 268 |
| United Kingdom | 433 | 437 |
| United States 2/ | 38 | 44 |
| Monthly Motor Fuel Reported by States | December 2004 |
Beginning with the January 1997 issue, the Federal Highway Administration (FHWA) reinstitued motor fuel price data using data collected by the U.S. Department of Energy, Energy Information Administration (EIA) as the source for Table MF-5, "Retail Prices of Motor Fuel". The IEA Table 31 - "Motor Gasoline Prices by Grade, Sales Type, PAD District (Cents per Gallon Excluding Taxes)" will be used as the base information for the FHWA Table MF-5. The EIA data, which is based on the EIA-782 survey, was implemented in 1983 to fulfill EIA legislative requirements and community data needs. The FHWA will follow EIA protocols and requirements in making the data available to "Monthly Motor Fuel" customers.
Because the "Sales to End Users- Through Retail Outlets" data does not include Federal, State, and local taxes, FHWA will add Federal motor fuel taxes to the EIA data. Federal Highway User Taxes (Table FE-21B) and State Tax Rates on Motor Fuel (Table MF-121T) are the FHWA sources for this data. Excluded from the total are other taxes such as local taxes and sales taxes applied to motor fuel, etc.
Users of Table MF-5 should consult the "Explanatory Notes" of the EIA Publication "Petroleum Marketing Monthly" (DOE/EIA-0380) before making use of the retail price information. The "Explanatory Notes" contain important information on the design of the sample, the continuity of the data, collection methods, processing, non-disclosure, and revisions.
Pre-January 1997 retail price data was furnished by a source other than EIA. Because the sample design, collection methods, processing, and other data considerations differ between the two sources, users are particularly cautioned not to make direct comparisons of the data using previous MF-5 retail price data for any trend line comparisons.
| Monthly Motor Fuel Reported by States | December 2004 |
| Created On: 10/21/2005 | (CENTS PER GALLONS) | TABLE MF-5 Sheet 1 of 2 December 2004 Reporting Period |
| STATE | JANUARY | FEBRUARY | MARCH | APRIL | MAY | JUNE | ||||||||||||
|---|---|---|---|---|---|---|---|---|---|---|---|---|---|---|---|---|---|---|
|
REG GAS |
MID GAS |
PREM GAS |
REG GAS |
MID GAS |
PREM GAS |
REG GAS |
MID GAS |
PREM GAS |
REG GAS |
MID GAS |
PREM GAS |
REG GAS |
MID GAS |
PREM GAS |
REG GAS |
MID GAS |
PREM GAS |
|
|
1/ Gasoline prices are taken from the U.S. Department of Energy, Energy Info Admin's Petroleum Marketing Monthly Report, Table 31 - Motor Gasoline Prices by Grade, Sales Type, PAD District (Cents per Gallon Excluding Taxes). Taxes have been included using Federal Highway Administration's Table MF-121T - Tax Rates on Motor Fuel and Table FE-21B Federal Highway User Taxes. Data may be withheld (W) or not available (N/A) for a few States monthly because of no disclosure. 2/ Diesel prices (dollars per gallon, including taxes) are averages from a survey conducted by the U.S. Department of Energy, Energy information Administration and reflect prices in the last week of the month shown. State level information is not available, but regional level information is updated weekly (on Mondays) and may be obtained by dialing the National Energy Information Center's fuel price hotline at 202-586-6966. |
||||||||||||||||||
| Alabama | 146.1 | 154.7 | 163.3 | 151.2 | 159.7 | 168.6 | 157.6 | 166.4 | 174.6 | 164.5 | 173.1 | 182.5 | 180.7 | 188.6 | 197.5 | 177.2 | 185.3 | 193.6 |
| Alabama | 146.100 | 151.200 | 157.600 | 164.500 | 180.700 | 177.200 | ||||||||||||
| Alaska | 173.0 | 182.0 | 191.6 | 173.2 | 182.2 | 192.4 | 172.0 | 180.5 | 191.3 | 174.8 | 188.1 | 195.1 | 197.7 | 205.3 | 217.6 | 205.8 | 213.6 | 223.8 |
| Alaska | 173.000 | 173.200 | 172.000 | 174.800 | 197.700 | 205.800 | ||||||||||||
| Arizona | 154.7 | 166.1 | 175.8 | 172.6 | 183.6 | 193.2 | 192.1 | 203.2 | 213.9 | 195.3 | 206.5 | 215.1 | 209.7 | 221.3 | 229.7 | 203.1 | 215.3 | 223.9 |
| Arizona | 154.700 | 172.600 | 192.100 | 195.300 | 209.700 | 203.100 | ||||||||||||
| Arkansas | 149.8 | 158.7 | 163.3 | 154.7 | 164.0 | 168.8 | 162.8 | 172.5 | 177.6 | 169.3 | 178.3 | 182.3 | 186.2 | 194.3 | 198.7 | 183.7 | 193.3 | 197.4 |
| Arkansas | 149.800 | 154.700 | 162.800 | 169.300 | 186.200 | 183.700 | ||||||||||||
| California | 155.7 | 169.6 | 174.8 | 179.1 | 191.9 | 197.1 | 196.6 | 209.5 | 215.8 | 199.6 | 212.7 | 218.5 | 212.0 | 224.5 | 230.6 | 211.0 | 224.0 | 230.0 |
| California | 155.700 | 179.100 | 196.600 | 199.600 | 212.000 | 211.000 | ||||||||||||
| Colorado | 149.8 | 160.7 | 170.2 | 154.7 | 165.4 | 174.9 | 168.3 | 179.4 | 189.0 | 178.6 | 187.3 | 198.6 | 193.7 | 203.6 | 213.4 | 192.7 | 203.2 | 212.8 |
| Colorado | 149.800 | 154.700 | 168.300 | 178.600 | 193.700 | 192.700 | ||||||||||||
| Connecticut | 162.8 | 171.5 | 180.7 | 167.9 | 176.8 | 186.1 | 173.8 | 182.4 | 192.2 | 176.9 | 185.5 | 195.2 | 200.5 | 207.9 | 215.9 | 206.2 | 213.7 | 223.1 |
| Connecticut | 162.800 | 167.900 | 173.800 | 176.900 | 200.500 | 206.200 | ||||||||||||
| Delaware | 153.7 | 162.9 | 171.0 | 161.7 | 171.2 | 179.0 | 166.2 | 175.4 | 183.9 | 169.8 | 179.1 | 187.6 | 192.7 | 201.6 | 210.2 | 198.5 | 207.3 | 216.6 |
| Delaware | 153.700 | 161.700 | 166.200 | 169.800 | 192.700 | 198.500 | ||||||||||||
| District of Columbia | NA | W | NA | NA | W | NA | W | W | W | NA | NA | W | NA | W | NA | W | W | W |
| District of Columbia | -2.000 | -2.000 | -1.000 | -2.000 | -2.000 | -1.000 | ||||||||||||
| Florida | 145.5 | 154.7 | 162.7 | 150.9 | 160.2 | 168.5 | 159.5 | 169.2 | 177.1 | 164.6 | 174.2 | 181.9 | 178.9 | 188.0 | 196.3 | 217.2 | 191.6 | 199.9 |
| Florida | 145.500 | 150.900 | 159.500 | 164.600 | 178.900 | 217.200 | ||||||||||||
| Georgia | 137.9 | 148.1 | 155.2 | 144.6 | 155.4 | 162.8 | 150.1 | 160.7 | 168.2 | 157.9 | 168.6 | 175.7 | 176.0 | 186.9 | 193.6 | 171.7 | 182.2 | 189.1 |
| Georgia | 137.900 | 144.600 | 150.100 | 157.900 | 176.000 | 171.700 | ||||||||||||
| Hawaii | 187.1 | 195.9 | 203.4 | 188.5 | 197.1 | 204.5 | 192.0 | 200.4 | 208.5 | 199.7 | NA | NA | 207.7 | 215.2 | 224.0 | 213.5 | 220.7 | 230.1 |
| Hawaii | 187.100 | 188.500 | 192.000 | 199.700 | 207.700 | 213.500 | ||||||||||||
| Idaho | 157.8 | 166.7 | 174.3 | 163.7 | 174.3 | 181.0 | 178.0 | 188.1 | 194.5 | 187.1 | 196.5 | 204.1 | 201.1 | 212.3 | 219.1 | 199.2 | 210.6 | 216.7 |
| Idaho | 157.800 | 163.700 | 178.000 | 187.100 | 201.100 | 199.200 | ||||||||||||
| Illinois | 154.8 | 165.6 | 174.6 | 161.0 | 172.1 | 181.2 | 165.8 | 176.0 | 185.2 | 175.1 | 185.4 | 194.8 | 193.5 | 204.2 | 214.0 | 186.1 | 197.0 | 207.6 |
| Illinois | 154.800 | 161.000 | 165.800 | 175.100 | 193.500 | 186.100 | ||||||||||||
| Indiana | 151.0 | 160.9 | 169.0 | 157.5 | 167.3 | 176.3 | 162.3 | 171.6 | 180.3 | 170.4 | 179.9 | 188.4 | 187.6 | 197.3 | 205.8 | 179.0 | 188.4 | 196.3 |
| Indiana | 151.000 | 157.500 | 162.300 | 170.400 | 187.600 | 179.000 | ||||||||||||
| Iowa | 147.2 | 155.5 | 157.9 | 152.9 | 157.6 | 162.7 | 161.2 | 167.0 | 171.5 | 167.5 | 174.6 | 178.2 | 185.7 | 193.8 | 196.6 | 177.3 | 186.4 | 189.3 |
| Iowa | 147.200 | 152.900 | 161.200 | 167.500 | 185.700 | 177.300 | ||||||||||||
| Kansas | 151.5 | 160.6 | 169.8 | 156.9 | 165.3 | 175.2 | 165.0 | 172.4 | 183.2 | 172.0 | 180.4 | 190.1 | 192.9 | 202.2 | 211.7 | 184.0 | 192.4 | 202.1 |
| Kansas | 151.500 | 156.900 | 165.000 | 172.000 | 192.900 | 184.000 | ||||||||||||
| Kentucky | 150.5 | 160.2 | 169.0 | 157.2 | 167.4 | 176.1 | 162.7 | 171.3 | 180.8 | 171.5 | 180.5 | 190.1 | 187.8 | 197.3 | 206.9 | 179.4 | 187.1 | 199.1 |
| Kentucky | 150.500 | 157.200 | 162.700 | 171.500 | 187.800 | 179.400 | ||||||||||||
| Louisiana | 146.6 | 156.0 | 163.2 | 151.1 | 160.4 | 168.1 | 158.1 | 167.7 | 176.1 | 165.1 | 174.3 | 181.0 | 181.2 | 190.0 | 198.9 | 181.7 | 190.9 | 198.5 |
| Louisiana | 146.600 | 151.100 | 158.100 | 165.100 | 181.200 | 181.700 | ||||||||||||
| Maine | 165.5 | 174.6 | 181.6 | 169.4 | 179.2 | 186.2 | 176.3 | 185.6 | 192.9 | 178.4 | 187.8 | 196.5 | 200.5 | 209.9 | 217.0 | 202.1 | 212.1 | 219.7 |
| Maine | 165.500 | 169.400 | 176.300 | 178.400 | 200.500 | 202.100 | ||||||||||||
| Maryland | 156.1 | 164.4 | 171.2 | 162.3 | 171.2 | 177.3 | 167.8 | 176.6 | 183.3 | 171.5 | 180.8 | 187.6 | 192.6 | 201.5 | 207.3 | 192.9 | 203.4 | 209.5 |
| Maryland | 156.100 | 162.300 | 167.800 | 171.500 | 192.600 | 192.900 | ||||||||||||
| Massachusetts | 156.5 | 166.4 | 174.9 | 162.9 | 172.5 | 180.9 | 167.7 | 177.1 | 185.7 | 169.7 | 179.2 | 187.7 | 194.3 | 203.0 | 210.9 | 200.8 | 209.9 | 219.6 |
| Massachusetts | 156.500 | 162.900 | 167.700 | 169.700 | 194.300 | 200.800 | ||||||||||||
| Michigan | 153.6 | 161.0 | 167.9 | 161.1 | 168.5 | 175.3 | 165.0 | 172.5 | 179.1 | 174.6 | 182.0 | 188.2 | 194.4 | 201.6 | 208.5 | 186.7 | 193.9 | 200.8 |
| Michigan | 153.600 | 161.100 | 165.000 | 174.600 | 194.400 | 186.700 | ||||||||||||
| Minnesota | 159.1 | 161.6 | 173.2 | 165.2 | 167.3 | 178.8 | 170.6 | 174.2 | 184.7 | 178.3 | 181.0 | 192.3 | 199.1 | 200.9 | 214.2 | 185.7 | 189.2 | 198.9 |
| Minnesota | 159.100 | 165.200 | 170.600 | 178.300 | 199.100 | 185.700 | ||||||||||||
| Mississippi | 150.8 | 159.2 | 168.4 | 156.2 | 165.2 | 174.2 | 163.5 | 172.6 | 181.3 | 170.0 | 178.6 | 187.4 | 186.5 | 194.5 | 203.7 | 184.2 | 192.4 | 202.0 |
| Mississippi | 150.800 | 156.200 | 163.500 | 170.000 | 186.500 | 184.200 | ||||||||||||
| Missouri | 146.6 | 158.8 | 166.3 | 146.6 | 158.8 | 166.3 | 159.9 | 171.8 | 178.9 | 165.6 | 177.5 | 184.9 | 185.6 | 198.2 | 205.4 | 174.8 | 186.0 | 193.6 |
| Missouri | 146.600 | 146.600 | 159.900 | 165.600 | 185.600 | 174.800 | ||||||||||||
| Montana | 152.8 | 162.2 | 169.1 | 157.3 | 166.9 | 173.2 | 166.9 | 176.5 | 183.3 | 179.9 | 189.0 | 196.9 | 196.9 | 206.6 | 211.5 | 194.2 | 204.6 | 211.1 |
| Montana | 152.800 | 157.300 | 166.900 | 179.900 | 196.900 | 194.200 | ||||||||||||
| Nebraska | 153.0 | 158.5 | 163.6 | 157.9 | 162.4 | 168.4 | 166.2 | 170.8 | 176.8 | 173.2 | 177.9 | 184.5 | 192.5 | 199.6 | 204.4 | 185.2 | 193.0 | 198.6 |
| Nebraska | 153.000 | 157.900 | 166.200 | 173.200 | 192.500 | 185.200 | ||||||||||||
| Nevada | 165.7 | 180.4 | 184.3 | 182.6 | 199.7 | NA | 200.4 | 217.1 | 219.1 | 204.6 | 220.7 | 223.6 | 218.6 | 234.2 | 237.5 | 215.0 | NA | 232.2 |
| Nevada | 165.700 | 182.600 | 200.400 | 204.600 | 218.600 | 215.000 | ||||||||||||
| New Hampshire | 156.0 | 166.7 | 173.8 | 161.1 | 171.8 | 179.3 | 166.2 | 176.9 | 184.0 | 167.4 | 177.7 | 185.4 | 192.3 | 203.0 | 208.8 | 197.3 | 207.9 | 215.8 |
| New Hampshire | 156.000 | 161.100 | 166.200 | 167.400 | 192.300 | 197.300 | ||||||||||||
| New Jersey | 145.2 | 156.1 | 164.4 | 151.2 | 161.8 | 170.4 | 158.0 | 168.2 | 176.7 | 161.0 | 171.6 | 180.5 | 184.5 | 194.4 | 201.7 | 194.3 | 205.0 | 213.2 |
| New Jersey | 145.200 | 151.200 | 158.000 | 161.000 | 184.500 | 194.300 | ||||||||||||
| New Mexico | 153.3 | 166.3 | 171.0 | 157.6 | 166.6 | 175.4 | 166.8 | 175.4 | 184.6 | 174.4 | 183.3 | 191.5 | 193.1 | 202.1 | 210.8 | 189.5 | 197.9 | 205.4 |
| New Mexico | 153.300 | 157.600 | 166.800 | 174.400 | 193.100 | 189.500 | ||||||||||||
| New York | 158.0 | 169.7 | 178.6 | 165.7 | 176.5 | 184.6 | 171.2 | 182.3 | 190.3 | 173.1 | 184.4 | 193.2 | 192.5 | 203.7 | 211.7 | 196.7 | 209.8 | 219.6 |
| New York | 158.000 | 165.700 | 171.200 | 173.100 | 192.500 | 196.700 | ||||||||||||
| North Carolina | 152.0 | 161.5 | 170.4 | 157.7 | 167.5 | 176.0 | 164.0 | 174.5 | 182.6 | 169.8 | 179.8 | 187.8 | 186.8 | 196.2 | 204.7 | 187.1 | 197.8 | 205.8 |
| North Carolina | 152.000 | 157.700 | 164.000 | 169.800 | 186.800 | 187.100 | ||||||||||||
| North Dakota | 156.2 | 160.2 | 163.3 | 167.2 | 168.7 | 176.4 | 173.5 | 175.1 | 183.9 | 180.7 | 182.8 | 189.6 | 199.8 | 202.1 | 209.3 | 192.6 | 193.7 | 201.4 |
| North Dakota | 156.200 | 167.200 | 173.500 | 180.700 | 199.800 | 192.600 | ||||||||||||
| Ohio | 159.1 | 169.0 | 178.5 | 165.4 | 175.9 | 185.1 | 169.9 | 179.7 | 189.2 | 178.0 | 188.2 | 197.1 | 195.7 | 205.4 | 214.3 | 184.1 | 193.8 | 202.9 |
| Ohio | 159.100 | 165.400 | 169.900 | 178.000 | 195.700 | 184.100 | ||||||||||||
| Oklahoma | 141.8 | 149.5 | 156.8 | 146.3 | 153.7 | 161.4 | 154.7 | 162.4 | 169.9 | 160.8 | 168.3 | 175.8 | 181.4 | 189.0 | 196.6 | 171.9 | 178.5 | 186.7 |
| Oklahoma | 141.800 | 146.300 | 154.700 | 160.800 | 181.400 | 171.900 | ||||||||||||
| Oregon | 164.1 | 176.7 | 184.1 | 172.0 | 183.5 | 189.7 | 178.2 | 190.0 | 198.3 | 192.6 | 202.9 | 212.1 | 219.4 | 230.8 | 239.3 | 214.2 | 225.8 | 233.9 |
| Oregon | 164.100 | 172.000 | 178.200 | 192.600 | 219.400 | 214.200 | ||||||||||||
| Pennsylvania | 156.4 | 164.5 | 173.1 | 162.2 | 170.1 | 179.0 | 168.3 | 176.2 | 184.7 | 172.1 | 179.9 | 188.3 | 193.7 | 201.6 | 210.2 | 190.2 | 200.2 | 210.0 |
| Pennsylvania | 156.400 | 162.200 | 168.300 | 172.100 | 193.700 | 190.200 | ||||||||||||
| Rhode Island | 161.8 | 171.7 | 179.7 | 168.7 | 178.6 | 186.7 | 173.7 | 183.7 | 191.8 | 175.7 | 185.8 | 193.3 | 200.8 | 210.3 | 217.4 | 206.0 | 216.8 | 225.0 |
| Rhode Island | 161.800 | 168.700 | 173.700 | 175.700 | 200.800 | 206.000 | ||||||||||||
| South Carolina | 145.1 | 156.1 | 165.8 | 150.5 | 161.7 | 171.6 | 157.7 | 168.7 | 178.1 | 164.5 | 175.6 | 185.5 | 180.4 | 191.7 | 201.9 | 181.8 | 193.1 | 203.1 |
| South Carolina | 145.100 | 150.500 | 157.700 | 164.500 | 180.400 | 181.800 | ||||||||||||
| South Dakota | 154.3 | 159.0 | 169.7 | 160.0 | 164.1 | 175.1 | 169.9 | 174.4 | 185.2 | 176.1 | 181.8 | 191.4 | 193.8 | 200.3 | 209.8 | 204.6 | 191.3 | 201.2 |
| South Dakota | 154.300 | 160.000 | 169.900 | 176.100 | 193.800 | 204.600 | ||||||||||||
| Tennessee | 148.0 | 157.7 | 165.6 | 153.4 | 163.3 | 171.4 | 159.7 | 169.8 | 177.6 | 166.8 | 176.4 | 184.4 | 182.2 | 191.5 | 200.5 | 181.8 | 192.2 | 199.8 |
| Tennessee | 148.000 | 153.400 | 159.700 | 166.800 | 182.200 | 181.800 | ||||||||||||
| Texas | 146.2 | 155.1 | 162.5 | 150.0 | 158.7 | 166.7 | 156.0 | 164.8 | 172.7 | 162.8 | 171.2 | 179.2 | 180.3 | 188.7 | 196.1 | 178.7 | 187.7 | 195.7 |
| Texas | 146.200 | 150.000 | 156.000 | 162.800 | 180.300 | 178.700 | ||||||||||||
| Utah | 152.0 | 160.7 | 169.9 | 159.2 | 168.5 | 177.6 | 174.7 | 183.8 | 193.5 | 183.4 | 192.2 | 201.6 | 194.4 | 204.2 | 212.2 | 192.6 | 202.4 | 210.4 |
| Utah | 152.000 | 159.200 | 174.700 | 183.400 | 194.400 | 192.600 | ||||||||||||
| Vermont | 161.6 | 170.4 | 178.5 | 166.9 | 175.4 | 184.3 | 173.1 | 182.3 | 187.9 | 174.4 | 183.3 | 189.1 | 196.3 | 204.5 | 213.9 | 199.7 | 207.5 | 215.7 |
| Vermont | 161.600 | 166.900 | 173.100 | 174.400 | 196.300 | 199.700 | ||||||||||||
| Virginia | 148.0 | 157.3 | 165.9 | 153.7 | 162.9 | 171.6 | 160.4 | 170.1 | 178.3 | 166.6 | 175.4 | 184.0 | 184.7 | 193.8 | 202.3 | 184.3 | 193.8 | 203.1 |
| Virginia | 148.000 | 153.700 | 160.400 | 166.600 | 184.700 | 184.300 | ||||||||||||
| Washington | 160.4 | 174.2 | 182.2 | 170.0 | 182.3 | 190.9 | 178.1 | 190.9 | 200.4 | 191.0 | 204.4 | 212.7 | 218.7 | 231.1 | 240.8 | 214.5 | 227.7 | 237.2 |
| Washington | 160.400 | 170.000 | 178.100 | 191.000 | 218.700 | 214.500 | ||||||||||||
| West Virginia | 160.8 | 169.4 | 176.5 | 166.9 | 175.4 | 182.7 | 171.4 | 179.2 | 187.6 | 178.1 | 185.8 | 193.2 | 195.4 | 203.0 | 210.6 | 191.5 | 200.7 | 208.5 |
| West Virginia | 160.800 | 166.900 | 171.400 | 178.100 | 195.400 | 191.500 | ||||||||||||
| Wisconsin | 162.7 | 165.3 | 176.7 | 168.6 | 170.9 | 182.8 | 174.5 | 177.4 | 188.2 | 183.3 | 185.6 | 198.3 | 204.1 | 208.1 | 219.6 | 196.7 | 199.3 | 211.6 |
| Wisconsin | 162.700 | 168.600 | 174.500 | 183.300 | 204.100 | 196.700 | ||||||||||||
| Wyoming | 141.2 | 151.5 | 157.3 | 149.5 | 158.7 | 165.4 | 160.0 | 169.2 | 174.7 | 168.1 | 178.0 | 184.2 | 187.2 | 195.1 | 199.2 | 183.1 | 193.7 | 199.1 |
| Wyoming | 141.200 | 149.500 | 160.000 | 168.100 | 187.200 | 183.100 | ||||||||||||
| U.S. Average Diesel 2/ | 1.6 | 0.0 | 0.0 | 1.6 | 0.0 | 0.0 | 1.7 | 0.0 | 0.0 | 1.8 | 0.0 | 0.0 | 1.8 | 0.0 | 0.0 | 1.8 | 0.0 | 0.0 |
| U.S. Average Diesel 2/ | 1.590 | 1.612 | 1.666 | 1.787 | 1.819 | 1.795 | ||||||||||||
| Monthly Motor Fuel Reported by States | December 2004 |
| Created On: 10/21/2005 | (CENTS PER GALLONS) | TABLE MF-5 Sheet 2 of 2 December 2004 Reporting Period |
| STATE | JULY | AUGUST | SEPTEMBER | OCTOBER | NOVEMBER | DECEMBER | ||||||||||||
|---|---|---|---|---|---|---|---|---|---|---|---|---|---|---|---|---|---|---|
|
REG GAS |
MID GAS |
PREM GAS |
REG GAS |
MID GAS |
PREM GAS |
REG GAS |
MID GAS |
PREM GAS |
REG GAS |
MID GAS |
PREM GAS |
REG GAS |
MID GAS |
PREM GAS |
REG GAS |
MID GAS |
PREM GAS |
|
|
1/ Gasoline prices are taken from the U.S. Department of Energy, Energy Info Admin's Petroleum Marketing Monthly Report, Table 31 - Motor Gasoline Prices by Grade, Sales Type, PAD District (Cents per Gallon Excluding Taxes). Taxes have been included using Federal Highway Administration's Table MF-121T - Tax Rates on Motor Fuel and Table FE-21B Federal Highway User Taxes. Data may be withheld (W) or not available (N/A) for a few States monthly because of no disclosure. 2/ Diesel prices (dollars per gallon, including taxes) are averages from a survey conducted by the U.S. Department of Energy, Energy information Administration and reflect prices in the last week of the month shown. State level information is not available, but regional level information is updated weekly (on Mondays) and may be obtained by dialing the National Energy Information Center's fuel price hotline at 202-586-6966. |
||||||||||||||||||
| Alabama | 172.4 | 181.5 | 189.5 | 171.4 | 180.2 | 189.2 | 170.3 | 178.6 | 187.7 | 187.4 | 194.6 | 204.0 | 182.6 | 190.9 | 198.7 | 170.8 | 179.5 | 187.4 |
| Alabama | 172.400 | 171.400 | 170.300 | 187.400 | 182.600 | 170.800 | ||||||||||||
| Alaska | 200.5 | 208.7 | 218.1 | 201.3 | 208.6 | 219.9 | 204.2 | 212.3 | 222.0 | 210.5 | 213.5 | 222.4 | 209.1 | 211.5 | 220.5 | 203.1 | 203.8 | 212.6 |
| Alaska | 200.500 | 201.300 | 204.200 | 210.500 | 209.100 | 203.100 | ||||||||||||
| Arizona | 190.9 | 202.1 | 211.2 | 186.4 | 197.7 | 206.3 | 190.8 | 202.4 | 210.5 | 205.8 | 217.0 | 224.5 | 203.3 | 213.9 | 222.1 | 188.1 | 198.4 | 207.0 |
| Arizona | 190.900 | 186.400 | 190.800 | 205.800 | 203.300 | 188.100 | ||||||||||||
| Arkansas | 177.9 | 187.0 | 191.5 | 176.6 | 185.3 | 190.7 | 175.9 | 183.9 | 189.6 | 186.8 | 195.9 | 200.8 | 182.7 | 193.2 | 196.9 | 171.2 | 180.3 | 186.6 |
| Arkansas | 177.900 | 176.600 | 175.900 | 186.800 | 182.700 | 171.200 | ||||||||||||
| California | 201.5 | 214.3 | 220.7 | 192.5 | 205.6 | 211.8 | 193.4 | 206.0 | 212.7 | 217.7 | 230.1 | 238.0 | 214.5 | 225.2 | 234.6 | 192.4 | 205.1 | 213.5 |
| California | 201.500 | 192.500 | 193.400 | 217.700 | 214.500 | 192.400 | ||||||||||||
| Colorado | 189.0 | 199.0 | 209.6 | 186.4 | 196.3 | 206.8 | 184.3 | 193.9 | 204.7 | 192.1 | 202.4 | 212.2 | 190.5 | 200.1 | 209.8 | 179.6 | 189.7 | 198.4 |
| Colorado | 189.000 | 186.400 | 184.300 | 192.100 | 190.500 | 179.600 | ||||||||||||
| Connecticut | 196.0 | 185.3 | 214.1 | 192.8 | 201.6 | 211.6 | 189.3 | 197.7 | 197.4 | 200.7 | 209.8 | 218.4 | 198.3 | 207.8 | 216.3 | 186.6 | 196.4 | 205.0 |
| Connecticut | 196.000 | 192.800 | 189.300 | 200.700 | 198.300 | 186.600 | ||||||||||||
| Delaware | 187.3 | 174.2 | 205.3 | 184.7 | 194.9 | 204.4 | 183.6 | 193.3 | 200.8 | 192.2 | NA | NA | 188.8 | 197.5 | 205.5 | 176.2 | 184.0 | 191.4 |
| Delaware | 187.300 | 184.700 | 183.600 | 192.200 | 188.800 | 176.200 | ||||||||||||
| District of Columbia | W | 185.5 | W | NA | NA | NA | NA | NA | NA | NA | NA | NA | W | W | W | W | W | W |
| District of Columbia | -1.000 | -2.000 | -2.000 | -2.000 | -1.000 | -1.000 | ||||||||||||
| Florida | 174.9 | 185.2 | 194.3 | 170.9 | 181.0 | 190.6 | 170.1 | 179.9 | 189.0 | 183.3 | 192.6 | 201.8 | 183.9 | 193.7 | 202.8 | 173.3 | 184.7 | 193.3 |
| Florida | 174.900 | 170.900 | 170.100 | 183.300 | 183.900 | 173.300 | ||||||||||||
| Georgia | 166.6 | 176.7 | 183.5 | 163.6 | 174.0 | 181.4 | 162.9 | 173.2 | 180.6 | 178.7 | 189.2 | NA | 173.4 | 183.5 | 192.1 | 159.0 | 168.8 | 177.2 |
| Georgia | 166.600 | 163.600 | 162.900 | 178.700 | 173.400 | 159.000 | ||||||||||||
| Hawaii | 212.4 | 220.0 | 229.1 | 212.0 | 220.6 | 229.8 | 211.0 | 219.5 | 228.3 | 221.6 | 227.9 | 236.6 | 220.0 | 226.4 | W | 221.1 | 227.5 | 235.3 |
| Hawaii | 212.400 | 212.000 | 211.000 | 221.600 | 220.000 | 221.100 | ||||||||||||
| Idaho | 193.1 | 202.5 | 210.7 | 192.7 | 200.7 | 209.6 | 192.2 | 199.6 | 208.5 | 198.4 | 204.5 | 213.4 | 198.2 | 205.3 | 212.7 | 188.8 | 196.0 | 203.7 |
| Idaho | 193.100 | 192.700 | 192.200 | 198.400 | 198.200 | 188.800 | ||||||||||||
| Illinois | 181.8 | 191.9 | 202.1 | 181.1 | 190.8 | 201.1 | 179.5 | 189.3 | 199.2 | 193.7 | 202.5 | 215.0 | 186.2 | 197.1 | 210.1 | 171.7 | 182.3 | 193.8 |
| Illinois | 181.800 | 181.100 | 179.500 | 193.700 | 186.200 | 171.700 | ||||||||||||
| Indiana | 176.9 | 186.6 | 195.1 | 176.1 | 186.0 | 194.2 | 175.7 | 185.8 | 194.4 | 187.7 | 197.1 | 205.6 | 179.9 | 189.7 | 198.3 | 165.1 | 174.6 | 182.8 |
| Indiana | 176.900 | 176.100 | 175.700 | 187.700 | 179.900 | 165.100 | ||||||||||||
| Iowa | 175.8 | 182.1 | 187.2 | 172.4 | 179.3 | 183.1 | 172.1 | 179.6 | 183.6 | 187.7 | 192.9 | 200.8 | 177.5 | 187.2 | 194.4 | 166.2 | 173.8 | 182.0 |
| Iowa | 175.800 | 172.400 | 172.100 | 187.700 | 177.500 | 166.200 | ||||||||||||
| Kansas | 183.8 | 191.5 | 202.0 | 181.3 | 188.4 | 199.7 | 179.8 | 187.7 | 198.1 | 192.3 | 200.1 | 210.1 | 183.0 | 191.7 | 202.1 | 170.1 | 178.6 | 187.4 |
| Kansas | 183.800 | 181.300 | 179.800 | 192.300 | 183.000 | 170.100 | ||||||||||||
| Kentucky | 178.7 | 187.8 | 197.9 | 177.1 | 185.3 | 195.3 | 178.9 | 187.6 | 198.4 | 192.2 | 199.8 | 209.9 | 185.6 | 194.4 | 203.5 | 168.3 | 177.0 | 186.3 |
| Kentucky | 178.700 | 177.100 | 178.900 | 192.200 | 185.600 | 168.300 | ||||||||||||
| Louisiana | 175.8 | 185.0 | 193.1 | 174.7 | 183.9 | 193.1 | 173.5 | 183.1 | 191.0 | 185.8 | 195.8 | 206.9 | 183.5 | 193.7 | 204.3 | 168.3 | 178.5 | 187.9 |
| Louisiana | 175.800 | 174.700 | 173.500 | 185.800 | 183.500 | 168.300 | ||||||||||||
| Maine | 192.2 | 172.4 | 211.0 | 191.6 | 201.3 | 209.9 | 190.3 | 199.9 | 207.6 | 203.3 | 213.9 | 222.9 | 201.3 | 211.3 | 217.4 | 187.6 | 198.5 | 203.2 |
| Maine | 192.200 | 191.600 | 190.300 | 203.300 | 201.300 | 187.600 | ||||||||||||
| Maryland | 186.5 | 177.0 | 202.8 | 183.6 | 193.4 | 199.8 | 182.2 | 192.0 | 198.7 | 194.6 | 203.6 | 210.4 | 190.1 | 199.2 | 206.8 | 177.4 | 186.8 | 194.0 |
| Maryland | 186.500 | 183.600 | 182.200 | 194.600 | 190.100 | 177.400 | ||||||||||||
| Massachusetts | 189.8 | 174.5 | 209.6 | 186.0 | 195.9 | 205.8 | 183.6 | 194.1 | 203.0 | 194.0 | 205.4 | 211.3 | 194.0 | 205.5 | 214.3 | 182.8 | 194.0 | 203.9 |
| Massachusetts | 189.800 | 186.000 | 183.600 | 194.000 | 194.000 | 182.800 | ||||||||||||
| Michigan | 181.6 | 189.1 | 196.6 | 180.8 | 188.3 | 195.7 | 179.7 | 187.3 | 194.1 | 192.3 | 201.2 | 208.0 | 183.8 | 192.7 | 199.6 | 168.3 | 176.5 | 183.1 |
| Michigan | 181.600 | 180.800 | 179.700 | 192.300 | 183.800 | 168.300 | ||||||||||||
| Minnesota | 184.0 | 187.2 | 197.8 | 182.1 | 185.2 | 195.8 | 183.1 | 186.6 | 196.6 | 194.8 | 198.3 | 208.1 | 189.2 | 194.1 | 203.1 | 174.1 | 178.1 | 187.5 |
| Minnesota | 184.000 | 182.100 | 183.100 | 194.800 | 189.200 | 174.100 | ||||||||||||
| Mississippi | 177.1 | 188.6 | 195.6 | 177.3 | 186.0 | 195.9 | 177.0 | 185.0 | 194.8 | 188.0 | 197.9 | 208.1 | 184.4 | 194.4 | 204.2 | 172.4 | 182.9 | 192.7 |
| Mississippi | 177.100 | 177.300 | 177.000 | 188.000 | 184.400 | 172.400 | ||||||||||||
| Missouri | 175.4 | 187.2 | 194.2 | 173.7 | 185.6 | 192.4 | 172.6 | 185.9 | 192.4 | 186.2 | 198.6 | 206.6 | 173.6 | 187.6 | 195.4 | 161.4 | 174.5 | 181.8 |
| Missouri | 175.400 | 173.700 | 172.600 | 186.200 | 173.600 | 161.400 | ||||||||||||
| Montana | 195.5 | 205.7 | 211.9 | 195.6 | 206.2 | 212.2 | 194.2 | 203.9 | 210.6 | 197.6 | 207.4 | 216.7 | 197.1 | 207.0 | 215.9 | 188.7 | 198.0 | 206.2 |
| Montana | 195.500 | 195.600 | 194.200 | 197.600 | 197.100 | 188.700 | ||||||||||||
| Nebraska | 183.7 | 188.4 | 194.2 | 181.2 | 186.1 | 192.2 | 181.0 | 185.1 | 191.3 | 192.9 | 197.2 | 203.8 | 185.7 | 192.6 | 199.7 | 172.4 | 177.3 | 185.1 |
| Nebraska | 183.700 | 181.200 | 181.000 | 192.900 | 185.700 | 172.400 | ||||||||||||
| Nevada | NA | NA | NA | 197.3 | 213.8 | 215.2 | 201.0 | 217.1 | 219.0 | 220.8 | NA | 242.2 | 216.7 | W | W | 196.1 | W | 217.1 |
| Nevada | -2.000 | 197.300 | 201.000 | 220.800 | 216.700 | 196.100 | ||||||||||||
| New Hampshire | 187.6 | 169.9 | 206.3 | 184.2 | 195.0 | 202.9 | 182.0 | 192.6 | 200.6 | 193.9 | 204.7 | 211.4 | 192.0 | 203.2 | 208.8 | 181.3 | 192.8 | 197.8 |
| New Hampshire | 187.600 | 184.200 | 182.000 | 193.900 | 192.000 | 181.300 | ||||||||||||
| New Jersey | 185.5 | 159.4 | 206.0 | 179.7 | 190.8 | 199.7 | 174.6 | 185.8 | 195.0 | 184.6 | 195.0 | 203.7 | 185.7 | 196.4 | 205.2 | 176.5 | 187.9 | 197.2 |
| New Jersey | 185.500 | 179.700 | 174.600 | 184.600 | 185.700 | 176.500 | ||||||||||||
| New Mexico | 185.5 | 195.5 | 202.2 | 186.7 | 194.3 | 204.6 | 187.6 | 195.8 | 205.1 | 196.3 | 207.4 | 212.9 | 190.8 | 200.3 | 206.3 | 177.8 | 188.9 | 192.6 |
| New Mexico | 185.500 | 186.700 | 187.600 | 196.300 | 190.800 | 177.800 | ||||||||||||
| New York | 189.7 | 177.2 | 214.4 | 185.6 | 199.2 | 210.1 | 183.6 | 197.2 | 207.6 | 195.7 | 206.4 | 215.9 | 196.7 | 207.8 | 217.4 | 186.9 | 199.8 | 210.0 |
| New York | 189.700 | 185.600 | 183.600 | 195.700 | 196.700 | 186.900 | ||||||||||||
| North Carolina | 182.1 | 192.3 | 201.2 | 179.9 | 189.9 | 199.6 | 179.0 | 188.9 | 198.3 | 190.5 | 200.6 | 209.5 | 189.8 | 199.8 | 208.7 | 177.1 | 187.5 | 195.7 |
| North Carolina | 182.100 | 179.900 | 179.000 | 190.500 | 189.800 | 177.100 | ||||||||||||
| North Dakota | 189.3 | 190.5 | 198.2 | 189.5 | 191.5 | 198.5 | 188.3 | 189.6 | 197.2 | 197.9 | 200.2 | 205.7 | 192.2 | 196.0 | 196.5 | 180.5 | 182.5 | 185.7 |
| North Dakota | 189.300 | 189.500 | 188.300 | 197.900 | 192.200 | 180.500 | ||||||||||||
| Ohio | 184.4 | 194.3 | 204.0 | 182.8 | 192.9 | 202.7 | 183.9 | 194.3 | 203.9 | 196.6 | 205.6 | 215.6 | 186.9 | 196.5 | 206.2 | 171.2 | 180.5 | 190.6 |
| Ohio | 184.400 | 182.800 | 183.900 | 196.600 | 186.900 | 171.200 | ||||||||||||
| Oklahoma | 170.6 | 178.0 | 185.3 | 168.9 | 175.8 | 183.7 | 168.0 | 174.5 | 182.7 | NA | NA | 196.0 | 173.3 | 180.4 | 187.8 | 160.4 | 166.6 | 174.2 |
| Oklahoma | 170.600 | 168.900 | 168.000 | -2.000 | 173.300 | 160.400 | ||||||||||||
| Oregon | 198.8 | 209.3 | 217.8 | 195.8 | 207.1 | 215.2 | 200.3 | 212.0 | 220.6 | 202.6 | NA | 226.8 | 201.4 | 212.5 | 222.3 | 185.1 | 197.0 | 206.5 |
| Oregon | 198.800 | 195.800 | 200.300 | 202.600 | 201.400 | 185.100 | ||||||||||||
| Pennsylvania | 184.9 | 174.5 | 203.2 | 183.1 | 191.8 | 200.9 | 183.9 | 192.2 | 201.1 | 197.2 | 205.6 | 214.9 | 191.7 | 201.1 | 209.9 | 179.2 | 188.7 | 198.0 |
| Pennsylvania | 184.900 | 183.100 | 183.900 | 197.200 | 191.700 | 179.200 | ||||||||||||
| Rhode Island | 195.1 | 182.2 | 214.8 | 191.4 | 202.4 | 211.8 | 188.8 | 199.8 | 209.1 | 201.6 | 211.9 | 221.2 | 201.5 | 212.8 | 221.9 | 189.2 | 201.1 | 209.7 |
| Rhode Island | 195.100 | 191.400 | 188.800 | 201.600 | 201.500 | 189.200 | ||||||||||||
| South Carolina | 176.6 | 188.6 | 198.5 | 173.6 | 185.6 | 195.3 | 171.8 | 183.6 | 193.3 | 184.1 | 194.3 | 204.3 | 182.7 | 193.4 | 203.4 | 170.1 | 181.0 | 190.6 |
| South Carolina | 176.600 | 173.600 | 171.800 | 184.100 | 182.700 | 170.100 | ||||||||||||
| South Dakota | 186.5 | 191.2 | 203.3 | 186.8 | 192.2 | 206.5 | 189.3 | 190.6 | 198.2 | 195.3 | 199.0 | 209.8 | 190.2 | 194.1 | 206.7 | 179.1 | 183.7 | 195.3 |
| South Dakota | 186.500 | 186.800 | 189.300 | 195.300 | 190.200 | 179.100 | ||||||||||||
| Tennessee | 176.4 | 186.1 | 194.7 | 174.2 | 184.5 | 194.6 | 173.6 | 184.0 | 193.8 | 186.4 | 196.5 | 206.0 | 185.5 | 195.7 | 205.0 | 172.2 | 182.9 | 192.1 |
| Tennessee | 176.400 | 174.200 | 173.600 | 186.400 | 185.500 | 172.200 | ||||||||||||
| Texas | 172.8 | 181.5 | 189.6 | 171.7 | 180.1 | 188.7 | 172.8 | 181.1 | 189.3 | 184.3 | 192.5 | 200.3 | 180.1 | 188.8 | 196.1 | 166.6 | 175.5 | 183.1 |
| Texas | 172.800 | 171.700 | 172.800 | 184.300 | 180.100 | 166.600 | ||||||||||||
| Utah | 184.8 | 194.1 | 202.6 | 182.6 | 191.7 | 200.5 | 180.5 | 190.2 | 199.0 | 190.9 | 199.9 | 207.5 | 192.4 | 200.8 | 208.1 | 182.0 | 190.7 | 197.6 |
| Utah | 184.800 | 182.600 | 180.500 | 190.900 | 192.400 | 182.000 | ||||||||||||
| Vermont | 193.9 | 173.8 | 208.5 | 190.8 | 199.6 | 207.9 | 190.4 | 199.2 | 207.4 | 201.1 | 210.1 | 219.7 | 200.9 | 209.8 | 219.3 | 189.7 | 198.5 | 207.5 |
| Vermont | 193.900 | 190.800 | 190.400 | 201.100 | 200.900 | 189.700 | ||||||||||||
| Virginia | 177.9 | 187.1 | 196.5 | 176.3 | 185.3 | 194.4 | 175.2 | 184.6 | 193.2 | 186.6 | 195.6 | 204.6 | 181.8 | 190.7 | 200.2 | 167.8 | 176.8 | 185.9 |
| Virginia | 177.900 | 176.300 | 175.200 | 186.600 | 181.800 | 167.800 | ||||||||||||
| Washington | 197.7 | 210.1 | 220.7 | 194.0 | 206.2 | 216.6 | 197.4 | 210.2 | 221.2 | 201.8 | 215.6 | 224.7 | 201.1 | 214.2 | 222.8 | 187.5 | 201.4 | 209.7 |
| Washington | 197.700 | 194.000 | 197.400 | 201.800 | 201.100 | 187.500 | ||||||||||||
| West Virginia | 186.9 | 195.8 | 203.9 | 185.7 | 194.5 | 202.7 | 186.5 | 195.5 | 203.6 | 199.7 | 208.4 | 216.7 | 195.4 | 204.3 | 212.7 | 181.3 | 190.2 | 198.4 |
| West Virginia | 186.900 | 185.700 | 186.500 | 199.700 | 195.400 | 181.300 | ||||||||||||
| Wisconsin | 192.4 | 195.7 | 207.0 | 192.5 | 194.6 | 207.2 | 191.6 | 194.9 | 206.6 | 205.2 | 205.9 | 221.0 | 200.2 | 201.3 | 215.8 | 183.2 | 182.3 | 198.0 |
| Wisconsin | 192.400 | 192.500 | 191.600 | 205.200 | 200.200 | 183.200 | ||||||||||||
| Wyoming | 180.6 | 190.9 | 196.6 | 184.2 | 192.1 | 196.8 | 184.0 | 189.7 | 195.5 | 189.1 | 195.4 | 204.2 | 185.9 | 195.0 | 201.0 | 173.8 | 186.1 | 189.9 |
| Wyoming | 180.600 | 184.200 | 184.000 | 189.100 | 185.900 | 173.800 | ||||||||||||
| U.S. Average Diesel 2/ | 1.8 | 0.0 | 0.0 | 1.9 | 0.0 | 0.0 | 2.1 | 0.0 | 0.0 | 2.2 | 0.0 | 0.0 | 2.2 | 0.0 | 0.0 | 2.1 | 0.0 | 0.0 |
| U.S. Average Diesel 2/ | 1.795 | 1.898 | 2.076 | 2.240 | 2.235 | 2.088 | ||||||||||||
OHPI Home | Monthly Motor Fuel Reported by States | OHPI Feedback