 |
The information in this publication provides a condensed overview of facts and figures about the Nation's highways. This publication is designed to be of interest to the average citizen. The Federal Highway Administration (FHWA) is the source of the data, except where noted. State governments collect and provide these data to the FHWA each year. Unless otherwise stated, 2000 data are displayed. Office of Highway Policy Information / Federal Highway Administration |
Our Nation's Highways
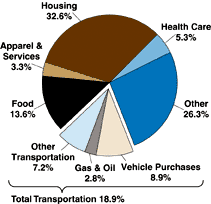
Transportation Expenditures at the Household Level
After housing (32.6%), transportation (18.9%) accounts for the largest single household expenditure. Of the 18.9% transportation expenditures, the largest expenditures is vehicle purchases (47.1%). Other transportation expenditures which includes maintenance and insurance, is the second largest transportation expenditure (38%), followed by the purchase of gasoline and oil.
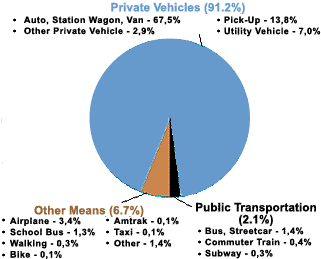
Personal Travel by Mode of Transportation
The personal motor vehicle (automobile, light truck, van, and motorcycle) is the predominant form of personal transportation. Privately owned vehicles are used for 91.2% of all personal travel. Adding school bus (1.3%), bus/streetcar (1.4%), taxi (0.1%) and private vehicles (91.2%) together shows that 94% of personal transportation uses the highways.
Freight Transportation by Mode
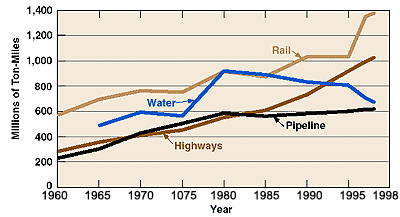
The nation's highway system carries 28% of the total revenue of ton-miles of freight in 1998, compared to 19% in 1960. More significant is that as of 1997, almost 89% of the total dollar value of freight was highway transportation.
Freight Transportation Value by Single Mode - 1997 (trillions of dollars)
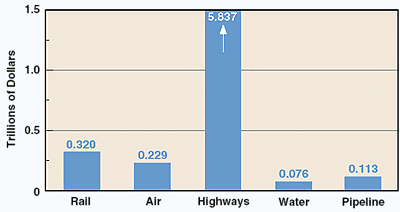
Note: The survey excludes establishments classified in the Standard Industrial Classification as farms, forestry, fisheries, oil and gas extraction, governments, construction, transportation, households, and some retail and service businesses. Source: Bureau of Transportation Statistics, Commodity Flow Survey 1997.
Highway Indicators
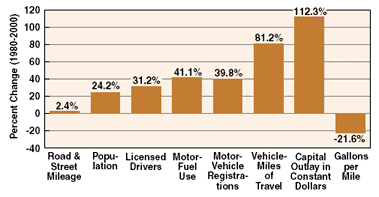
Road and street mileage increased only 2.0% since 1980, but the number of vehicles using those roads and streets had increased 39.8% and vehicle-miles of travel increased by 80%. Highway capital outlay expressed in constant 1987 dollars has increased by 112.3% while the percent from 1980 to 2000 for gallons of motor fuel per mile actually decreased by 21.6%.
Federal and State Gasoline Tax Rates
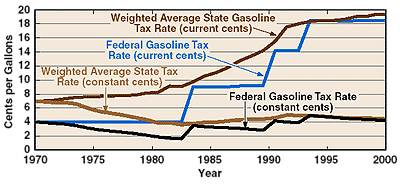
Despite significant increases in State motor-fuel tax rates during the 1980's, the weighted average gasoline tax rate expressed in constant 1970 cents actually decreased by about 38% from 7.02 cents per gallon in 1970 to to 4.35 cents per gallon in 2000. Recent data indicates that State tax rates have risen slightly over the 1990's decade. Over the same 1970 to 2000 period, the Federal gasoline tax rate, expressed in constant 1970 cents, increased by 3.65% from 4.00 center per gallon to 4.15 center per gallon, as the nominal rate increased from 4 cents per gallons to 18.4 cents per gallon on October 1, 1993. During the 1990's, amounts between 2.5 and 6.8 center per gallon were diverted from the Highway Trust Fund for deficit reduction. As of October 1, 1997, these provisions were eliminated. While the deficit reduction impact does not affect the tax rate, it has resulted in additional revenue to the Highway Trust Fund.
Highway Expenditures per Vehicle Mile of Travel
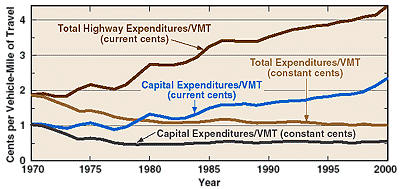
In 2000, highway capital expenditures were 2.35 cents per vehicle mile of travel (VMT) as compared to 1.04 cents per VMT in 1970 -- and 126 % increase. After accounting for inflation, 2000 capital expenditures were only 0.56 cents per VMT, a 46% decrease from 1970's capital expenditures. In 2000, total highway expenditures were 4.40 cents per VMT as compared to 1.88 cents per VMT in 1970, a 134 % increase. After adjusting for inflation, total 2000 highway expenditures were only 1.02 cents per VMT, a 46% decrease from 1970's total highway expenditures. In effect, 2000's highway expenditures by all units of government, with inflation removed, were about 54 % of what they were 30 years ago for each vehicle-mile of travel.
Gross Domestic Product (GDP) and Vehicle-Miles of Travel (VMT)
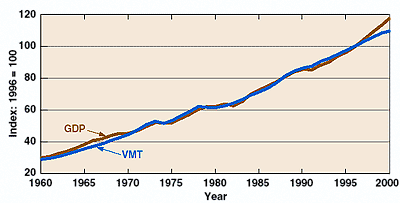
There is a strong relationship between the Nation's economy and travel on the Nation's highway system. Since the 1930's, growth in the Gross Domestic Product (GDP) and vehicle-miles of travel (VMT) reflect strikingly similar patterns, including the period of energy disruptions during the 1970's.
U.S. Telecommuting Population
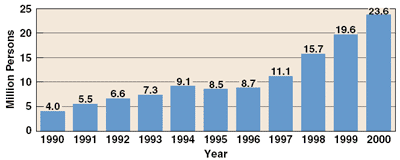
The number of telecommuters in the U.S. in the third quarter of 2000 were estimated at 23.6 million. Of these, 16.5 million telework one day per month, and 9.3 million at least one day per week. About 89% of these are solely home-based, 7% are telework center, and 4% are a combination.
These workers tend to be older and more experienced employees, who on average are in their early 40s. The majority of teleworkers prefer telework, which allows them flexibility in balancing social and family responsibilities, while maintaining their careers.
Since 1995, there has been an increase in teleworking of 175%, and the number is expected to climb to 30 million by 2004. This increase in telework is decreasing the amount of work trips being generated on the transportation system.
Journey to Work: Mode Used by Workers - Percent and Number of Workers, 2000
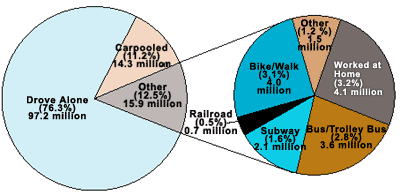
Universe: Workers: All Workers 16 years and older living in households
Data Source 2000 ACS: Census 2000 Supplementary Survey (C2SS)
Only 11.2 percent of workers reported carpooling to work in 2000, while 76.3 reported driving alone. This is a 2 percent drop in carpooling from 1990. The percent of workers report using transit for their journey to work, a stable percentage since 1990. Working at home has increased slightly, from 3.2 million workers (3%) to 4.075 million workers (3.2%).
Journey to Work: Average Travel Time - U.S. Total, 1990-2000
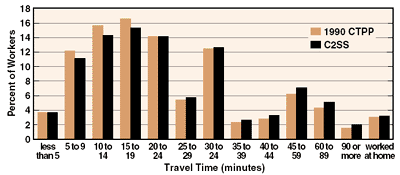
Note: C2SS did not survey Group Quarter Population
Universe: Workers: All Workers 16 years and older.
SOURCE: 2000 American Community Survey (ACS): Census 2000 Supplementary Survey (C2SS) 1990 Census Transportation Planning Package (CTPP)
Nationwide, the average travel time for the journey to work is 24 minutes and 20 seconds, an increase of nearly 2 minutes compared to 1990. Many more people are traveling 45 minutes or more, and fewer workers indicate it takes them less than 15 minutes.
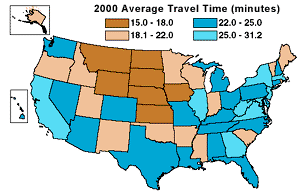
Travel Time to Work
C2SS did not survey Group Quarter Population.
Universe: Workers: CTPP- All Workers 16 years and older Data
Source: 2000 American Community Survey (ACS): Census 2000 Supplementary Survey (C2SS)
States with many workers using transit for their journey to work also tend to have longer average travel times. New York reports the longest average time (over 30 minutes), while North Dakota and South Dakota average about 15 minutes.
Annual Automobile Vehicle Miles of Travel (VMT) per Capita and Number of Automobiles per Capita 1997
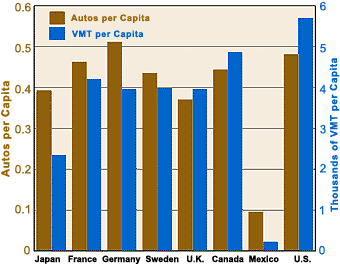
1/ VMT per capita for Canada reflects 1990 data.
2/ VMT per capita for Mexico reflects 1991 data.
Americans travel much more than citizens of the other countries. The myth of Americans' love affair with our cars may actually be a marriage of convenience. Contemporary land use patterns require the use of private vehicles, whether or not we love those vehicles. Americans own more vehicles than the citizens of other countries. Figures from the 1995 Nationwide Personal Transportation Survey (NPTS), show approximately 1 vehicle for every 1 driver, and 1.78 vehicles per household. Not shown in this chart is the huge increase in SUV's, Vans, and Pickup Trucks, which are increasingly used as household vehicles in both the United States and Canada. Annual vehicle-miles for automobiles follow a more pronounced pattern with per capita miles for the U.S. at over over 5,700 and Canada exceeding 4,800. Sweden, Germany, the U.K. and France follow each with between 3,000 and 4,000 per capita miles.
FHWA Home | OHPI Home | Products & Publications | Feedback