|
|
|
|
|
|
Documentation for: SBIR Phase II Final Report:
Computer-Based Intelligent Travel Survey System
DTRS57-00-C-10030
Prepared for: FHWA
30 October 2002
TABLE OF CONTENTS
1. Preface
8. References
| 9. Tables of Figures |
|
| Figure 1: | Activity input page |
| Figure 2: | Trip details page |
| Figure 3: | Respondent-interactive geocoding example |
| Figure 4: | Shared trip example |
| Figure 5: | Activity-based versus trip-based approach to travel diaries |
| Figure 6: | Message in response to address search failure |
| figure 7: | Trip list table - before and after the pretest |
| Figure 8: | Central Florida Geocoding and Map Screens |
| Figure 9: | Las Cruces Survey Administration Plan |
| Figure 10: | Final Disposition of Survey Sample |
| Figure 11: | Average Household Income by Respondent Type |
| Figure 12: | Average Respondent Age by Respondent Type |
| Figure 13: | Regression Analysis for Determing Household Trip-making |
| Figure 14: | Email Follow-up Survey Results |
| Figure 15: | Verbatim Responses to Email Follow-up Survey |
| Figure 16: | Volusia geocoding method page |
| Figure 17: | Volusia shared trips page |
| Figure 18: | Average daily household trip rates by retireval method |
| Figure 19: | Original Travel Diary Input Approach |
| Figure 20: | Activities Input Page |
| Figure 21: | Trip Details Page |
| Figure 22: | New Travel Diary Input Approach |
| Figure 23: | New Activities Page |
| Figure 24: | Travel Diary Input Flow |
| Figure 25: | Average number of trips - Las Cruces |
| Figure 26: | Average number of trips - Volusia County |
| Figure 27: | Average number of trips - Chattanooga |
| Figure 28: | U.S. Internet penetration (Souce: Nielsen, Harris Online) |
| Figure 29: | Technology diffusion curves (Source: Bimber, 2001) |
|
10. List of Tables
|
|
| Table 1: | Origin Location vs. Geocoding Method Used |
| Table 2: | Average Number of Adults and Children in Household by Respondent Type |
| Table 3: | Summary of travel diary interface test |
| Table 4: | Notes of special interest on the household surveys |
| Table 5: | Response rate breakdown |
This report describes the work that was performed by Resource Systems Group, Inc. under a Phase 2 Small Business Innovation Research (SBIR) contract issued by the U. S. DOT Research and Special Programs Administration's Volpe National Transportation Systems Center. The project's Contracting Officer's Technical Representative was Elaine Murakami of the Federal Highway Administration (FHWA).
Thomas Adler and Leslie Rimmer of Resource Systems Group were the primary authors of this report. Leslie was also the system architect for the survey applications. Stephen Lawe was the senior software engineer for the project and several other Resource Systems Group staff participated in various parts of the project work.
We wish to acknowledge the invaluable assistance and guidance provided by Elaine Murakami as Technical Representative for the project. We especially appreciate Elaine's efforts to develop funding for this area of work in the first place and for her enthusiasm in both providing technical direction for the work and identifying applications for the approach. Several others at FHWA and the Bureau of Transportation Statistics attended project meetings and offered helpful suggestions along the way. Finally, we wish to thank the numerous clients who have already supported the applications of these new approaches.
Any errors or omissions in this report are, however, the sole responsibility of the authors.
Travel surveys have been used to provide key inputs to transportation planning models since the 1950s and are an integral tool in the transportation planning process. The increased use of travel surveys could be seen as mirroring the increased use of survey research in all sectors. Surveys can be the most direct and cost effective way to answer basic questions about consumer markets.
While the use of, and need for, travel surveys continues to grow as a result of changes in the planning process, the methods for conducting travel surveys have not changed substantially. Over the past decade, there have been technological advances that have the potential to transform the practice of travel surveying. First, the development and rapid penetration of the Internet has created a new medium for commerce of all kinds, including the administration of surveys. The Internet can serve as a survey medium that is convenient for respondents, has low administration costs and the capacity to dynamically adapt the questionnaire.
The second important technological advance has been the development of geographic tools. These tools can be easily integrated into travel surveys and can provide options for direct respondent input of geographic locations. This reduces post-processing labor, can improve geographic accuracy and can allow additional intelligence to be built into the questionnaire.
The objective of this project is to improve travel survey instruments by including interactive geocoding and the additional "intelligence" that is provided by this geographic information, and by improving the way in which surveys are administered. This will result in a product that will have a solid commercial potential, will result in improvements in the capability, efficiency and effectiveness of the state of the travel survey practice.
To improve the capability of travel surveys, the project developed techniques for analyzing data as they are collected. This, in turn, enables the surveys to dynamically adapt to each respondent's unique situation and focus on the set of issues relevant to that situation.
To improve the effectiveness of travel survey, the work identified ways to use the graphical user interfaces and database capabilities available with computer assisted self interviewing (CASI) to increase unit and item response rates and to improve data quality.
Finally, the work addressed the efficiency of travel surveys by exploring ways of reducing the costs and amount of time required to administer travel surveys. One of the most promising ways of doing this is through web-based surveys. This work developed technologies for deploying complex travel surveys over the web and identified the effects of web administration on survey outcomes.
This work was conducted with funding provided by U.S. Department of Transportation's Federal Highway Administration through the Small Business Innovation Research (SBIR) program. Phase 1 of the project, the initial feasibility testing stage, developed the general approach and specifications for new travel survey technologies. Under Phase 1, a new respondent-interactive geocoding approach was developed, tested and applied in a full travel survey application. That approach and its application are described in the project's Phase 1 report.
Phase 2, the work summarized in this report, involved the development and testing of web-based survey technologies, including a web-enabled version of the interactive geocoding procedure designed in Phase 1. The Phase 2 work included development of the technologies, testing the effects of these technologies on survey capability, effectiveness and efficiency for travel diary applications and development of other travel survey applications.
Phase 3 for SBIR projects, "commercialization" normally follows the Phase 2 tasks. However, for this project, applications for the Phase 2 products were developed concurrently with the development of the technologies. To date, there have been over 30 major applications of the approach encompassing a wide variety of travel survey types.
This report is a summary of the work that was completed in the project's Phase 2. Supporting documents include the Project's Phase 1 report and three published papers describing different pieces of this work. The remainder of this report is divided into three sections. The following section describes the travel survey technologies that were developed to support the project's objectives. The Survey Research section describes work that was undertaken to document the effects that using these new approaches have on survey outcomes. Finally, the Commercialization section lists the applications of this work to date and the likely future diffusion of these technologies.
Five sets of technologies were developed to support the project objectives:
As provided by the SBIR funding used to develop these technologies, the tools themselves and the details of their design are proprietary property of Resource Systems Group, Inc. They have been fully integrated into the firm's IVIS® survey system. The following sections describe the general capabilities of the technologies and some of their applications.
RESPONDENT-INTERACTIVE GEOCODING
Although not all transport surveys ask for location information, the majority do. This information is required for multiple locations and at a relatively high level of geographical resolution. Activity or travel diary surveys typically request locations for all non-home activities made by all members of a household over some period of time. This results in many items of data required, each of which requires a relatively high level of effort by the respondents. They must communicate the location in sufficient detail so that someone else can find it on a map. This can present three types of problems for the respondent, any one of which can result in an effective nonresponse:
Although the current transport modeling practice typically uses locational data at a transportation analysis zone level, there are good reasons for providing these data at an even finer level. First, a single travel survey is often used as a data resource over several years and over that period the zone structure may be refined. If this is the case, the survey data should have a level of resolution that supports mapping onto the new, and most likely more detailed, structure. Second, it is useful to observe geographical patterns within zones. There are models that use this information to determine, for example, the proportion of trips that are within a given walking distance of a transit station. And, third, some transport models are being built at a spatially disaggregate level, tracing trips from origin building or parcel to the destination building or parcel.
The use of GIS data and capabilities to assist both respondents and analysts was recommended in the 1996 U.S. Department of Transportation's Travel Survey Manual (Cambridge Systematics, 1996) and has been suggested as an area for future work in the 1997 International Conference on Transport Survey Quality and Innovation (Richardson, 2000). A review of current practice conducted in 1996 noted that over half of U. S. household travel surveys were post-geocoded using computer software and databases and about one-third were geocoded to a latitude/longitude (Stopher and Metcalf, 1996)
Using GIS interactively as locations are specified can provide instant feedback on the success of the process, allowing further interaction with the respondent and preventing what might otherwise become an item nonresponse. For computer-assisted telephone interviews (CATI), this takes the form of the interviewer entering information into GIS-capable software and probing for clarification or details when a match is not found or when multiple matches are found. The information obtained from the respondent could include street address, nearest intersection and/or business name, assuming that databases containing address ranges and geocoded businesses were used.
In CASI or computer-assisted web interviews (CAWI), respondents can be given similar options of specifying an address, a nearest intersection or a business name and can be given an additional option of specifying a location by clicking on a map. The software can interact directly with the respondent, suggesting alternative spelling or other methods when no exact match is found or displaying matches in a pick list when more than one is found.
A complete interactive geocoding module was developed in a user interface that could be easily used by respondents. The software provides five or more options for identifying locations of each activity on a travel tour:
Even with relatively slow (133MHz) laptop and touchscreen computers used in an initial intercept field surveying application, the geocoding is essentially real time, with barely noticeable delays between successive screens. For CAWI surveys, with the geocoding data and software hosted on fast servers, any delay is only a function of the respondent's connection speed.
The numerous applications of this technology have indicated that, given the available choices, about 80% of respondents specify their home location using a street address and most of the remainder prefer the map point and click that did not identify a precise address. Many of these do not want their actual address in the survey database for privacy reasons. Not surprisingly, the majority of non-home activity locations are identified using the establishment or place name option and about half of work locations are identified using street address with the remainder spread across the other three options. It is important to note that a significant number of the street addresses that are specified by respondents cannot be uniquely matched exactly even with the enhanced GIS database. Many, if not most, of these could not have been post-process geocoded without additional respondent contacts and thus would likely have become item nonresponses (Adler, et al, 2000).
In general, it appears as one would expect that these types of respondent interaction in the geocoding process can substantially reduce location-related item nonresponse and reduce geocoding errors. However, an important indirect effect is that the information obtained by geocoding locations within the survey process can be used to perform dynamic range checking for questions that follow in the questionnaire. For example, several past surveys have dynamically linked travel time, cost and transit availability skim trees from network models with geocoded trip origins and destinations to check the consistency of respondents' reported trip information "on the fly". Where inconsistencies were identified, respondents were asked to check/correct their responses, thus avoiding what would later have been determined to be an inaccurate response (Resource Systems Group, 1999).
Several types of travel surveys are routinely conducted to support transportation planning applications. The design of survey questionnaires for these applications often begins by incorporating elements from previously-conducted questionnaires. Computer-based surveys can be efficiently constructed in an analogous way if the initial design is both modular and easily customizable. Recognizing this, survey designs for this project were developed from a set of software templates, each of which contains the core elements required to conduct a particular type of survey. The common elements include:
These templates are both modular and customizable. Over the course of the project, templates and fully deployed applications were completed for:
Household Travel Diary Template
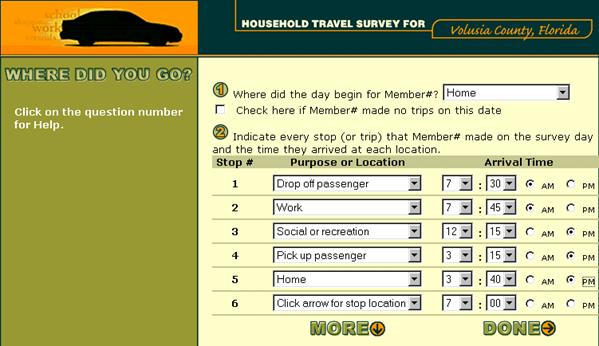
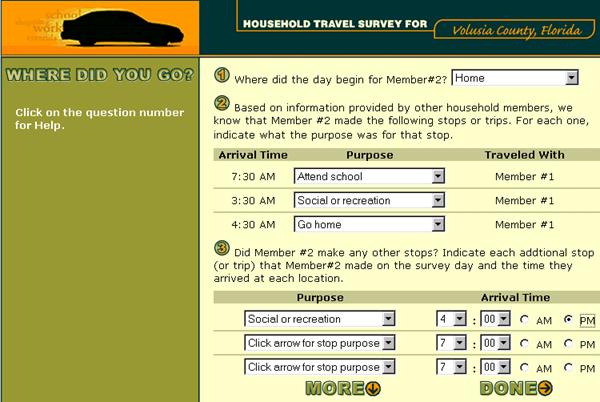
Respondents begin the survey by answering questions about their household and providing a unique identifier (first name or initials) for each member of the household. The approach for collecting trips is activity-based, where respondents begin by recording each stop (or trip) they made and the time they arrived at each stop location. Once all the activities are recorded, the respondent is prompted to provide more detail on each activity, such as travel time, mode, travel party, etc. The final step for each activity is to geocode the stop location. The figure below shows the web page in which respondents initially record their activities.
In developing this software, the target audience was respondents who are Internet users and are well-versed in using common Internet controls such as pull-down lists, checkboxes and radio buttons. Pull-down lists are used extensively throughout the survey because they are easy to use and allow for select-one type responses in a relatively small amount of space.
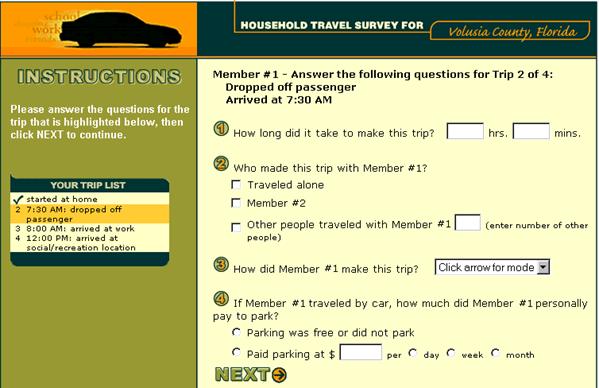
As mentioned above, the trip details are provided once all the activities have been recorded. Figure 2 below shows an example of the web page that collects these details. In this design, the recorded activities are listed in a "Trip List" box on the left side of the page. Activities for which the detail has been completed are indicated by a check mark image, while the activity that is currently being described is highlighted. The current activity is also listed at the top of the trip details page.
Example respondent-interactive geocoding pages, which are used to identify the geographic locations of activities, are shown in Figure 3.
Figure 3: Respondent-interactive geocoding example
The software template includes extensive internal consistency checks that ensure that the data collected are fully usable and do not contain either obvious (e.g. trips than start and end at home with no intermediate destinations) or more subtle inconsistencies.
The template has been refined over its several applications in several ways. For example, a newer, more flexible design, allows respondents to input location geocodes, activities, and trips in any order. This system is analogous to an online shopping site: users can add items to their shopping cart in any order and then continue shopping, adding and deleting items as they choose, until they are finally ready to "check out."
The intention of this design is to provide respondents with immediate feedback by displaying their trip data in the lower section of the page. The ability to edit or delete trips provides them with more flexibility in making modifications. And finally, by eliminating the need to cycle back through each trip to provide details, with the exception of the geocoding, the design reduces respondent fatigue.
Mode Choice Surveys
The most direct way to determine willingness of travelers to use a proposed new transportation service is to conduct an in-depth survey of those who currently make trips for which the proposed service would be a competitive alternative. A stated preference component in the in-depth questionnaire can be used to determine the quantitative relationship between service factors and market shares. This type of survey component (also known as trade-off or conjoint analysis) has become widely used both because of its efficiency and relative reliability in a wide range of market research applications, including travel demand forecasting.
The web template for this type of application includes four major elements:
For stated preference surveys, the system can provide detailed information about choice alternatives, and the control software can adapt stated preference choice experiments around previous responses. All responses are screened for consistency as they are input into the system and electronically stored in a format that allows statistical analyses directly from these files. Free-form comments are collected through keyboard input at the end of the survey.
Origin-Destination Surveys
An origin/destination (o/d)survey uses a short questionnaire to collect trip start and end locations and other important information about trip-making within a region. The primary purpose of an o/d survey is to determine the distribution of trips among a study region's traffic analysis zones (TAZs). These o/d survey data provide detailed information about the unique trip distribution characteristics that can be used directly or incorporated into parameter estimates for a regional travel-demand model.
A web-based response option can be included in a multi-method o/d survey. The web template for an o/d survey is a subset of the household travel diary survey - collecting information about a single trip. The respondent-interactive geocoding module provides higher-quality geographic information than results from simple paper and pencil instruments.
Transit Customer Surveys
Transit service providers routinely conduct surveys to determine customers' trip patterns and satisfaction levels. For certain applications, web-based survey instruments are highly cost-effective alternatives to traditional intercept surveys. A web template was developed to facilitate combined transit customer satisfaction and origin/destination surveys. The template is being used for NJ Transit's e-panel survey, which includes 15,000 members, each of whom participates in quarterly survey waves.
Most CATI, CASI and CAWI surveys use computing capabilities to perform conditional branching and simple range checking of inputs. However, computer-based interviews can, in theory, more actively exploit the computational capabilities of the host computer in a much more significant way to perform tasks as the interview progresses rather than passively collecting the data and, later, submitting the data to post-processing analyses. The respondent-interactive geocoding module described earlier is one example of this capability, but it, in turn, enables a much broader set of functions that can make the interview far more "intelligent" in the way it collects additional information. In addition, the computing capabilities can be used to automate sample processing functions such as weighting and statistical parameter estimation as individual or groups of interviews are completed. This makes the processing more efficient and enables more sophisticated sample balancing and control.
A very wide array of online analytical procedures was developed to support the various travel survey templates, ranging from complex multi-variable range checking to sophisticated statistical estimation procedures. The following are three examples of these online analytics:
A significant amount of the software code developed for this project is part of procedures that support the development and testing of computer-based surveys. These procedures automate the process of converting a questionnaire script into web-enabled pages, creating branching structures, validating entries, creating database structures, adding foreign languages and incorporating selected online analytics. They also include components that automate the testing process and facilitate the documentation of completed surveys.
The tools have been assembled into an extensible toolkit into which templates and functions are added as they are developed. The core of this toolkit, FormMaker, uses a tag-based scripting language to convert a text interview script into either a web-based or stand-alone workstation interview.
Using these authoring tools, simple travel surveys can be constructed with little effort beyond creating the interview script. However, the tools are especially useful for the creation of more complex surveys that are more typical in transportation applications. The time and effort required to create these surveys is reduced by at least a factor of two by using these tools.
Web surveys can be deployed very efficiently by making using of the capabilities available in a modern, scalable database server environment. A set of server-based tools was developed to support both web-only and multi-method surveys.
These administration tools mirror the capabilities that are provided in CATI software but they can be run with little or no human intervention required.
An important part of the project was to test the new technologies to determine both their functionality and their effects on the travel survey process. Several tests of web survey technologies including respondent interactive geocoding and web survey templates were conducted. Among these tests were: focus groups conducted to test web-based geocoding interfaces; "stress tests" designed to estimate web capacity as part of the Internet trip diary survey development; and three studies to assess instrument effects and various features of the web-based household travel diary template. The travel diary tests were conducted in the process of household travel survey projects for MPOs in: Las Cruces, New Mexico; Volusia County, Florida; and Chattanooga, Tennessee. These studies are described in the sections that follow.
The pretest of the web-based household travel survey template was conducted in Burlington, Vermont. This location was chosen because Internet-based maps had been developed for the area as part of a previous study. A total of eight people were invited and offered incentives to participate in the pretest. All participants were provided with a "memory jogger"-a paper-based trip log designed to be carried around by participants for recording trips. Three participants were assigned a password and instructed to take the survey on the Internet from their home or office and three were invited to a hotel meeting room to complete the survey in our presence. Five of the six participants met at the hotel meeting room location and discussed the overall flow of the survey and the individual screens in detail.
Although the group was intentionally small to facilitate more in depth discussion, the participants came from a variety of living and lifestyle situations. The group included three participants who live alone, one who lives in a household of unrelated adults and one who is part of a young family. There were full-time workers, a full-time student and a part-time student/worker. Three participants access the Internet from home and work, one from home only and one from school. One of the participants used Netscape Navigator and four used Internet Explorer.
One issue that was explored in the focus groups was whether respondents prefer an activity-based approach to a trip-based approach. In the activity-based approach, which is used for this web template, respondents first list all the activities and arrival times for each of their trips. Once this is completed, they work through each trip individually and enter all the remaining details, such as travel time, party members, mode, parking costs, and location. In the trip-based approach, respondents identify and provide all the details for each trip before they move on to the next trip. Figure 5 below illustrates the difference between the two approaches.
Figure 5 - Activity-based versus trip-based approach to travel diaries
The findings from the pretest indicated that the overall approach and navigation were understandable and easy to use. Modifications were made to the software in response to comments made by participants. In addition, the software was optimized to run in both Internet Explorer and Netscape Navigator.
All but one of the participants preferred the activity-based approach. Several of them agreed that if they had to provide all the information about each trip before they could continue they may have gotten discouraged and under-reported their trips.
Respondent burden
While none of the participants thought the survey was too long to complete, several said that they would have preferred to have some indication of how long the survey would take to complete. The prospect of a multi-day diary appeared to be daunting for the participants.
All of the participants were interested in having the ability to edit their diaries, a feature which was not then implemented. In addition, they liked the idea of seeing the trip route plotted on a map.
Design of survey
Overall, the participants liked the design of the survey although the car image at the top of the page led some to believe that we only wanted them to record car trips. This and other changes were made in response to comments received during the pretest.
Memory jogger
All of the participants used the memory jogger, which was emailed to them in the PDF format. One participant commented that he would have kept more careful track of his addresses if he knew he would have to input them into the software. Changing one or more of the examples on the memory jogger to include an exact street address clarified this.
None of the respondents had difficulty with the functional elements of the survey even though it was clear that none of them had read all of the instructions provided on each page. With that said, they all thought it was important to include instructions on the page and not in a separate window. One participant indicated that if he were recruited to take an actual survey, he would expect more information on how his data would be used. Two of the respondents did not begin their day at home and overlooked the instructions for the beginning of the survey day. Generally speaking, the participants didn't read instructions if they thought that they were able to answer the questions without them.
The web pages in which respondents record their activities are potentially the most confusing. All of the respondents said that they had no trouble understanding the procedure for completing these pages. This was corroborated by observing the respondents completing the survey at the pretest.
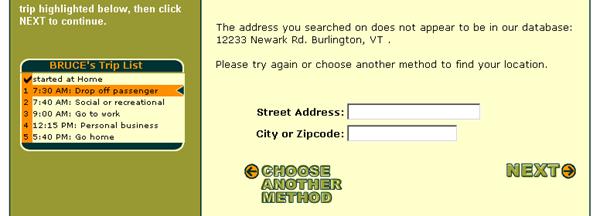
One respondent did, however, experience some confusion on the geocoding page where five different geocoding methods are made available to respondents for identifying their trip ends. This respondent had difficulty interpreting the different options and was uncertain about how to proceed when the address she searched on was not found in the database. In response to her issues, the listing of geocoding options was simplified and the messages respondents receive if their search fails were improved. Also, instead of routing them to an error page where they are informed that their address wasn't found, they are routed directly to a new input page and immediately provided with another chance to input their address. They also are provided with a direct link back to the original geocoding page where they can choose another method to locate their trip end. The figure below shows a section from this page.
Figure 6: Message in response to address search failure
The trip list is a valuable tool for respondents to use when completing the travel diary survey. It lists all the trips that have been input by the respondent and the status of each trip (completed, in progress, or not started). Therefore, when most of the respondents indicated that they had not noticed it on the left side of the page, it was modified so it would be more obvious. The figure below shows both the old and the new versions.
Figure 7: Trip list table-before and after the pretest
Resource Systems Group conducted hardware and software "stress tests" designed to estimate loads imposed by Internet household travel diary surveys. Web capacity is defined as the number of web page requests that can be handled within a defined period of time. Web capacity is a function of the server hardware, server software, application software and component software. The most common method of estimating web capacity is to "stress" the web site by simulating multiple browsers requesting pages from the web site.
The results of the stress tests indicated that the server hardware, server software, and application software are all extremely "scalable" and do not present foreseeable limitations. The portions of the software that imposed the greatest limits were optimized in ways that facilitate load sharing across multiple processors.
RESPONDENT-INTERACTIVE GEOCODING - FIELD TEST
The Internet-based respondent-interactive geocoding module was first used for an origin/destination survey application in Central Florida. In that survey, origins and destinations were geocoded using one of five search methods:
1. Searching by address 2. Searching by closest intersection 3. Searching by business name 4. Identifying a location on a map 5. Selecting from one of the previously geocoded locations
The figure below shows the initial geocoding screen and an example map screen.
Figure 8: Central Florida Geocoding and Map Screens
In order to understand how respondents use these options, a tracking system was developed that stores a list of each search along with a time stamp. With this information, the most commonly used methods by trip purpose can be identified. It can also track which methods are used first and which methods are used as a second choice when the first search method fails. The system also stores the duration of each call (address, intersection, and map clicks) to GIS and mapping procedures.
As was found in an earlier test of workstation-based respondent interactive geocoding (Adler, Rimmer, et al, 2000), respondents employed a variety of geocoding methods that are somewhat dependent on the location that is being geocoded. The methods used tabulated by type of trip end are shown in the table below. For home and work locations, the address search and map click methods were used most often. When other methods failed to geocode, respondents could use the map click method to pinpoint their location. This may account for the fairly large number of respondents who used this method. Visitors made use of the list of Orlando attractions to identify their location when visiting attractions, while those searching for a hotel often used the business search method as well as map click.
Table 1: Origin Location vs. Geocoding Method Used
|
Origin
|
Business
|
Address
|
Intersection
|
Map
|
Attraction
|
Total %
|
Total N
|
|---|---|---|---|---|---|---|---|
| my home |
0%
|
40.2%
|
14.6%
|
41.5%
|
3.4%
|
100%
|
776
|
| mall |
0%
|
3.7%
|
3.7%
|
63%
|
29.6%
|
100%
|
27
|
| school |
0%
|
0%
|
20%
|
70%
|
10%
|
100%
|
10
|
| work |
2.1%
|
25.5%
|
10.6%
|
46.8%
|
14.9%
|
100%
|
47
|
| other home |
0%
|
13%
|
8.7%
|
65.2%
|
13%
|
100%
|
23
|
| attraction |
2.6%
|
0%
|
0%
|
26.3%
|
71.1%
|
100%
|
38
|
| other |
3%
|
11.2%
|
6%
|
74.6%
|
5.2%
|
100%
|
134
|
| office bldg |
12.5%
|
25%
|
25%
|
25%
|
12.5%
|
100%
|
8
|
| my hotel |
25.9%
|
2.2%
|
1.3%
|
56.5%
|
14.2%
|
100%
|
232
|
| other hotel |
25%
|
0%
|
0%
|
66.7%
|
8.3%
|
100%
|
12
|
| Total |
5.6%
|
26.8%
|
10.4%
|
48.5%
|
8.7%
|
100%
|
1307
|
HOUSEHOLD TRAVEL SURVEY WEB TEMPLATE - FIELD APPLICATIONS
Las Cruces Household Travel Survey
For this field test, a multi-method, multi-instrument survey design was used to ensure that respondents were recruited in ways that were suited to their preferences and offered completion alternatives that reduced their perceived burden. A commercial list was purchased from Survey Sampling, Inc. that included addresses for all records and telephone numbers for approximately half of the records. For both the "Phone" and "No Phone" groups, travel day assignments were made across a 3-day period and approximately two-thirds of each group, randomly selected, was offered the Internet option.
All respondents were mailed a pre-notice letter informing them that they would soon be receiving a request in the mail to complete a questionnaire for an important transportation planning study. The purpose of the survey was described and selected respondents were provided with a web address (URL) and password and encouraged to take the survey online. (Respondents who logged onto and completed the survey based on this pre-notice letter are later referred to as the "jumped online" group and are represented in the figure below by the pink boxes). Every letter was hand signed by an MPO Officer and a $2 cash incentive was included. Twelve versions of the letter were required to account for whether a phone number was available, whether the Internet option was offered and which survey date was assigned. The figure below illustrates the administration plan.
Figure 9: Las Cruces Survey Administration Plan
One week prior to the assigned survey day, members of the "No Phone" group who had not jumped online were mailed a survey packet by priority mail that included a letter from the MPO, a booklet to record household information, travel logs to record trip details, and a $2 cash incentive along with a self-addressed stamped return envelope. All materials were available in Spanish and could be requested by contacting using a toll-free telephone number.
One week prior to the assigned survey day, a market research firm contacted members of the "Phone" group who had not jumped online. Once contact was made, respondents who were willing to participate and had been selected for the Internet option were offered the opportunity to complete the survey online. They were asked to go online at their earliest convenience and complete the household portion of the survey (equivalent to the booklet survey) and return to the website to input their household trips soon after their assigned survey day. Following the call, this group was mailed a travel diary form and $2 cash incentive for each adult member of the household. The travel diary form was intended to be used as a "memory jogger" for the Internet group and carried along during their assigned survey day.
Respondents from the "Phone" group who agreed to participate but were not selected for the Internet option were asked the booklet questions over the phone. A travel diary form and $2 cash incentive for each adult member of the household was mailed to the respondent along with a self-addressed stamped return envelope. Respondents who were not reached by phone were sent the full survey packet as described in the list above.
All correspondence was stamped with first class or priority mail and mailed from a Las Cruces post office. Undeliverable mail and returned surveys were sent to a local post office box and logged by a local firm serving as a subcontractor to the Las Cruces Household Survey contract. The firm logged the undeliverable and returned mail directly into our database through a specially designed web page that enables us to monitor the volume of incoming mail electronically and in real time. In addition, these data plus data received by online participants automatically updated a "tracking" page that displayed the number of partially and fully completed surveys.
In total, the field test sample included 752 completed responses. Approximately two-thirds of the original sample was assigned passwords and provided with Internet completion options and 506, or 67%, of the completed responses are from this group. Of the 310 individuals recruited by telephone, 10 completed the remainder of the survey on the web and 150 completed it by mail. A total of 54 respondents began the survey on the web and mailed in their travel diary forms instead of entering their trip data on the web. Fifty-three respondents used only the web to complete their survey and 485 completed it by mail. Approximately 23% of the respondents who were assigned passwords used the Web option to compete at least part of their survey.
The table below shows the final sample disposition.
Figure 10: Final Disposition of Survey Sample
|
Count
|
Percent
| |
| CATI / Web Complete |
10
|
0.3%
|
| CATI / Mail Complete |
150
|
5.0%
|
| Web Only Complete |
53
|
1.8%
|
| Mail Only Complete |
485
|
16.2%
|
| Web / Mail Complete |
54
|
1.8%
|
| No response |
1586
|
53.0%
|
| Incomplete |
60
|
2.0%
|
| Unusable |
58
|
1.9%
|
| Undeliverable |
539
|
18.0%
|
| Total |
2995
|
100.0%
|
Total Complete = 752 | Total deliverable surveys = 2456 | Response rate = 31%
Overall, the completion rate from the Internet portion of the split sample was slightly higher than the rate from the portion that was not given an Internet option. This result is not unexpected given the low-income profile and Internet penetration in the Las Cruces area, the use of equalized incentives across survey modes and Internet disruptions that occurred at key survey stages. More interesting results appear in comparisons in demographic and trip-making profiles of the samples.
Marked differences were found among the different types of respondents. Typically, the respondents who took advantage of the web options tended to be younger and more affluent. The figure below shows a cross-tabulation of average household income by respondent type. The respondents who completed the survey using the web and mail had the highest household income at $55,500 while those who were recruited by telephone and completed by mail had an average income of $38,500.
Figure 11: Average Household Income by Type
The average age of respondents who were recruited by phone and completed the survey on the web was 26, while the average age of respondents who were recruited by phone and completed it by mail was 56 (see Figure 12). While there was little difference in the average number of adults in the household when compared to respondent type, some differences were observed in the number of children living in the household. This observation is likely related to the age differences of the groups. The table below shows the results of the household size calculations.
Table 2: Average Number of Adults and Children in Household by Respondent Type
|
Adults
|
Children
| |
|---|---|---|
| CATI / Mail | 1.9 | 0.3 |
| Mail Only | 2.0 | 0.6 |
| CATI / Web | 2.2 | 1.2 |
| Web Only | 1.9 | 0.9 |
| Web / Mail | 2.1 | 0.5 |
Figure 12: Average Respondent Age by Respondent Type
The Web-based survey instrument simplifies the process of reporting trips and it was considered possible that this could result in respondents describing their household travel more completely. Raw tabulations show that the web respondents reported approximately three more trips per household on average than the other respondents. However, the web respondents have different demographic characteristics that could be causing these higher trip rates.
Linear regressions were performed to separate the effects of demographic and survey mode factors on trip reporting. It is not surprising that the number of trips that are reported by a household is strongly influenced by the number of adults living in that household. Also important is the number of children living in the household. Household income was tested in the regression analysis and was found to be insignificant, however, the related homeownership variable proved to be significant; homeowners in the sample have a higher household income ($43,000) than renters ($30,000), therefore, this variable can also be viewed as a proxy for income.
In addition to the demographic variables, the influence of the administration mode was tested. Three dummy variables were used to represent those who: 1) completed using only the Web; 2) used some but not all Web and; 3) were recruited by telephone but completed by mail. The absence of a dummy variable for the "mail only" respondents means that the values of the coefficients of the other three dummy variables are relative to this administration method. The model results indicate that respondents who made use of the web option tended to report approximately 1.5 additional trips on average. The CATI recruit marginally influences trip reporting. Figure 13 below shows the results from the regression analysis.
Figure 13: Regression Analysis for Determining Household Trip-making
|
Coefficient
|
Std.
Error
|
t-Stat
| |
|---|---|---|---|
| (Constant) |
-1.0905
|
0.760
|
-1.435
|
| Number of Adults |
3.2662
|
0.204
|
15.989
|
| Number of Children |
1.0902
|
0.184
|
5.933
|
| Home Ownership |
0.7407
|
0.355
|
2.088
|
| Web Only |
1.6561
|
0.657
|
2.520
|
| CATI / Mail |
0.6302
|
0.426
|
1.479
|
| Some Web |
1.4290
|
0.602
|
2.375
|
An informal follow-up email survey was sent to the respondents who at least partially completed the survey online and 26 responded. The questions and their responses are summarized below. Overall, the survey was positively received and respondents seemed to appreciate the Internet option. Many enjoyed the convenience of participating online although several commented that once the detailed travel forms were completed (our "memory joggers" were actually complete travel diary forms and some completed them in the course of the travel day), it was additional work to input the data online.
Figure 14: Email Follow-up Survey Results
|
Yes
|
No
|
Total
| |
|---|---|---|---|
| Did the availability of the Internet option encourage you to partcipate in the survey? |
21
(84%)
|
4
(16%)
|
25
(100%)
|
| If you were to complete the survey again, would you choose the Internet option? |
24
(96%)
|
1
(4%)
|
25
(100%)
|
| Were any of the survey questions difficult to understand? If so, which ones? |
2
(8%)
|
24
(92%)
|
26
(100%)
|
| Did you use the travel forms to keep track of the trips you made before entering them on the website? |
5
(42%)
|
7
(58%)
|
12
(100%)
|
| Do you have any suggestions for or concerns about the layout of the survey booklet or the travel forms? |
3
(11%)
|
24
(89%)
|
27
(100%)
|
| Did we provide enough information about the study to enable you to understand why you were being asked for your travel information? |
22
(88%)
|
3
(12%)
|
25
(100%)
|
Many respondents provided some detail with their answers and these responses are included in the table below. This short survey provides us with the necessary feedback to improve the survey and its components.
Figure 15: Verbatim Responses to Email Follow-up Survey
Why did you choose to complete the survey over the Internet rather than on paper?
In reviewing the field costs for this survey, it became clear that one of the best strategies to reduce costs is to encourage more use of the web option. In addition to providing higher incentives for web completion, web completions can be encouraged by designing the memory joggers such that they require only enough information to help the respondent remember what trips they made on the survey day. In using the travel forms as memory joggers in Las Cruces, respondents were inadvertently encouraged to simply mail back the travel forms since they had recorded detailed information about each trip.
Volusia County, Florida, Household Travel Survey
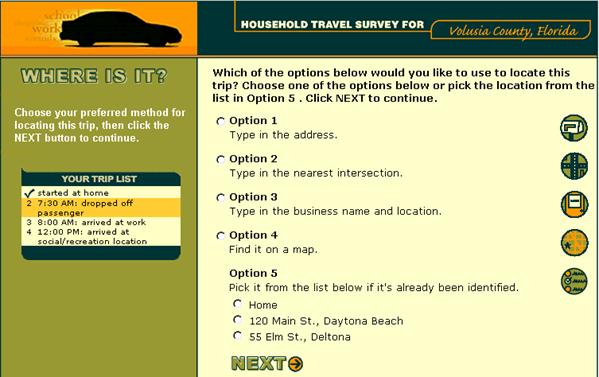
The Volusia County, Florida (home of Daytona Beach) household travel survey was designed as a two-day diary. This presented an opportunity for further exploiting some of the advantages of the household travel diary web template. Two specific shortcuts developed in the software are the ability to choose locations that have already been identified and the ability to enter information for intra-household shared trips only once. Both of these shortcuts are more heavily used in a multi-day travel diary than in a single day diary. The figure below illustrates the use of previously-identified locations (Option 5). The location list builds as new locations are identified and, for the second day of travel, it is likely that most trip locations are already on this list.
Figure 16: Volusia geocoding method page
Information about which family members traveled together is collected for each trip. When subsequent household members record trips, these shared trips automatically become part of their trip log-only the trip purpose needs to be collected. Figure 17 shows an example of a household member who made shared trips. In this case, three separate trips were specified by another household member as being shared with the member actively recording trips. Each trip is presented with the arrival time and the names of other members of the travel party. The respondent is prompted to record the trip purpose for each of the shared trips. The section below the shared trips is provided for additional trips that may have been made by this household member but not recorded by a previous member.
Figure 17: Volusia shared trips page
The survey administration was similar to that used for the Las Cruces application, with the exception that a web option was provided to all respondents in the multi-instrument design. Since the Volusia survey was a two-day diary, it provided the opportunity to test the effectiveness of the shortcuts built into the web template.
Overall, trip reporting for the first day of the survey was similar across the three response types. However, while on average the telephone and mail-back retrieval methods result in lower trip rates on the second day of the survey, the online method yielded more trips more on the second day. The figure below illustrates these results. Respondent fatigue may have been a factor in fewer reported trips on the second travel day for the phone and paper respondents, but the web survey shortcuts likely reduced this fatigue effect for the web respondents.
Figure 18: Average daily household trip rates by retrieval method
Chattanooga Urban Area Household Travel Survey
In the interest of exploring a more flexible household survey design, an alternate approach to entering travel data that was implemented in web template for the Chattanooga Urban Area Household Travel Survey. In the original (Las Cruces) design, respondents started by selecting the location where their trip began then list each of the day's trip activities. Once this step is completed, they cycle back through each of the trip activities and provide detail (mode, travel companions, parking costs, etc) and geocode the location. They completed the survey by answering a set of general questions. The intention of this design was to have respondents initially commit to their activities then undertake the more time-consuming process of providing detail for each activity. This process is summarized below.
Figure 19: Original Travel Diary Input Approach

The potential difficulty with this approach is that respondents are initially presented with a screen that, at first glance, appears to be quite complicated. At the top of the page respondents provide information about their location at the start of the day. The main body of the page contains an input section for up to eight activities with start and arrival times. At the bottom of the page a "MORE" button submits the data and provides the respondent with a blank page for additional activities, and a "DONE" button submits the data and advances to the next section of the survey. A screen capture of the activities input page is shown below.
Figure 20: Activities Input Page
After all of the activities are entered, respondents provide detail on each trip. The figure below provides an example of the trip details screen. This screen is followed by the geocoding module that has been described in detail in previous sections.
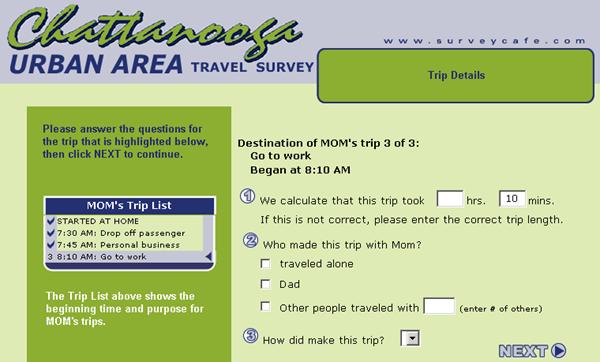
The new approach that was tested in Chattanooga was somewhat different in that respondents enter each trip and its details individually, i.e., they do not have to cycle through the trip details section and re-address each trip. Once they have completed the details on all their trips, they proceed to the geocoding module and geocode each trip end. This process is descibed in the figure below.
Figure 22: New Travel Diary Input Approach

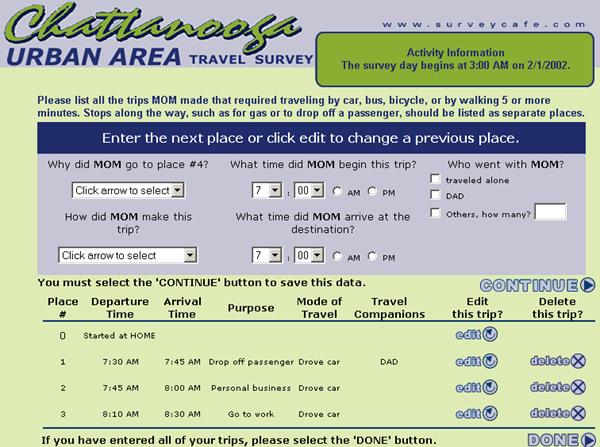
The new activities page is shown in the figure below. After the respondent enters a trip activity and its corresponding details, a click on the "CONTINUE" button submits the data and displays the trip data in the lower section of the page. This process continues until the respondent has completed entering each trip. At any point, a click on the "EDIT" button beside the trip inserts the trip data into editable fields. A click on the "DELETE" button will delete the trip from the list.
Figure 23: New Activities Page
As with the Las Cruces survey, this concept involves two main "steps"; the first is to collect general information about the household including household size, income, vehicle mix and household member data. This information is input once by the user and, in this template, is summarized on an editable web page. The second step is to collect the travel information for each household member. This step is further divided into two steps; the first has the respondent identify a list of activities for the survey day, and the second has them provide detail (drill down) for each activity. In each case, a set of memorized activities are available to eliminate the need for respondents to enter redundant information. The figure below illustrates the relationship between these tasks in the new template, as implemented in the Chattanooga survey.
Figure 24: Travel Diary Input Flow

The new design was tested in a split sample conducted in the course of the Chattanooga household travel survey. The results of this test are summarized in the table below.
Table 3: Summary of travel diary interface test
|
Group 1: Original Design
|
Group 2: New Design
| |
|---|---|---|
| Number |
44
|
33
|
| Avg. number of household trips reported |
7.3
|
6.7
|
| Avg. duration in survey in minutes |
44
|
38
|
| Avg. number of warnings received |
4
|
3
|
The results show that there while there was no significant difference in the number of trips reported per household, respondents completed the survey six minutes faster using the new design. Also, these respondents received fewer warnings (such as skipping an answer, correcting a time, etc.) than those that used the original design. Clients who reviewed the new design tended to prefer it over the original design.
HOUSEHOLD TRVEL DIARY SURVEY FIELD TESTS SUMMARY
Analysis of response rates
Every household survey project has its unique challenges and the three projects that were performed during this SBIR contract were no exception. In each case, however, the approach that was used was a multi-instrument, multi-method design that provided several different response options to respondents. The objective of this approach was to reduce the burden on the respondents as much as possible while improving both the quantity and the quality of survey responses. These strategies were combined with survey administration plans that emphasized multiple contacts and incentives. The table below summarizes the unique characteristics of each project.
Table 4: Notes of special interest on the household surveys
|
Las Cruces |
Split design to test web response--one-third of sample not provided internet option. Used cash incentives--$2 with pre-notice letter and $2 for each adult household member in survey packet mailing. During the survey, the web server was attacked twice by hackers in retaliation for the Chinese spy plane incident and turned away an estimated 50 potential respondents. |
|
Volusia County |
Two-day travel diary with minimal incentives: free pen and raffle with 75 respondents winning annual passes to County Parks. |
| Chattanooga |
Split design to test two different interfaces for inputting trip data. Cash incentives--$1 with pre-notice letter and $1 in survey packet mailing. The first 500 respondents received a free Ben & Jerrys Ice Cream coupon. Initial mailing occurred during Anthrax scare. Telephone recruitment was not used. |
Ignoring temporarily the effect of different response methods, it is clear that incentives affect response rate. Las Cruces, which used the most generous incentive received the highest response rate (30.6%) while Volusia County where raffle prizes were used for incentives had the lowest response rates (25%). Pre-incentives, as used in both in Las Cruces and Chattanooga, have been shown in the literature to have a positive effect on response rates. Unfortunately, some agencies restrict the use of financial incentives. A summary of the response rates for the three surveys is shown below in Table 5. Interestingly, Las Cruces had the highest undeliverable rate at 18%, which is the rate that list companies expect. Both of the other studies had lower than expected undeliverable rates at 11%.
Table 5: Response rate breakdown
|
Sample
|
Undeliverable
|
Returned
|
Response
rate
|
Undeliverable
rate
| |
|---|---|---|---|---|---|
| Las Cruces |
2995
|
539
|
751
|
30.6%
|
18.0%
|
| Volusia County |
6313
|
728
|
1397
|
25.0%
|
11.5%
|
| Chattanooga |
3700
|
406
|
904
|
27.4%
|
11.0%
|
While respondents made use of all the response methods that were available to them, most continue to prefer completing the survey by mail. In all cases, traditional methods (mail only and phone/mail) were used most often with the neutral incentives that were provided and given that the split sample resulted in portions of the sample not being given a web option. Volusia county respondents took advantage of web-related methods to a greater extent than the other regions.
Analysis of trip rates
To better address the quality rather than quantity-related issues in household surveys, the trip generation rates for each of the surveys were compared by response method. These results are summarized in Figure 25 through Figure 27. In both Las Cruces and Chattanooga, web-based methods consistently produced surveys with trip generation rates that ranged from 18% to 45% higher than the overall trip rates for each sample. In Volusia, while all web-based methods didn't produce higher trip rates, the combined web/mail option resulted in trip rates that were 38% higher than the overall rate.
These results indicate that web-based methods enable and ensure more complete collection of travel-related information. They also indicate that respondents who chose to participate using these methods are likely somewhat different than those who use traditional methods and, on average, make more trips.
It is for these reasons, that even though the majority of respondents may use traditional response methods for this type of survey, offering web-based alternatives is critical to achieving a more accurate picture of the travel patterns of the full population.
Figure 25: Average number of trips-Las Cruces
Figure 26: Average number of trips-Volusia County
Figure 27: Average number of trips - Chattanooga
A primary goal of the Small Business Innovation Research (SBIR) program is to stimulate technological innovation, which can be successfully commercialized. The Phase 2 work on this project was designed to include development of new travel survey methods and, concurrently, field research demonstrating how those methods could be applied. The first application (Las Cruces Household Travel Diary Survey) demonstrated that the new methods were technically feasible, resulted in improvements in unit and item response and were welcomed by survey participants. Over the course of the project, more than 30 major survey applications of the methods were fielded. These applications resulted in a doubling of Resource Systems Group's staff over the contract period. But, more importantly, the use of web surveying and respondent-interactive geocoding achieved the project's original objectives to improve the efficiency, capability and effectiveness of the travel surveys to which they were applied in the following ways:
One of the most important issues affecting the future of web interviewing is the extent to which the "online population" is representative of the full population. In most of the applications developed by Resource Systems Group, web interviewing was used as one retrieval method in a multi-instrument design to avoid potential biases from not including potential respondents who did not have web access. As of the time of this report, the U.S. Internet penetration is estimated to be approximately 65% (Figure 28) and has been growing rapidly, and the fastest growth has been among demographic groups that were not well-represented in the 1990s - women, lower income and racial/ethic minorities. Assuming that Internet penetration continues as with other technologies, it may not be long before Internet access is as ubiquitous as the land-line telephone, whose share is falling as a result of cellular phone penetration.
Figure 28: U.S. Internet penetration (Source: Nielsen, Harris Online)
Figure 29: Technology diffusion curves (Source: Bimber, 2001)
Even with the current level of Internet penetration, there are applications where Internet interviewing can be appropriately used alone, without conventional retrieval options. In some markets, Internet penetration is very high. In other applications where Internet penetration is equal to, or lower than, national averages, access to the Internet may not, by itself, be correlated with the behavior being measured. In either of these cases, weighting the population using demographic factors with which Internet penetration is known to be correlated (income, race/ethnicity, education level), can remove sample bias from an Internet-only sample. Based on the work conducted in this project, it is clear that web interviewing is a compelling alternative to conventional mail and telephone instruments. The technologies developed here have both immediate and future applications that result in improved efficiency, capability and effectiveness of travel surveys.
Adler, T., L. Rimmer, G Bandy and D. Schellinger (2000). "Use of Respondent-Interactive"
"Geocoding in the Baltimore Mode Choice Survey." Transportation Research Record 1719, Transportation Research Board, Washington, D. C.
Bimber, B. (2001). "Data on the Internet Growth in the U.S." unpublished survey data and data collected from secondary sources, University of California, Santa Barbara.
Cambridge Systematics (1996). Travel Survey Manual, U. S. Department of Transportation Publication FHWA-PL-96-029.
Dillman, D. (2000) Mail and Internet Surveys: The Tailored Design Method. Second Edition, John Wiley & Sons.
Dillman, D., S. Caldwell and M. Gansemer (2000). "Visual Design Effects on Item Nonresponse to a Question About Work Satisfaction." Working Paper, Washington State University.
Falzarano, S., T. Adler and W. Ristau (1999). "Traveler Reactions to Congestion Pricing Concepts for New York's Tappan Zee Bridge." Transportation Research Record 1659, Transportation Research Board, Washington D. C.
Resource Systems Group (1999). Computer-Based Intelligent Travel Survey System: CASI/Internet Travel Diaries with Interactive Geocoding. U. S. Department of Transportation.
Resource Systems Group (2000). Orlando Mode Choice Survey. Florida Department of Transportation.
Stopher, P. R. and H. M. A. Metcalf (1996). Synthesis of Highways Practice 236: Methods for Household Travel Surveys. Transportation Research Board, Washington, D. C.
TRB Home | OHPI Home | OHPI Feedback