U.S. Department of Transportation
Federal Highway Administration
1200 New Jersey Avenue, SE
Washington, DC 20590
202-366-4000
| Conditions and Performance Report Appendix A—Interstate Needs |
| Conditions and Performance Chapter Listing Conditions and Performance Home Page Current Conditions and Performance Projected Conditions and Performance in 2007 Resources Needed to Maintain and Improve the Interstate System Addressing Interstate System Needs
|
|
| Exhibit A-1 |
| Interstate Pavement Condition, by Percent Total Miles, 1997 |
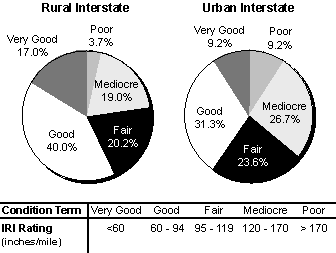 |
The average IRI reported for HPMS sample sections on rural Interstates was 93 inches per mile, which falls in the "good" range in Exhibit A-1. The average IRI for urban Interstate sections was 114, which would be classified as "fair."
Chapter 3 also discusses other factors that affect the level of service and safety of the highway system. [See Exhibits 3-14, 3-15, 3-17, and 3-18.] Rural and Urban Interstate Lane Width are shown in Exhibit A-2. In 1997, 99.8 percent of rural interstate mileage had lane widths of 12 feet or wider. For urban Interstate mileage, 99.4 percent met or exceeded the 12 foot standard.
| Exhibit A-2 |
| Rural and Urban Interstate Lane Width, 1997 |
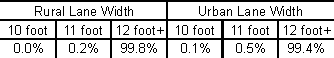 |
Exhibit A-3 shows the horizontal and vertical alignment adequacy for rural Interstate highways. Of total rural Interstate highways mileage, 95.5 percent is rated as "Code 1" for horizontal alignment, meaning that all curves meet appropriate design standards. The remaining 4.5 percent are below design standards. For vertical alignment, 93.0 percent of rural Interstate mileage is rated as "Code 1," meaning that all grades meet appropriate design standards. The remaining 7.0 percent are below design standards.
Exhibit A-3. Rural Interstate Horizontal and Vertical Alignment, 1997
The vast majority of Interstate mileage consists of divided highways with at least four lanes and full access control. However, in 1997 there were 1,100 miles of rural interstate that did not meet this standard, concentrated mainly in Alaska. None of Alaska's 1,034 rural Interstate miles meet this criteria. For urban Interstates, 104 miles do not meet the criteria specified; 53 of these miles are in Puerto Rico.

