U.S. Department of Transportation
Federal Highway Administration
1200 New Jersey Avenue, SE
Washington, DC 20590
202-366-4000
| Conditions and Performance Report Appendix C—National Highway System Freight Intermodal Connectors |
| Conditions and Performance Chapter Listing Conditions and Performance Home Page
|
|
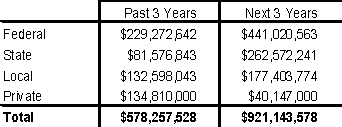
| Exhibit C-7 |
| Funding by Source* |
 |
| * The "Past 3 Years" funding represents improvements made between November 1995 and late 1998, when the field inventory of the connectors was collected. For most connectors, funding identified for the "Next 3 Years" represents planned improvements for 1999 through 2001. |
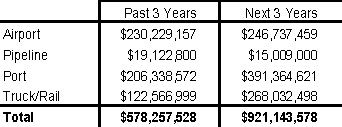
Exhibit C-8 shows funding by terminal type.
| Exhibit C-8 |
| Funding by Terminal Type* |
 |
| * The "Past 3 Years" funding represents improvements made between November 1995 and late 1998, when the field inventory of the connectors was collected. For most connectors, funding identified for the "Next 3 Years" represents planned improvements for 1999 through 2001. |
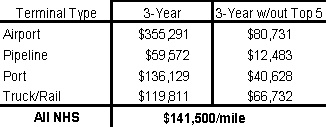
To make a comparison with investment levels on the NHS system, the annual investments were calculated on a per mile basis. Exhibit C-9 shows annual investments per mile by terminal type for three years beginning in 1995.
| Exhibit C-9 |
| Annual Investment Levels Per Mile |
 |
| * The "3-Year" funding represents improvements made between November 1995 and late 1998, when the field inventory of the connectors was collected. |
When looking at average annual investments per mile on the overall NHS System of $141,500, connectors compare favorably. However, this may not represent what is occurring on the vast majority of connectors. To demonstrate this, the annual investment level without the five most costly projects was calculated. For example, these are "mega" projects like the Alameda Corridor and the San Francisco Airport connections that are not representative of investment activity on a typical connector. Airports seem to do the best but this may be due to the associated passenger activity and the importance of air travel to a community. Truck/rail is next best with a significant amount of work associated with modernizing and relocating terminals. The level of investment for ports appears to be very low ($40,628), less than 30 percent of the average for the NHS ($141,500), especially since ports exhibit the most deficiencies overall.
These investment levels on the connectors seem to indicate that there is significant under investment on freight connectors. The exhibit below may give some indication as to why this is occurring.
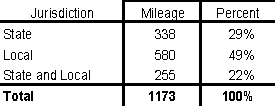
Exhibit C-10 shows that most connectors are owned by local governments, which may account for the low investments levels on freight connectors. Typically, local jurisdictions see freight as a private business activity which benefits the region and Nation as a whole. Since local roads are typically not a responsibility of the States, and in many cases cannot match Federal funding on local roads, they do not see freight connectors as their responsibility. States and MPOs often see freight as a lower priority because of the pressing needs of passenger travel.
| Exhibit C-10 |
| Freight Connector Mileage by Jurisdiction |
 |
The inventory form also asked what factors contributed to needed improvements going unprogrammed. Those indicated from the survey form as to why this is occurring (in order of importance) are: 1) Low priority in State/MPO plans; 2) Lack of local match or sponsorship; 3) Lack of private sector participation; 4) Neighborhood-Community opposition; 5) Environmental concerns; and 6) Physical or Other Constraints.