| Conditions and Performance
Chapter Listing
Conditions and
Performance Home Page
Introduction
Summary
Highway
Safety
Transit
Safety
|

Transit Safety

National data on public transit safety are reported in the National Transit
Database. This data includes the total number of incidents, fatalities, and
injuries reported by transit operators. The figures here are for directly
operated service only; reporting of safety data for purchased transportation
services has only recently begun. Comparable data on transit safety are
available since the 1990 reporting year.
Reportable transit safety incidents include all incidents involving
injuries, deaths, fire, or property damage over $1,000. Property damage
includes both damage to transit vehicles and facilities and other vehicles that
may be involved. Injuries and fatalities include those suffered by both
riders and non-riders. Injuries and fatalities to riders may be sustained
while boarding, alighting, or waiting for transit vehicles, as well as
traveling inside transit vehicles. Non-rider injuries and fatalities include
those sustained by pedestrians, trespassers, bicyclists, and the occupants of
other motorized vehicles involved in a collision with a transit vehicle.
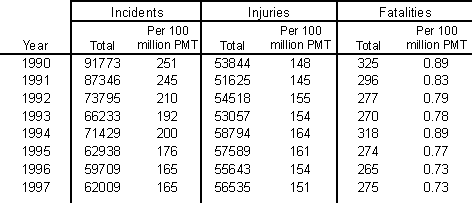
Exhibit 5-9 shows annual transit incidents, injuries, and fatalities for the
period 1990 to 1997, expressed both as annual totals and as rates per 100
million passenger miles. The data show that safety incidents involving transit
have declined considerably since 1990, falling from 251 per 100 million
PMT to 165. Injuries sustained in transit incidents, however, have remained
relatively stable over the same time period, at roughly 150 per
100 million PMT. Fatality rates have also declined considerably over the
7-year period, from .89 per 100 million PMT to .73.
| Exhibit 5-9 |
Annual Transit-Related
Incidents, Injuries, and Fatalities, 1990-1997
Directly Operated Service |
 |
| Source: National Transit
Database. |
Exhibit 5-10 shows incident, injury, and fatality rates for the five largest
transit modes. Incident and injury rates have consistently been highest for
demand response services. Commuter rail service has the lowest injury and
incident rates, but has one of the highest fatality rates, reflecting the
higher speeds at which these vehicles operate. Buses, on the other hand, have
consistently had above-average injury and incident rates coupled with
below-average fatality rates. Fatality rates for light rail have shown
considerable year-to-year variation over the period, while heavy rail fatality
rates have been consistently decreasing.
Exhibit 5-10. Transit
Incidents, Injuries, and Fatalities
Annual Rates Per 100 Million Passenger Miles by Mode, 1990-1997
Directly Operated Service
|
