U.S. Department of Transportation
Federal Highway Administration
1200 New Jersey Avenue, SE
Washington, DC 20590
202-366-4000
| |
| Conditions and Performance Report Executive Summary |
| Executive Summary Chapter Listing Conditions and Performance Home Page
|
|
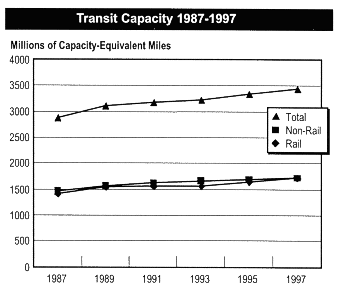
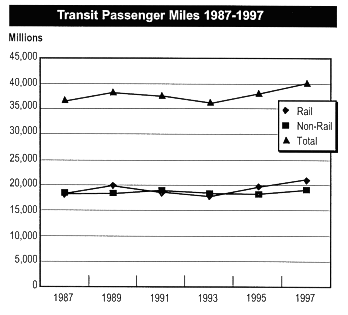
Mass transit in the U.S. performs three public policy functions: providing basic mobility to the poor, disabled, young, and old; encouraging location efficiency through dense, mixed-use development; and assisting in congestion management by providing an alternative to automobile travel, especially in peak periods. Data from the 1995 NPTS indicate that congestion management accounts for 35 percent of transit trips, while basic mobility and location efficiency account for 40 percent and 25 percent, respectively. Transit trips fulfilling a congestion management function are predominantly work trips and are significantly longer on average than trips associated with the other two functions. They are also considerably more peaked during the morning and afternoon rush hours. A significantly larger percentage of basic mobility trips are made by bus. In 1997, there were 149,468 transit vehicles, 9,922 miles of track, 2,681 stations, and 1,179 transit maintenance facilities in operation in the U.S. Transit systems operated 8,602 route miles of rail service in 1997, an increase of 44.2 percent since 1987. Non-rail route miles were up 10.4 percent since 1987 to 156,733. Transit system capacity, measured in vehicle revenue miles (adjusted for vehicle capacity), increased 19.7 percent from 1987 to 1997. Rail capacity increased 22.4 percent, while non-rail increased 17.1 percent. Capacity for rail and non-rail in 1987 was almost identical, at 1.72 billion miles each. Transit passenger miles increased by 10.9 percent between 1993 and 1997, from 36.22 billion to 40.18 billion. This reversed a slight decline from 1989 to 1993. |
 Growth was most pronounced for rail transit modes, which increased 18.3 percent, from 17.87 billion to 21.14 billion passenger miles.  Transit vehicle occupancy decreased from 1987 to 1997, from 12.7 passengers per vehicle (adjusted for capacity) to 11.7. Vehicle occupancy increased from 1993 to 1997, however, with rail modes going from 11.4 passengers per vehicle to 12.3, and non-rail modes remaining constant at 11.1 over that period. |