U.S. Department of Transportation
Federal Highway Administration
1200 New Jersey Avenue, SE
Washington, DC 20590
202-366-4000
|
Status
of the Nation's Highways, Bridges, and Transit:
2002 Conditions and Performance Report |
| Chapter 19: Air Quality | |||||||||||||||||||||||||||||||||||||||||||||||||||||||||||||||||||||||||||||||||||||||||
|
Index Introduction Highlights Executive Summary Part I: Description of Current System
Part II: Investment Performance Analyses
Part III: Bridges
Part IV: Special Topics Part V: Supplemental Analyses of System Components
Appendices |
ISTEA and TEA-21The Intermodal Surface Transportation Efficiency Act of 1991 (ISTEA) revamped the Federal highway and transit programs to give State and local officials added tools to improve air quality, including a strengthened planning process and programs specifically directed to air quality improvement and transit. ISTEA gave State and local officials flexibility in choosing among highway, transit, and other transportation alternatives, allowing for the best mix of projects to address air quality. ISTEA also required States and metropolitan planning organizations (MPOs) to carry out a comprehensive transportation planning process in order to better coordinate the best mix of transportation projects which will improve air quality. ISTEA also included a major new program to deal with transportation-related emissions. The Congestion Mitigation and Air Quality Improvement Program (CMAQ) directs funding to projects and programs to reduce emissions in nonattainment and maintenance areas. In 1998, the Transportation Equity Act for the 21st Century (TEA-21) continued the provisions of ISTEA, and significantly increased funding levels to provide for an expanded source of funding which can be used for transportation programs and projects that reduce motor vehicle emissions. Congestion Mitigation Air Quality Improvement ProgramThe CMAQ Program provides funds for transportation related projects that will reduce pollutant emissions in areas not meeting air quality standards for ozone, carbon monoxide and particulate matter. Over $8.1 billion has been authorized over the six-year program period of TEA-21 extending from 1998 through 2003. While reducing congestion is a goal of CMAQ, the primary focus of the program has been on improving air quality. Generally, the money is used for projects like transportation control measures (TCMs) that are described further in this section and have the intended purpose of reducing emissions from vehicles. The amount of funds available for CMAQ projects for any given State is dependent on the severity of its air pollution and on the size of the population exposed to that pollution. Funds apportioned to States are based on nonattainment and maintenance areas, and must be used in those areas. However, States are guaranteed a minimum apportionment of CMAQ funds. Projects that are typically funded include transit projects, traffic flow improvements, development of park-and-ride lots to encourage transit or carpooling/vanpooling, the development of employer-based programs, emissions inspection and maintenance programs, and other projects designed to reduce vehicle use and the resulting vehicle emissions. One of the key components of the CMAQ program is its flexibility, that allows State and local officials to fund the projects and programs that will work best in their communities to reduce emissions and address congestion. An evaluation of the success of the CMAQ Program was conducted by the National Academy of Sciences and completed in April 2002. The purpose of this study was to determine if the CMAQ program had been able to demonstrate that it was an effective program in reducing emissions from transportation sources, reducing congestion, and improving quality of life. The study found widespread support for the program although it noted that quantifying the success of the program was difficult because of the many different types of projects funded under the program for which there is no standard method for evaluating emission reductions. The report noted that CMAQ provided a “…valuable laboratory for learning how well different types of projects perform in improving air quality…” It also noted that some projects have been more successful than others in providing emission reductions. The report recommended that the CMAQ program be continued and offered some suggestions to improve the ability to quantitatively estimate the benefits of the projects. Funds provided by the CMAQ program only constitute a small percentage of the total funds used for transportation projects, and as such, affect only a small portion of the existing transportation network in a metropolitan area or nationally. Therefore, the gain from these projects will have obvious limits. Nonetheless, the CMAQ program serves a very important function in providing developmental funds for projects an area believes would help in reducing emissions. The air quality benefits for a project are determined and documented before that project can be considered eligible as a CMAQ project. Transportation Control MeasuresTransportation control measures are specific measures that are included in an area's air quality State implementation plan to reduce the use of single occupancy vehicles or to improve the efficiency of the transportation system. Exhibit 19-10 describes these types of measures. As with projects funded under the CMAQ program, it is believed that by encouraging the use of alternate forms of transportation or transportation patterns through these projects, reductions in emissions can be achieved, which will help areas meet air quality standards. Many of these projects and programs are targeted at changing behavioral patterns and therefore their effectiveness is a function of the value drivers place on their time, convenience and financial resources. Their effectiveness will be further limited by the relative size of the projects as discussed above. Transportation control measures are only part of the picture for reducing emissions and encompass a wide variety of alternatives including transit development, improvement or expansions programs, and behavioral programs promoting changes in personal transportation use patterns.
Inspection and Maintenance Programs and Other Control MeasuresOther control measures are as important in reducing emissions. For example, Inspection and Maintenance Programs are required in certain areas. These programs are intended to insure that vehicles are maintained properly so that the emissions from the vehicle are minimized. These programs provided significant emission reduction benefits since vehicles built prior to the 1990s emitted large quantities of some pollutants. The relative effectiveness of I&M programs has decreased in importance over the years as newer vehicles are emitting far less emissions than vehicles one decade ago and the deterioration of the vehicle emission control systems have been greatly reduced, resulting in cleaner vehicles operating for longer periods. Other measures to reduce emissions include accelerated vehicle retirement programs to encourage owners of older, higher polluting vehicles to turn in their vehicles and receive funds that can be used for the purchase of a lower polluting vehicle. Episodic emission control programs are designed to educate the public about individual activities that impact local air quality and can include messages encouraging people to use mass transit on days when air quality is anticipated to be poor. Other programs addressing land-use control and congestion pricing exist. The cumulative effect of all these programs has been a substantial impact on reducing emissions associated with motor vehicles. Public EducationThe causes of air pollution are not always intuitive and as a result, individuals, organizations and companies have different views on its solutions. Efforts to reduce emissions require a public education campaign to raise awareness on pollution's causes and cures. “It All Adds Up to Cleaner Air” is a program designed to educate the public on methods for reducing emissions. Its focus is to work with State and local agencies to increase public awareness of the connection between travel choices and congestion. The program is led by the Federal Highway Administration and has the support and endorsement of the Environmental Protection Agency and the Federal Transit Administration. These federal partners are working collaboratively with State and metropolitan officials to educate the public on causes of transportation related air pollution. Three core messages are the foundation of this program, including maintaining vehicles in top running condition, encouraging trip-chaining or combining several trips into one trip, and choosing alternative modes of transportation when possible. Public education is helping to reduce emissions from transportation activities by developing support for individual and community solutions.
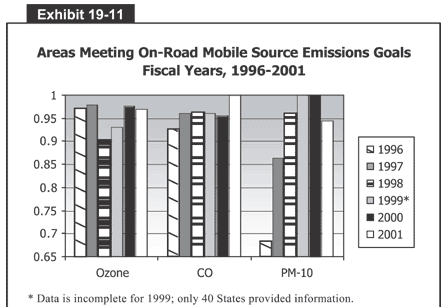
Transportation Planning and ConformityAs stated earlier, ISTEA strengthened the transportation planning process. One way it did this was by requiring States and MPOs to carry out a comprehensive planning process to better develop transportation plans that could help improve air quality. The requirements of ISTEA were matched with provisions in the 1990 amendments to the Clean Air Act limiting Federal transportation activities in nonattainment and maintenance areas under certain circumstances. This provision in the CAA is intended to integrate the transportation and air quality planning processes and is known as transportation conformity. It is seen as a way to ensure that Federal funding and approval goes to those transportation activities that are consistent with air quality goals. A conformity determination demonstrates that the total emissions projected for a transportation plan and program are within the emissions limits (“budgets”) established by the SIP, and that transportation control measures are implemented in a timely fashion. In 2001, a very high percentage (94-100 percent) of nonattainment and maintenance areas had developed transportation plans that met emissions reduction goals. This is described in Exhibit 19-11.
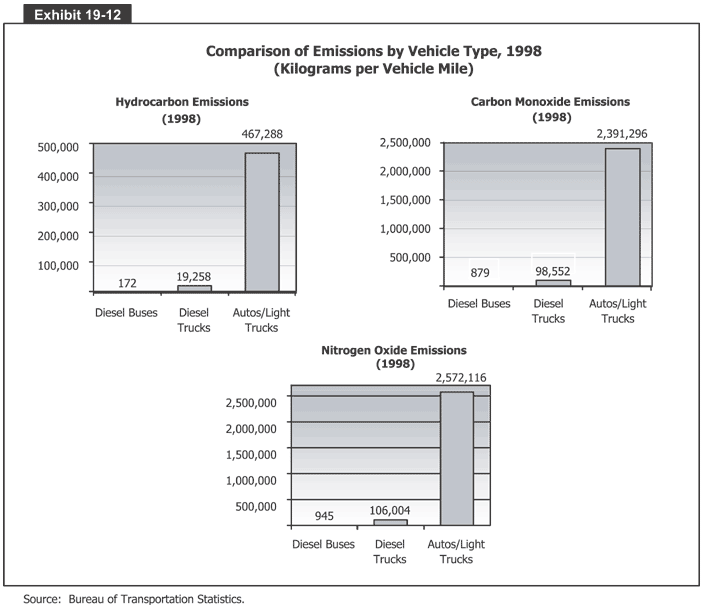
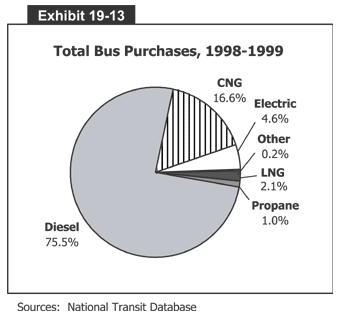
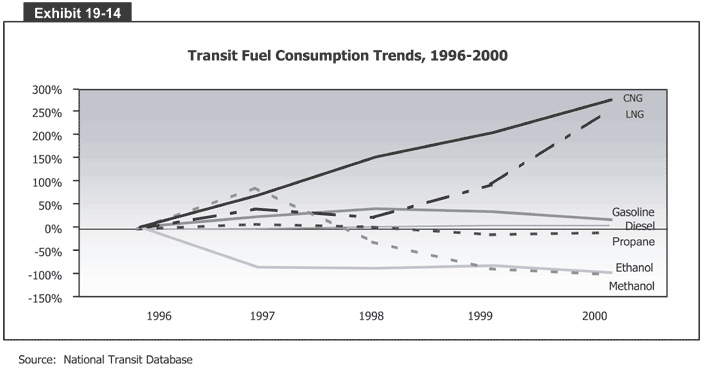
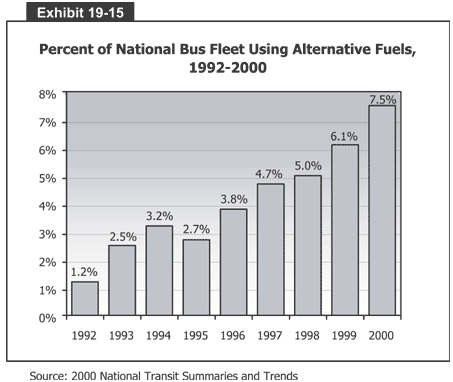
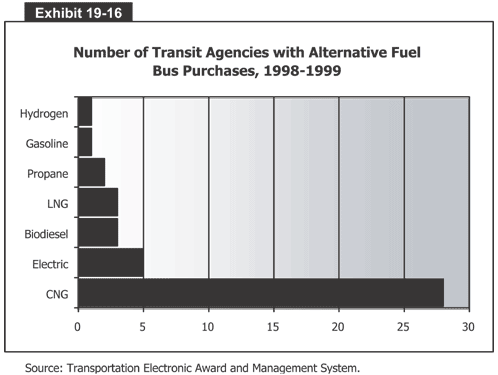
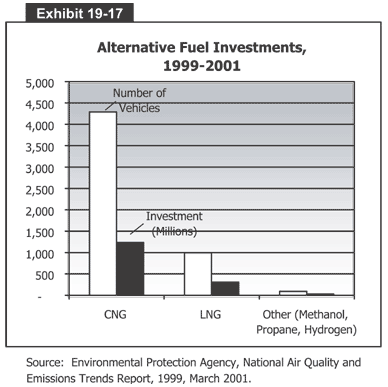
Transit and Clean AirTransit vehicles represent only a very small share of total on-road transportation vehicles. In 1998, for example, on-road transit vehicles represented only 0.06 percent of the total on-road vehicles in the United States. Of the total number of diesel heavy trucks and buses on the road in 1998, transit-specific buses represented less than one percent. In terms of transit's contribution to air emissions, the 1998 total emissions of hydrocarbon, carbon monoxide, and nitrogen oxide from transit buses were less than 2,000 kilograms per vehicle-mile as compared to more than 5,000,000 kilograms per vehicle-mile for all U.S. automobiles and light trucks. Exhibit 19-12 compares emissions from the bus fleet with emissions from diesel trucks, automobiles, and light trucks. In addition to improvements in automobile emissions control, technological improvements have reduced emissions from transit vehicles. Fuel and engine design improvements, such as the use of alternative fuels and the use of cleaner-burning diesel engines, have led to a more efficient transit fleet. Many of these developments have been made possible through the funding increases realized under ISTEA, TEA-21, and flexible funding programs like the CMAQ program. Buses represent the single largest mode of transit travel in the United States. In 1999, more than 43 percent of passenger miles traveled on transit services were on buses. Transit buses consume a large volume of fuel (on average, nearly 10,000 gallons of fuel per vehicle per year). Buses represent the largest consumer of diesel fuel in the transit industry. Because of the large consumption of fossil fuel by buses and the impact that fossil fuels may have on air quality, this section focuses on specifically on transit bus fleet emissions and developments in cleaner bus technologies. Diesel engines remain the overwhelming majority of bus engine types purchased by U.S. transit agencies. According to the American Public Transportation Association, diesel engines represented more than 75 percent of new bus purchases in 1998 and 1999. This is described in Exhibit 19-13. The second largest group of purchases in those years was for buses powered by compressed natural gas (CNG), representing more than 16 percent of all bus purchases during this period. Other bus types, including liquid natural gas, liquid petroleum gas, hydrogen fuel cell, biodiesel, and gasoline, represented less than 8 percent of new bus purchases. (See Exhibit 19-14.) Diesel engines provide relatively high fuel economy and reliability. Historically, diesel engines have emitted high levels of particulate emissions, sulfur dioxide, and nitrogen oxides. Today's diesel engines, however, are already substantially cleaner than those purchased only ten years ago. Through improved engine controls, cleaner fuel, and the use of advanced catalysts, conventional diesel engines are generating significantly lower levels of particulate and sulfur emissions. Another fuel source is natural gas. Unlike conventional diesel fuel, which contains sulfur particulates and often impurities, natural gas contains essentially no sulfur and is relatively clean-burning. It is also abundant in the United States. Because of the gaseous nature of this fuel, it must be stored onboard a vehicle in either a compressed gaseous state (CNG) or in a liquefied state (LNG). (See Exhibit 19-15.) CNG buses are becoming the largest segment of alternative fuel transit buses; in 1998 and 1999, for example, they constituted over 16 percent of new bus purchases. They require specialized vehicle fuel storage as well as fueling facility infrastructure. Specifically, the fuel tank on the bus must be able to handle pressurized fuel storage and the fueling infrastructure must install pressurizing natural gas pumps. The on-board gas cylinders are often quite large and can significantly affect the weight (and therefore fuel economy) of the vehicle. Liquefied natural gas (LNG) requires similar pressurized storage to CNG. LNG is almost pure methane and, because it is a liquid, has an energy storage density much closer to gasoline than CNG. The requirements of keeping the liquid very cold, along with its volatility, make its applications more limited for transportation purposes. LNG requires on-board fuel storage that can keep the fuel at a cold temperature. In 1998 and 1999, LNG buses represented about 2.1 percent of new bus purchases in the United States. (See Exhibit 19-16) A new interesting fuel source is biodiesel, a synthetically manufactured diesel fuel made from biomass products such as soybeans, canola oils, animal fats, waste vegetable oils, and microalgae oils. Once these oils are combined with alcohol to create biodiesel fuel, it can be used solely or blended with conventional diesel for use in vehicles. Pure biodiesel is considered to be essentially free of sulfur, non-toxic, and can be used in conventional diesel engines with no major modifications. In addition, under emissions testing conducted for the Clean Air Act, biodiesel may produce significantly less carbon monoxide and particulate emissions than conventional diesel. As a renewable fuel, it may also have benefits towards reducing greenhouse gases. In 1998 and 1999, three transit agencies purchased these experimental vehicles for use in their transit bus fleets. (See Exhibit 19-17.) Improvements are also being made to the actual design of buses. From 1999 to 2001, more than 300 transit agencies invested $1.57 billion in alternative fuel buses for their fleets. This funded the purchase of more than 5,300 vehicles. These investments included the purchase of new vehicles, retrofitting of existing vehicles, and infrastructure development or rehabilitation. According to the Energy Information Administration, alternative fuel transit buses currently operate in 39 States. Thirty-seven percent are operated in California and 15 percent in Texas. Other States with alternativefuel transit bus fleets that number more than 100 vehicles include Arizona, Georgia, Nevada, New Mexico, New York, Ohio, and Washington. Of this current fleet of alternative fuel vehicles, 70 percent were designated CNG, 15 percent LNG, 6 percent propane, and 4 percent all other alternative fuel types. While transit's contribution to air pollution is very low, transit agencies are still doing their part to reduce emissions from bus fleets. Since 1996, there is a clear indication that clean burning, more fuel-efficient buses are playing a larger role in transit. With the regulatory standards for reducing emissions, the financial incentives of TEA-21 and other legislation, and the availability of alternatives to traditional diesel engines, there is little reason to doubt that the amount of emissions generated by transit bus fleets will dramatically decline in both the near and the long term. ConclusionIt is true on a National level that air quality is getting better, but it is also true on at the local level in almost all metropolitan areas around the country. From 1990 to1999, only 9 percent of metropolitan areas had an upward trend of ozone concentrations; only one percent of metropolitan areas had an upward trend of PM-10 concentrations; and no metropolitan areas had an upward trend of carbon monoxide concentrations. Reducing pollutant emissions from motor vehicles has been the major factor to this trend in cleaner air, while enhancing the community and social benefits of transportation. Technological innovations, cleaner fuels, and the detailed highway and transit programs described in this chapter have reduced emissions significantly over the past 30 years, and this trend is projected to continue well into the future. |
||||||||||||||||||||||||||||||||||||||||||||||||||||||||||||||||||||||||||||||||||||||||
| Back |