U.S. Department of Transportation
Federal Highway Administration
1200 New Jersey Avenue, SE
Washington, DC 20590
202-366-4000
|
Status
of the Nation's Highways, Bridges, and Transit:
2002 Conditions and Performance Report |
| Chapter 8: Comparison of Spending and Investment Requirements | |||||||||||||||||||||||||||||||||||||||||||||||||||||||||||||||||||||||||||||||||||||||||||||||||||||||||||||||||||||||||||||||||||||||||||||||||||||||||||||||||||||||||||||||||||||||||||||||||||||||||||||||||||||||||||||||||
|
Index Introduction Highlights Executive Summary Part I: Description of Current System
Part II: Investment Performance Analyses
Part III: Bridges
Part IV: Special Topics Part V: Supplemental Analyses of System Components
Appendices |
2000 Capital Spending and Estimated Average Annual Investment RequirementsTotal Capital SpendingIn 2000, combined capital investment in public transportation by Federal, State, and local governments was $9.1 billion, below the requirements estimated by the Federal Transit Administration (FTA). FTA estimates that an additional investment of $5.7 billion annually (63.8 percent above actual capital investment in 2000) would be required to Maintain Conditions and Performance and an additional annual investment of $11.5 billion annually (127.5 percent above actual capital investment in 2000) would be required to Improve Conditions and Performance. [See Exhibit 8-7]. This comparison, however, overestimates the gap between capital investment requirements and future funding for transit capital investment. This overestimation results because of lag that occurs between the authorization of capital funds, the obligation of these funds and actual capital spending. Since TEA-21, annual obligations by FTA for capital investment have grown rapidly to $7.2 billion in FY 2000 from $4.1 billion in FY 1998. Higher levels of authorizations have not yet worked their way through the process into capital spending. As these higher levels of authorized funds are obligated and spent, capital investment will rise and the gap between actual capital spending and estimated annual capital investment requirements will decrease.
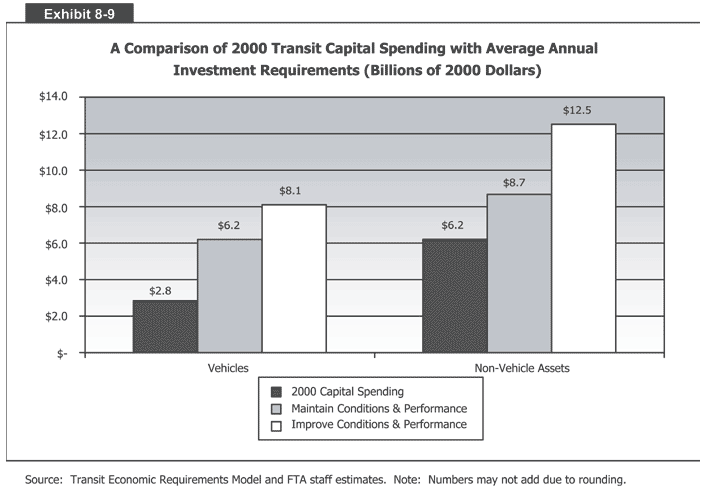
Capital Spending by Asset TypeIn 2000, $2.8 billion was invested in transit vehicles and $6.2 billion in non-vehicle transit infrastructure, i.e., facilities, guideway elements, stations, and systems. Between 2001 and 2020, investment in transit vehicles would need to grow more rapidly than investment in the non-vehicle transit infrastructure to both Maintain and Improve the transit infrastructure conditions and performance [See Exhibits 8-8 and 8-9].
Capital Spending on VehiclesFTA estimates that capital investment in transit vehicles would need to be $6.2 billion annually to Maintain Conditions and Performance (117 percent more than actual expenditures in 2000) and $8.1 billion annually to Improve Conditions and Performance (184 percent more than actual expenditures in 2000). In 2000, there were estimated to be 6,770 overage rail vehicles and 16,000 overage buses, compared with 5, 381 overage rail vehicles and 17,681 overage bus vehicles in 1997. (The decline in the number of overage buses has largely resulted from an estimated decline in the number of overage vans.) The entire bus fleet will need to be replaced at least once during the period of 2001 to 2020 since large and medium-sized buses have an expected life of 12 years and small buses and vans have an expected life of 7 years. Commuter rail selfpropelled passenger coaches and heavy rail vehicles account for the largest percentage of overage rail vehicles—22 percent and 61 percent, respectively. Each of these modes will need to purchase a considerable number of new vehicles. These purchases will only need to be made once between 2001 and 2020, given an expected rail vehicle life of 25 years. Rail vehicle requirements to Improve Conditions are higher than in the 1999 C&P Report because, as discussed in Chapter 3, conditions for all rail vehicles except commuter rail have been revised downward from a “good” to an “adequate” level. Capital Spending on Non-vehicle InfrastructureTERM estimates that an annual capital investment in non-vehicle transit infrastructure of $8.7 billion (40 percent above 2000 capital spending) would be needed to Maintain Conditions and Performance of these assets and $12.5 billion (101 percent above 2000 capital spending) would be needed to Improve them. As discussed in Chapter 7, the bulk of this investment would be needed for guideway elements—elevated structures (bridges), tunnels, and track—and rail systems. Investment Requirements versus Projected 2001-2003 SpendingExhibit 8-10 provides estimated total (Federal, State, and local) capital funding available from 2000 to 2003 in current and constant 2000 dollars. Note that estimated capital funding available in 2000 is $12.4 billion, $3.4 billion higher than actual capital spending. In the case of formula funding this difference reflects a lag between authorizations and spending and in the case of flexible funding a lag between the obligations and spending. Exhibit 8-10 compares Federal capital funding levels from 2000-2003 in current and constant 2000 dollars.
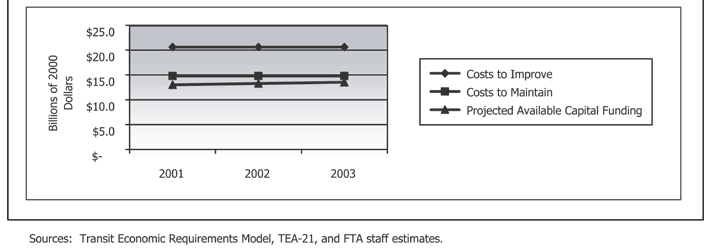
A Comparison of Authorized Capital Expenditures with Estimated Investment Requirements (2000-2003)Projected available funding levels for the duration of TEA-21 are lower than estimated investment requirements, with the gap declining over the period. [See Exhibit 8-11]. In 2003, investment requirements to Maintain Conditions and Performance are estimated to exceed available authorized funding levels by 9.6 percent, and those to Improve Conditions and Performance by 52.2 percent.
Sources: Transit Economic Requirements Model, TEA-21, and FTA staff estimates. Comparison with Previous ReportsExhibit 8-12 compares the percentage difference between current spending levels and investment requirements in 2000 to the same percentage differences provided in the 1995, 1997, and 1999 Conditions and Performance Reports. As a result of methodological changes, estimated investment requirements are not directly comparable from year to year. The ratio of investment requirements to actual spending to Maintain Conditions and Performance increased to approximately 60 percent in the present report from approximately 40 percent in earlier reports. The increase in this ratio between 1997 and 2000 reflects increases in vehicle acquisition costs and increased purchases in general as a result of expansion in infrastructure size. The increase in the ratio of investment requirements to actual expenditures under the Improve Conditions and Performance scenario resulted in part from the downward revision in the average condition of rail vehicle conditions based on re-estimated decay curves. Again these differences will narrow in the future as obligated funds are invested.
|
||||||||||||||||||||||||||||||||||||||||||||||||||||||||||||||||||||||||||||||||||||||||||||||||||||||||||||||||||||||||||||||||||||||||||||||||||||||||||||||||||||||||||||||||||||||||||||||||||||||||||||||||||||||||||||||||
| Back |