U.S. Department of Transportation
Federal Highway Administration
1200 New Jersey Avenue, SE
Washington, DC 20590
202-366-4000
Conditions and Performance
Status
of the Nation's Highways, Bridges, and Transit:
2002 Conditions and Performance Report
|
Exhibit 13-7:
Private Vehicle Share of Total Private Vehicle/Airplane Recreation Long Distance Trips by Roundtrip Distance and Income, 1995
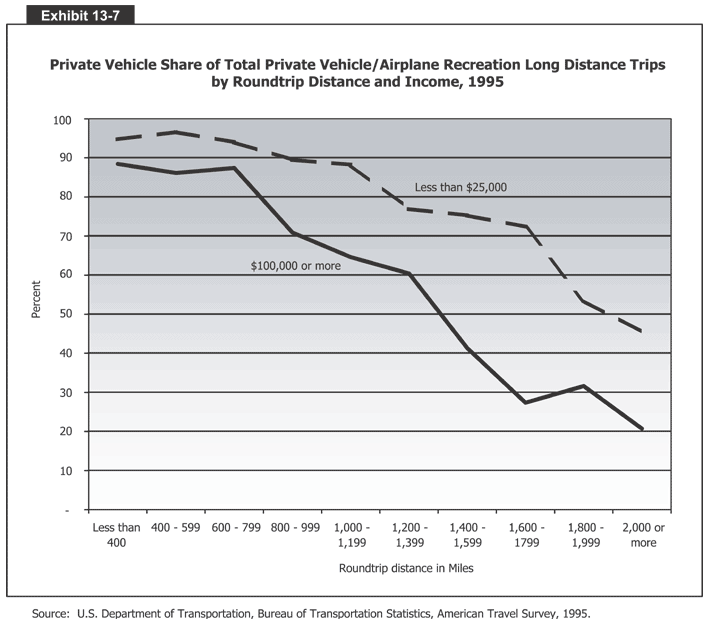 Exhibit 13-7 is a chart that shows the private vehicle share of total private vehicle/airplane recreation long distance trips by roundtrip distance and income in 1995. The vertical axis measures percentages from 0 to 100 in increments of 10 percent. The horizontal axis has 10 categories of roundtrip distance in miles, from less than 400 to 2,000 or more, in increments of 200 miles. There are two lines; the first one, for incomes less than $25,000, starts at 95 percent for less than 400 roundtrip miles and gradually decreases to 90 percent at 1,000 miles, 78 percent at 1,200 miles, 72 percent at 1,600 miles, 52 percent at 1,800 miles, and 46 percent at 2,000 miles or more. The second line, for incomes of more than $100,000, starts at 89 percent for less than 400 to 800 roundtrip miles and gradually decreases to 65 percent at 1,000 miles, 60 percent at 1,200 miles, 28 percent at 1,600 miles, 31 percent at 1,800 miles, and 20 percent at 2,000 miles or more.
Source: U.S. Department of Transportation, Bureau of Transportation Statistics,
American Travel Survey, 1995.
Back
to Chapter 13
Return to top
Page last modified on November 7, 2014

