U.S. Department of Transportation
Federal Highway Administration
1200 New Jersey Avenue, SE
Washington, DC 20590
202-366-4000
Conditions and Performance
Status
of the Nation's Highways, Bridges, and Transit:
2002 Conditions and Performance Report
|
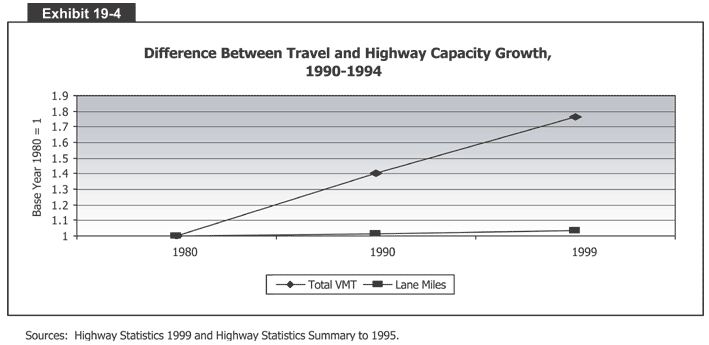
Exhibit 19-4:
Difference Between Travel and Highway Capacity Growth, 1990-1994
 Exhibit 19-4 is a chart that shows the difference between travel and highway capacity growth from 1990 to 1994. The vertical axis measures "base year 1980 = 1" from 1 to 1.9 in increments of 0.1. The horizontal axis has three years: 1980, 1990, and 1999. The first of two lines, for total VMT, starts at 1 in 1980, rises to 1.4 in 1990, and ends just shy of 1.8 in 1999. The other line, for lane-miles, also starts at 1 in 1980, but barely rises above 1 by 1999.
Sources: Highway Statistics 1999 and Highway Statistics Summary to 1995.
Back
to Chapter 19
Return to top
Page last modified on November 7, 2014
