U.S. Department of Transportation
Federal Highway Administration
1200 New Jersey Avenue, SE
Washington, DC 20590
202-366-4000
Conditions and Performance
Status
of the Nation's Highways, Bridges, and Transit:
2002 Conditions and Performance Report
|
Exhibit 22-5:
Comparison of Growth in Truck VMT, Millions of Miles per Day, 1998 to 2020
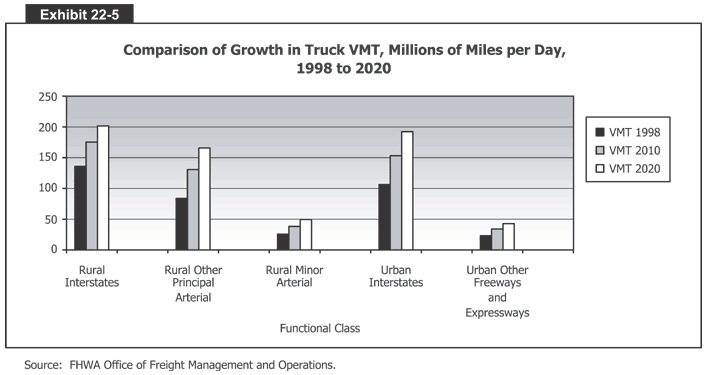 Exhibit 22-5 is a bar graph that compares growth in truck VMT in millions of miles per day from 1998 to 2020. The vertical axis measures truck VMT from 0 to 250 in increments of 50 million miles per day. The horizontal axis has five bars with three parts. The first, for rural interstates, shows that there were 140 million truck VMT per day in 1998, while the number is projected to be 170 million in 2010 and 200 million in 2020. The second, for other rural principal arterials, shows that there were 85 million truck VMT per day in 1998, while the number is projected to be 130 million in 2010 and 160 million in 2020. The third, for rural minor arterials, shows that there were 25 million truck VMT per day in 1998, while the number is projected to be 40 million in 2010 and 50 million in 2020. The fourth, for urban interstates, shows that there were 105 million truck VMT per day in 1998, while the number is projected to be 155 million in 2010 and 192 million in 2020. And the fifth grouping, other urban freeways and expressways, shows that there were 20 million truck VMT per day in 1998, while the number is projected to be 35 million in 2010 and 45 million in 2020.
Source: FHWA Office of Freight Management and Operations.
Back
to Chapter 22
Return to top
Page last modified on November 7, 2014

