U.S. Department of Transportation
Federal Highway Administration
1200 New Jersey Avenue, SE
Washington, DC 20590
202-366-4000
Conditions and Performance
Status
of the Nation's Highways, Bridges, and Transit:
2002 Conditions and Performance Report
|
Exhibit 25-4:
Linear Deficiencies by Population Groups
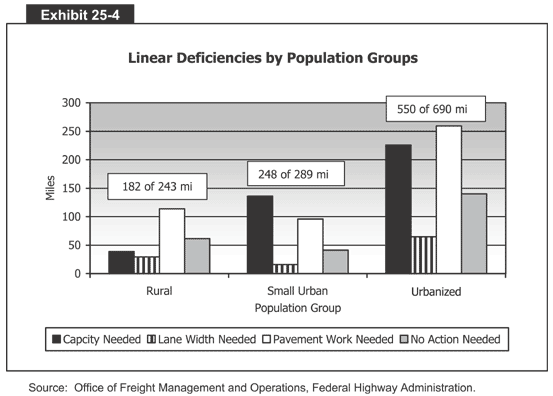 Exhibit 25-4 is a bar graph that shows linear deficiencies by population groups. The vertical axis measures miles from 0 to 300 in increments of 50 miles. The horizontal axis has three bars with four parts each. The first bar, for rural populations, or 182 of 243 miles, had 45 "capacity needed" miles, 30 "lane width needed" miles, 115 "pavement work needed" miles, and 55 miles where no action was needed. The second bar, for small urban populations, or 248 of 289 miles, had 140 "capacity needed" miles, 20 "lane width needed" miles, 98 "pavement work needed" miles, and 45 miles where no action was needed. And the third bar, for urbanized populations, or 550 of 690 miles, has 225 "capacity needed" miles, 60 "lane width needed" miles, 255 "pavement work needed" miles, and 140 miles where no action was needed.
Source: Office of Freight Management and Operations, Federal Highway Administration.
Back
to Chapter 25
Return to top
Page last modified on November 7, 2014

