U.S. Department of Transportation
Federal Highway Administration
1200 New Jersey Avenue, SE
Washington, DC 20590
202-366-4000
Conditions and Performance
Status
of the Nation's Highways, Bridges, and Transit:
2002 Conditions and Performance Report
|
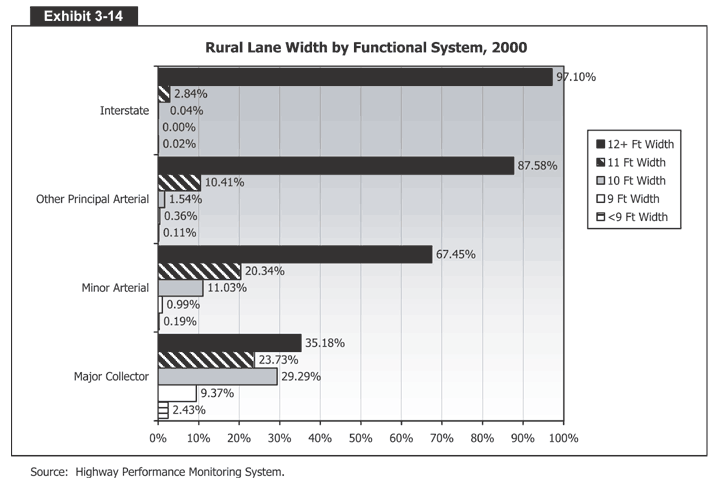
Exhibit 3-14:
Rural Lane Width by Functional System, 2000
 Exhibit 3-14 is a bar graph that shows rural lane width by functional system in 2000. The vertical axis has four bars with five parts each. The horizontal axis measures percentages from 0 to 100 in increments of 10 percent. The first group of bars, for interstates, shows that 97.10 percent of rural lanes have a width of 12+ ft., 2.80 percent have a width of 11 ft., 0.04 have a width of 10 ft., 0.00 have a width of 9 ft., and 0.02 have a width of less than 9 ft. The second group of bars, for other principal arterials, shows that 87.58 percent of rural lanes have a width of 12+ ft., 10.41 percent have a width of 11 ft., 1.54 have a width of 10 ft., 0.36 have a width of 9 ft., and .11 have a width of less than 9 ft. The third group of bars, for minor arterials, shows that 67.45 percent of rural lanes have a width of 12+ ft, 20.34 percent have a width of 11 ft., 11.03 have a width of 10 ft., 0.99 have a width of 9 ft., and 0.19 have a width of less than 9 ft. And the fourth group of bars, for major collectors, shows that 35.18 percent of rural lanes have a width of 12+ ft., 23.73 percent have a width of 11 ft., 29.29 have a width of 10 ft., 9.37 have a width of 9 ft., and 2.43 have a width of less than 9 ft.
Source: Highway Performance Monitoring System.
Back
to Chapter 3
Return to top
Page last modified on November 7, 2014
