U.S. Department of Transportation
Federal Highway Administration
1200 New Jersey Avenue, SE
Washington, DC 20590
202-366-4000
Conditions and Performance
Status
of the Nation's Highways, Bridges, and Transit:
2002 Conditions and Performance Report
|
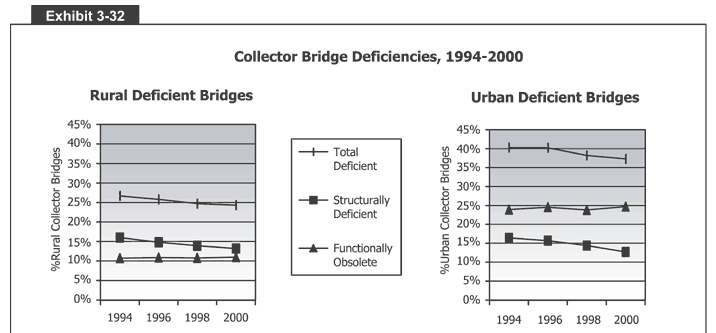
Exhibit 3-32:
Collector Bridge Deficiencies, 1994-2000
 Exhibit 3-32 includes two charts that show the percentage of deficient collector bridges in rural and urban areas. The vertical axis on the chart on the left, for rural deficient collector bridges, measures percentages of rural collector bridges from 0 to 45 in increments of 5 percent. The horizontal axis measures the years 1994, 1996, 1998, and 2000. Functionally obsolete rural collector bridges stayed at about 11 percent over the time period. Structurally deficient rural collector bridges declined steadily from 16 percent in 1994 to about 13 percent in 2000. And the total percentage of deficient rural collector bridges declined steadily from about 27 percent in 1994 to just under 25 percent in 2000. The vertical axis on the chart on the right, for urban deficient collector bridges, also measures percentages of urban collector bridges from 0 to 45 in increments of 5 percent, and the horizontal axis also measures the years 1994, 1996, 1998, and 2000. Functionally obsolete urban collector bridges stayed between 24 and 25 percent over the time period. Structurally deficient urban collector bridges declined steadily from about 16 percent in 1994 to 12 percent in 2000. And the total percentage of deficient urban collector bridges declined steadily from about 40 percent in 1994 and 1996 to 38 percent in 1998 and 37 percent in 2000.
Back
to Chapter 3
Return to top
Page last modified on November 7, 2014
