U.S. Department of Transportation
Federal Highway Administration
1200 New Jersey Avenue, SE
Washington, DC 20590
202-366-4000
Conditions and Performance
Status
of the Nation's Highways, Bridges, and Transit:
2002 Conditions and Performance Report
|
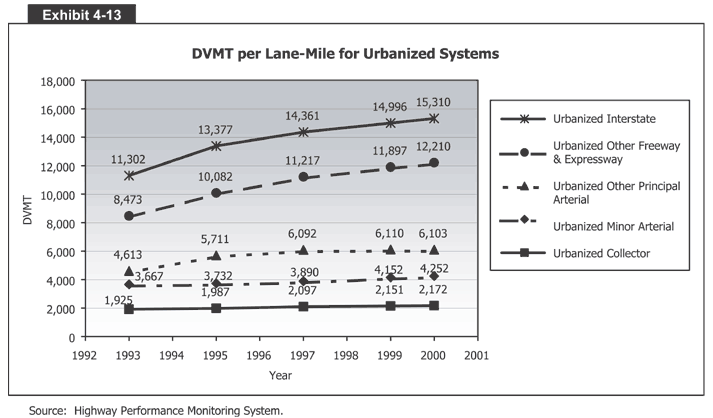
Exhibit 4-13:
DVMT per Lane-Mile for Urbanized Systems
 Exhibit 4-13 is a chart that shows DMVT per lane-mile for urbanized systems. The vertical axis measures DVMT per lane miles from 0 to 18,000 in increments of 2,000. The horizontal axis measures each year from 1992 to 2001, though numbers are given for only five of those years. There are five lines, one for each type of urbanized road system. The first, for urbanized interstates, has the highest numbers; there were 11,302 DMVT per lane-mile in 1993, 13,377 in 1995, 14,361 in 1997, 14,996 in 1999, and 15,310 in 2000. The other four lines also project upward, but to a smaller degree and at smaller numbers. The second line, for other urbanized freeways and expressways, had 8,473 DMVT per lane-mile in 1993, 10,082 in 1995, 11,217 in 1997, 11,897 in 1999, and 12,210 in 2000. The third line, for other urbanized principal arterials, had 4,613 DMVT per lane-mile in 1993, 5,711 in 1995, 6,092 in 1997, 6,110 in 1999, and a slight drop to 6,103 in 2000. The fourth line, for urbanized minor arterials, had 3,667 DMVT per lane-mile in 1993, 3,732 in 1995, 3,890 in 1997, 4,152 in 1999, and 4,252 in 2000. And the fifth line, for urbanized collectors, had 1,952 DMVT per lane-mile in 1993, 1,987 in 1995, 2,097 in 1997, 2,151 in 1999, and 2,172 in 2000.
Source: Highway Performance Monitoring System.
Back
to Chapter 4
Return to top
Page last modified on November 7, 2014
