U.S. Department of Transportation
Federal Highway Administration
1200 New Jersey Avenue, SE
Washington, DC 20590
202-366-4000
Conditions and Performance
Status
of the Nation's Highways, Bridges, and Transit:
2002 Conditions and Performance Report
|
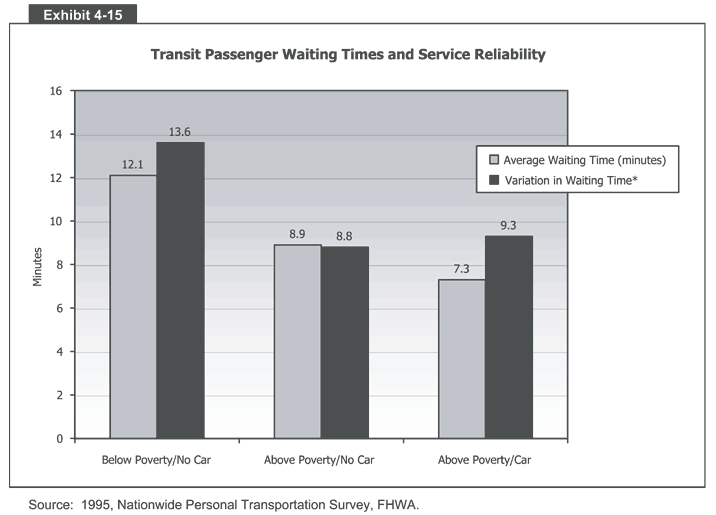
Exhibit 4-15:
Transit Passenger Waiting Times and Service Reliability
 Exhibit 4-15 is a bar graph that shows transit passenger waiting times and service reliability. The vertical axis measures minutes from 0 to 16 in increments of 2 minutes. The horizontal axis has three bars with two types of waiting times each. The first bar, for those below the poverty line with no car, had 12.1 minutes of average waiting time with 13.6 minutes of variation in waiting time. The second bar, for those above the poverty with no car, had 8.9 minutes of average waiting time with 8.8 minutes of variation in waiting time. And the third bar, for those above the poverty line with a car, had 7.3 minutes of average waiting time with 9.3 minutes of variation in waiting time.
Source: 1995, Nationwide Personal Transportation Survey, FHWA.
Back
to Chapter 4
Return to top
Page last modified on November 7, 2014
