U.S. Department of Transportation
Federal Highway Administration
1200 New Jersey Avenue, SE
Washington, DC 20590
202-366-4000
Conditions and Performance
Status
of the Nation's Highways, Bridges, and Transit:
2002 Conditions and Performance Report
|
Exhibit 4-16:
Percentage of Passengers Unable to Find a Seat Upon Boarding According to Trip
Type
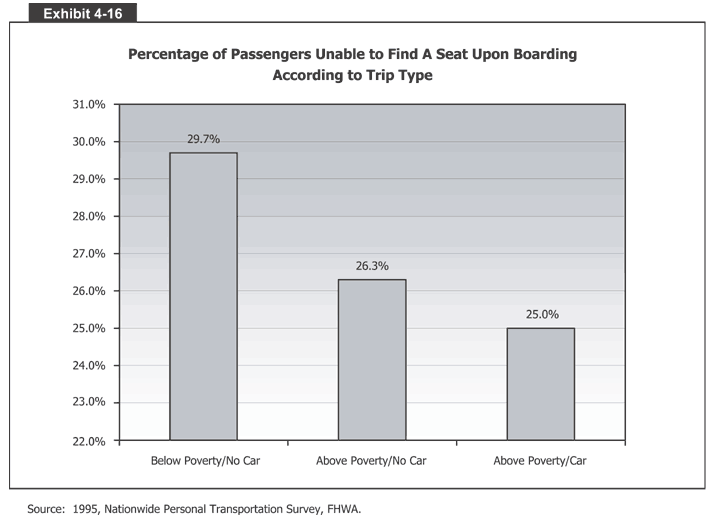 Exhibit 4-16 is a bar graph that shows the percentage of passengers unable to find a seat upon boarding, according to trip type. The vertical axis measures percentages from 22 to 31 in increments of 1 percent. The horizontal axis has three bars, one for each type. The first bar, for those below the poverty line with no car, had 29.7 percent unable to find a seat. The second bar, for those above the poverty line with no car, had 26.3 percent unable to find a seat. And the third bar, for those above the poverty line with a car, had 25.0 percent unable to find a seat.
Source: 1995, Nationwide Personal Transportation Survey, FHWA.
Back
to Chapter 4
Return to top
Page last modified on November 7, 2014

