U.S. Department of Transportation
Federal Highway Administration
1200 New Jersey Avenue, SE
Washington, DC 20590
202-366-4000
Conditions and Performance
Status
of the Nation's Highways, Bridges, and Transit:
2002 Conditions and Performance Report
|
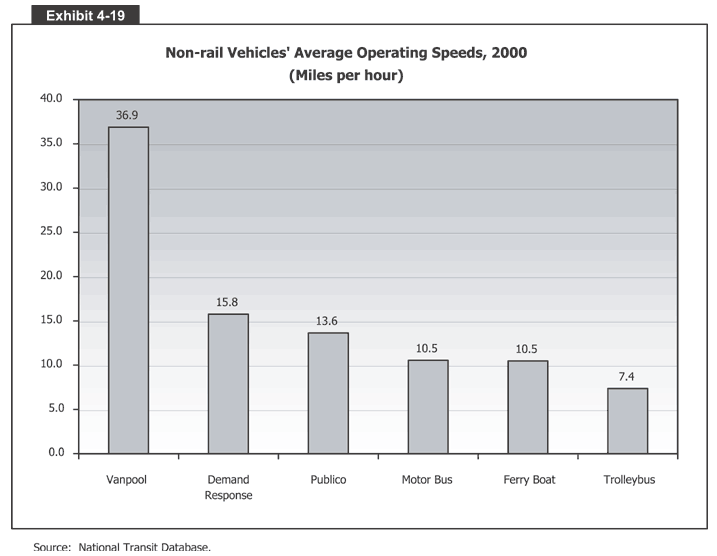
Exhibit 4-19:
Non-rail Vehicles' Average Operating Speeds, 2000 (Miles per hour)
 Exhibit 4-19 is a bar graph that shows non-rail vehicles' average operating speeds in 2000. The vertical axis measures miles per hour (MPH) from 0 to 40 in increments of 5 MPH. The horizontal axis has six bars, one for each type of non-rail system. Vanpools had the fastest average speed at 36.9 MPH, followed by demand response at 15.8 MPH, publico at 13.6 MPH, motor buses and ferries at 10.5 MPH, and trolley buses at 7.4 MPH.
Source: National Transit Database.
Back
to Chapter 4
Return to top
Page last modified on November 7, 2014
