U.S. Department of Transportation
Federal Highway Administration
1200 New Jersey Avenue, SE
Washington, DC 20590
202-366-4000
Conditions and Performance
Status
of the Nation's Highways, Bridges, and Transit:
2002 Conditions and Performance Report
|
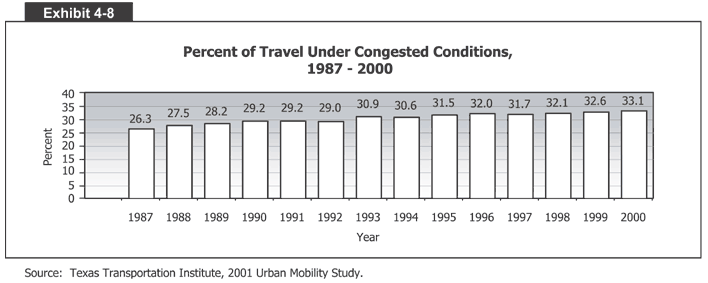
Exhibit 4-8:
Percent of Travel Under Congested Conditions, 1987 - 2000
 Exhibit 4-8 is a bar graph that shows the percent of travel under congested conditions from 1987 to 2000. The vertical axis measures percentages from 0 to 40 in increments of 5 percent. The horizontal axis measures each year from 1987 to 2000. The graph starts at a low of 26.3 percent in 1987, climbing to 27.5 in 1988, 28.2 in 1989 and 29.2 in 1990 and 1991. It then dipped slightly to 29.0 in 1992, rose to 30.9 in 1993, dipped to 30.6 in 1994, rose to 31.5 in 1995 and 32.0 in 1996, and dipped to 31.7 in 1997. Then for the last three years it rose to 32.1, 32.6, and a peak of 33.1 percent in 2000.
Source: Texas Transportation Institute, 2001 Urban Mobility Study.
Back
to Chapter 4
Return to top
Page last modified on November 7, 2014
