U.S. Department of Transportation
Federal Highway Administration
1200 New Jersey Avenue, SE
Washington, DC 20590
202-366-4000
Conditions and Performance
Status
of the Nation's Highways, Bridges, and Transit:
2002 Conditions and Performance Report
|
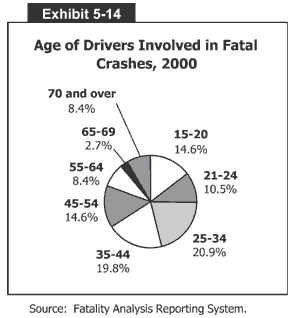
Exhibit 5-14:
Age of Drivers Involved in Fatal Crashes, 2000
 Exhibit 5-14 is a pie chart that shows the distribution of the age of drivers involved in fatal crashes in 2000. The largest group was 25 to 34 year-olds at 20.9 percent, followed by 35 to 44 year-olds at 19.8 percent. 14.6 percent were between 45 and 54 years old, and another 14.6 percent were 15 to 20 year olds. 10.5 percent were 21 to 24 years old, 8.4 percent between 55 and 64, 8.4 percent were over 70, and 2.7 percent were between 65 and 69 years of age.
Source: Fatality Analysis Reporting system.
Back
to Chapter 5
Return to top
Page last modified on November 7, 2014
