U.S. Department of Transportation
Federal Highway Administration
1200 New Jersey Avenue, SE
Washington, DC 20590
202-366-4000
Conditions and Performance
Status
of the Nation's Highways, Bridges, and Transit:
2002 Conditions and Performance Report
|
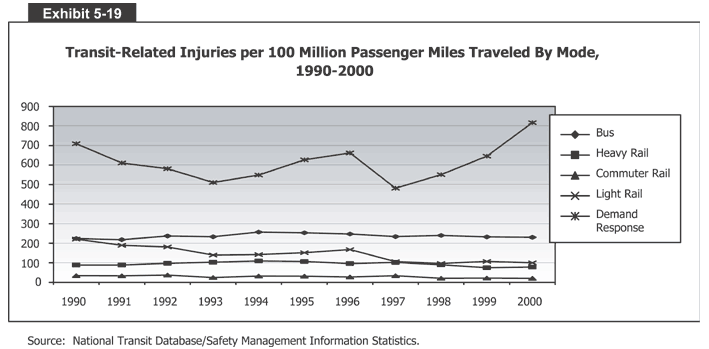
Exhibit 5-19:
Transit-Related Injuries per 100 Million Passenger Miles Traveled By Mode, 1990-2000
 Exhibit 5-19 is a chart that shows transit-related injuries per 100 million passenger miles traveled (PMT) by mode in from 1990 to 2000. The vertical axis measures injuries from 0 to 900 in increments of 100. The horizontal axis measures each year from 1990 to 2000. The first of five modes, demand response, had the largest numbers; there were 700 demand-response injuries in 1990, dropping to 600 in 1991, 580 in 1992, and 510 in 1993. The number then rose to 550 in 1994, 620 in 1995, and 660 in 1996. It then dropped to a low of 480 in 1997 before climbing to 550 in 1998, 640 in 1999, and peaking at 810 in 2000. The other four modes had lower and more stable injury numbers. Buses had between 220 and 250 injuries per 100 million PMT over the time period. Light rail started at about 220 in 1990 and steadily declined to 100 by 2000. Heavy rail hovered between about 80 and 110 between 1990 and 2000. And commuter rail had the lowest injury rates per 100 million PMT, between 10 and 25 per year over the time period.
Source: National Transit Database/Safety Management Information Statistics.
Back
to Chapter 5
Return to top
Page last modified on November 7, 2014
