U.S. Department of Transportation
Federal Highway Administration
1200 New Jersey Avenue, SE
Washington, DC 20590
202-366-4000
Conditions and Performance
Status
of the Nation's Highways, Bridges, and Transit:
2002 Conditions and Performance Report
|
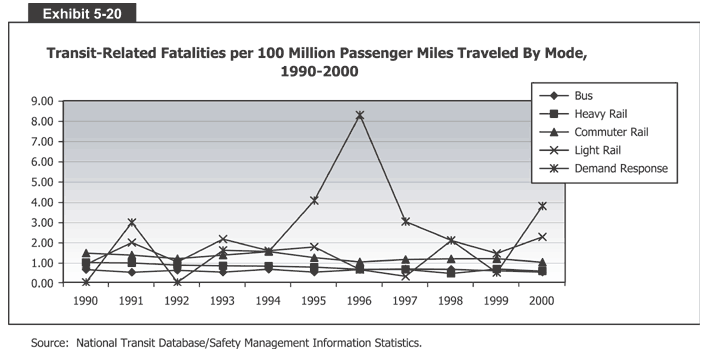
Exhibit 5-20:
Transit-Related Fatalities per 100 Million Passenger Miles Traveled By Mode,
1990-2000
 Exhibit 5-20 is a chart that shows transit-related fatalities per 100 million passenger miles traveled (PMT) by mode from 1990 to 2000. The vertical axis measures fatalities from 0 to 9 in increments of 1. The horizontal axis measures each year from 1990 to 2000. The first of five modes, demand response, had the most fatalities; there were none in 1990 and 1992, 3 in 1991, 2 in 1993 and 1994, 4 in 1995, a peak of 8 in 1996, 3 in 1997, 2 in 1998, 0 in 1999, and 4 in 2000. The other four modes had basically the same fatality rates from 1990 to 2000: between 0 and 2 per 100 million PMT.
Source: National Transit Database/Safety Management Information Statistics.
Back
to Chapter 5
Return to top
Page last modified on November 7, 2014
