U.S. Department of Transportation
Federal Highway Administration
1200 New Jersey Avenue, SE
Washington, DC 20590
202-366-4000
Conditions and Performance
Status
of the Nation's Highways, Bridges, and Transit:
2002 Conditions and Performance Report
|
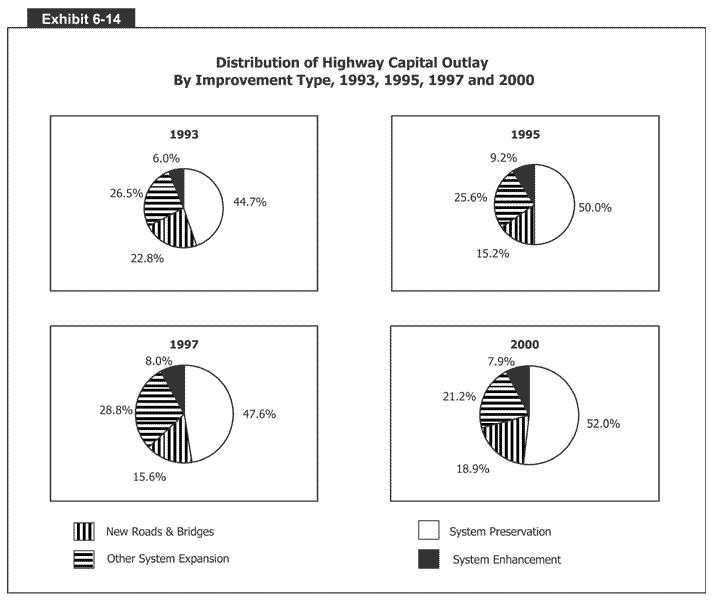
Exhibit 6-14:
Distribution of Highway Capital Outlay By Improvement Type, 1993, 1995, 1997
and 2000
 Exhibit 6-14 has four pie charts that show the distribution of highway capital outlay by improvement type over four years. The first, for 1993, has 44.7 percent going to system preservation, 26.5 to other system expansion, 22.8 to new roads and bridges, and 6.0 to system enhancement. The second pie chart, for 1995, has 50.0 percent going to system preservation, 25.6 to other system expansion, 15.2 to new roads and bridges, and 9.2 to system enhancement. The third pie chart, for 1997, has 47.6 percent going to system preservation, 28.8 to other system expansion, 15.6 to new roads and bridges, and 8.0 to system enhancement. And the fourth pie chart, for 2000, has 52.0 percent going to system preservation, 21.2 to other system expansion, 18.9 to new roads and bridges, and 7.9 to system enhancement.
Back
to Chapter 6
Return to top
Page last modified on November 7, 2014
