U.S. Department of Transportation
Federal Highway Administration
1200 New Jersey Avenue, SE
Washington, DC 20590
202-366-4000
Conditions and Performance
Status
of the Nation's Highways, Bridges, and Transit:
2002 Conditions and Performance Report
|
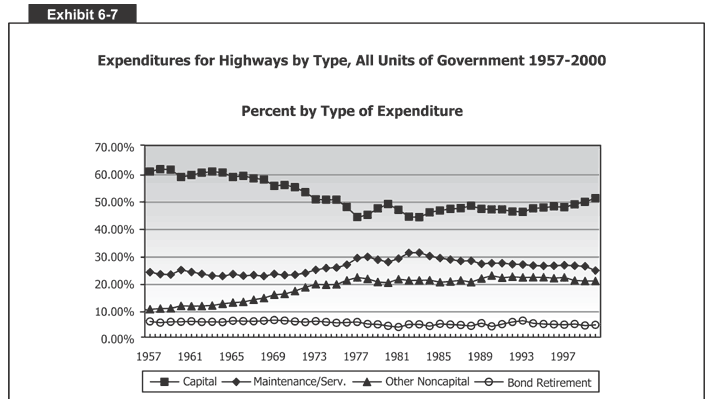
Exhibit 6-7:
Expenditures for Highways by Type, All Units of Government, 1957-2000
 Exhibit 6-7 includes a chart that shows highway expenditures by type for all units of government between 1957 and 2000. The vertical axis measures percentages from 0 to 70 in increments of 10 percent. The horizontal axis measures the years from 1957 to 2000 in increments of 4 years. There are four lines, one for each type of expenditure. The first, for capital, starts around 60 percent from 1957 to 1969, after which it drops steadily to a low of 43 percent in 1977. The line then stays between 43 and 50 percent between 1978 and 1996 before rising to around 52 percent in 2000. The second line, for maintenance and service, stays between 23 and 28 percent between 1957 and 1974, before rising to around 30 percent from 1975 to 1985. From there it decreases steadily from 30 to 25 percent in 2000. The third line, for other noncapital, starts at 10 percent in 1957 and steadily rises to about 22 percent by 1976, where it stays through to 2000. And the fourth line, for bond retirement, stays around 4 to 6 percent for the entire time period.
Back
to Chapter 6
Return to top
Page last modified on November 7, 2014
