U.S. Department of Transportation
Federal Highway Administration
1200 New Jersey Avenue, SE
Washington, DC 20590
202-366-4000

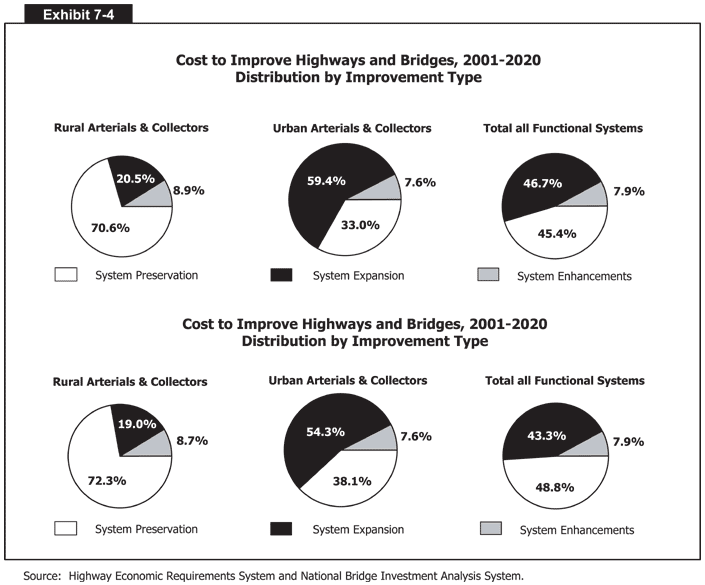
Exhibit 7-4 is a series of six pie charts. The first three show the cost to maintain highways and bridges, 2001-2020, by improvement type. In the first pie chart-for rural arterials and collectors-70.6 percent of costs go to system preservation, 20.5 percent to system expansion, and 8.9 percent to system enhancements. In the second pie chart-for urban arterials and collectors-59.4 percent goes to system expansion, 33.0 percent to system preservation, and 7.6 percent to system enhancements. And in the third pie chart-for the total of all functional systems-46.7 percent goes to system expansion, 45.4 percent to system preservation, and 7.9 percent to system enhancements. The second three pie charts show the cost to improve highways and bridges, 2001-2020, by improvement type. In the first pie chart-for rural arterials and collectors-72.3 percent of costs go to system preservation, 19.0 percent to system expansion, and 8.7 percent to system enhancements. In the second pie chart-for urban arterials and collectors-54.3 percent goes to system expansion, 38.1 percent to system preservation, and 7.6 percent to system enhancements. And in the third pie chart-for the total of all functional systems-48.8 percent goes to system preservation, 43.3 percent to system expansion, and 7.9 percent to system enhancements.
Back
to Chapter 7