U.S. Department of Transportation
Federal Highway Administration
1200 New Jersey Avenue, SE
Washington, DC 20590
202-366-4000
Conditions and Performance
Status
of the Nation's Highways, Bridges, and Transit:
2002 Conditions and Performance Report
|
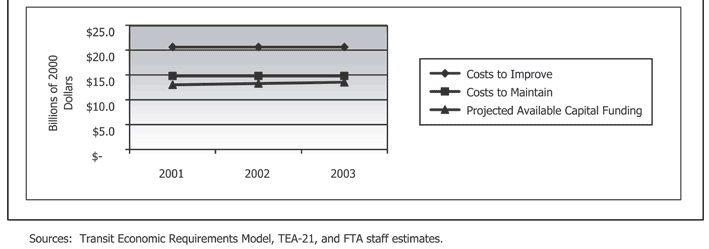
Exhibit 8-11:
Projected Transit Available Capital Funding Versus Investment Requirements,
2000-2003 (Billions of 2000 Dollars)
 Exhibit 8-11 includes a chart that shows the projected average annual transit available capital funding from 2001 to 2003 in billions of 2000 dollars. The vertical axis measures billions of 2000 dollars from 0 to 25 in increments of $5 billion. The horizontal axis measures the years 2001, 2002, and 2003. The cost to improve is $20.62 billion for all three years, creating a straight line. The second line is also straight, since the cost to maintain is $14.84 billion each of the three years. The third line, for projected available capital funding, starts at $13.02 billion in 2001, goes up slightly to $13.28 billion in 2002, and ends at $13.54 billion in 2003.
Source: Transit Economic Requirements Model, TEA-21, and FTA staff estimates.
Back
to Chapter 8
Return to top
Page last modified on November 7, 2014
